 Open Access Article
A coumarin based gold(I)-alkynyl complex: a new class of supramolecular hydrogelators†
Artur J.
Moro
a,
Bertrand
Rome
ab,
Elisabet
Aguiló
c,
Julià
Arcau
c,
Rakesh
Puttreddy
d,
Kari
Rissanen
d,
João Carlos
Lima
*a and
Laura
Rodríguez
*c
aREQUIMTE, Dep. de Química, Universidade Nova de Lisboa, Monte de Caparica, Portugal. E-mail: lima@fct.unl.pt; Fax: +351 212948550; Tel: +351 212948300 (Ext. 10923)
bEcole polytechnique de Bruxelles, Université libre de Bruxelles, 50 Av F.D Roosevelt, 1050 Bruxelles, Belgium
cDepartament de Química Inorgànica, Universitat de Barcelona, c/Martí i Franquès, 1-11, 08028 Barcelona, Spain. E-mail: laura.rodriguez@qi.ub.es; Fax: +34 934907725; Tel: +34 934039130
dDepartment of Chemistry, Nanoscience Center, P.O. Box 35, 40014 Jyväskylä, Finland
First published on 5th December 2014
Abstract
A phosphine-gold(I)-alkynyl-coumarin complex, [Au{7-(prop-2-ine-1-yloxy)-1-benzopyran-2-one}(DAPTA)] (1), was synthesized and the formation of long luminescent fibers in solution was characterized via fluorescence microscopy and dynamic light scattering. The fibers presented strong blue and green luminescence, suggesting that the gold(I) in the complex increased intersystem crossing due to the heavy atom effect, resulting in a significant increase in triplet emission. The X-ray structure of the fibers indicates that both aurophilic, π–π interactions and hydrogen bonding contribute to their formation in aqueous solvents.
Introduction
Supramolecular gels1 have become a topic of increasing interest in recent years. Compared to traditional polymers, in which the individual monomers are linked irreversibly by covalent bonds, supramolecular linkages are reversible, which can result in new dynamic structures with interesting and new properties completely different from those observed on the individual molecules.2In particular, self-assembled supramolecular hydrogels have attracted much attention during the past few decades because of promising high-technology applications in very diverse fields such as biomedicine, nanoelectronics and catalysis.3–9 These colloidal materials can be formed either by low- or high-molecular-weight hydrogelators by means of non-covalent interactions (e.g., π–π stacking, van der Waals forces, hydrogen bonds, and hydrophobic interactions).10,11 Among these materials, metallogels12–14 represent an important subclass where at least one metallic element has been incorporated into the gel network, but they have been a subject of study only in the last few years. The presence of metal ions should be highlighted since they may also modify the physical properties of the gels.15
In contrast to the development of coordination polymeric gelators, the use of discrete small-molecule metal complexes such as metallogelators has been relatively scarce and it was only recently that a number of reports on the gelation properties of metal complexes, such as Au(I), Au(III) and Pt(II), have appeared.12,15–18 Interestingly, this process becomes unpredictable in some cases.
The formation of the supramolecular gels and metallogels depends on the concentration of the monomer and on the strength of the non-covalent interactions responsible for holding the monomers together.2,19 In general, hydrogen bonds are among the most often used non-covalent interactions in the formation of supramolecular gels and polymers. Nevertheless, in the particular case of organometallic complexes like gold(I) derivatives, the possible establishment of Au(I)⋯Au(I) (aurophilic) bonds is also observed to be an important driving force responsible for the aggregation.
In fact, the formation of aurophilic interactions in the crystal structures of gold compounds, as well as in solution, has fascinated chemists for decades. The aggregation of gold compounds in this fashion arises from relativistic effects that are at a maximum for gold compared to other heavy elements.20–22 One reason for this interest is that gold compounds exhibit interesting luminescence properties, in both the solid-state and in solution that could be modulated by the presence of these Au⋯Au interactions.22–27
Aurophilic interactions can also lead to fascinating supramolecular architectures21,22,28–32 and are known to present stabilization energies to their crystal structures in the range of 7–12 kcal mol−1.33,34 This energy range should be stressed since it is comparable to that normally associated with conventional hydrogen bonding.
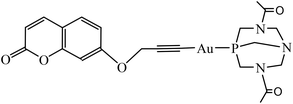
Among gold(I) supramolecular structures, gold(I) alkynyl derivatives are specially denoted due to the preference of gold(I) for a linear coordination geometry, together with the linearity of an acetylide unit and its π-unsaturated nature. These structural characteristics have made the alkynyl gold(I) complexes attractive building blocks for organometallic oligomeric and polymeric materials which may possess unique properties in different fields.22 Related to all of this, we have recently described the formation of luminescent hydrogelators with two gold(I) alkynyl derivatives with a very simple chemical structure ([Au(4-pyridylethynyl)(phosph)] {phosph = PTA (1,3,5-triaza-7-phosphaadamantane);17 DAPTA = 3,7-diacetyl-1,3,7-triaza-5-phosphabicyclo[3.3.1]nonane)}.18 In this work, the synthesis of a new hydrogelator that contains a propargyloxicoumarin group instead of pyridylethynyl is described (Chart 1). In order to try to understand better the gelation process with these discrete molecules, we report on the analysis of the aggregation process by different spectroscopical and microscopic techniques and the results are compared with the X-ray crystal diffraction data retrieved for this complex.
Materials and methods
Reagents
The synthesis of [Au{7-(prop-2-ine-1-yloxy)-1-benzopyran-2-one}(DAPTA)] (1) is described in previous reports.35Physical measurements
Absorption spectra were recorded on a Varian Cary 5000 UV-Vis spectrophotometer in a 3 mL (10 × 10 mm wide) quartz cell. Fluorescence measurements were performed on a Horiba–Jobin–Yvon SPEX Fluorolog 3.22 in a 3 mL (10 × 10 mm wide) quartz cell. Emission quantum yields were measured employing 7-methoxy-4-methylcoumarin as a reference (ϕF = 0.124, 25 °C, methanol).Dynamic light scattering experiments were performed on a Horiba Scientific Nanoparticle Analyzer SZ-100 in 3 mL (10 × 10 mm wide) quartz cells. The samples were filtered before analysis using a 0.46 μm polystyrene membrane disc filter.
Fluorescence microscopy was recorded on an Axioplan 2ie Zeiss imaging microscope equipped with a NikonDXM1200F digital camera. Excitation light for fluorescence imaging was selected using filters in the range of 300–400 and 450–490 nm respectively.
Preparation of the gel
Solid 1 was dissolved in water in different concentration ranges (0.01–0.02% by weight). The sample was maintained under sonication for ca. 20 minutes and left at room temperature at least for 4 hours.X-ray crystal structure determination
Data for 1 were collected at 123 K on an Agilent SuperNova diffractometer with an Atlas detector using mirror-monochromated Cu-Kα radiation (λ = 1.54184 Å). The CRYSALISPRO36 program was used for the data collection and processing of complex 1. The intensities were corrected for absorption using the multi-scan absorption correction method.36 The structure of 1 was solved by direct methods with the SHELXS solution program.37 The structure was refined by full-matrix least-squares calculations based on F2 using SHELXL-201338 integrated into the WINGX39 program package. Hydrogen atoms were included in calculated positions as riding atoms, with SHELXL-201338 defaults. X-ray crystallographic data for 1 are given in Table S1 (see ESI†).CCDC-1026387 contains the supplementary crystallographic data for this paper.
Results and discussion
The synthesis and characterization of 1 was recently reported by us, and its photophysical properties were reported in methanol.35 Herein we have described the observed formation of hydrogels (see Fig. S1†) and compared it with the previous data obtained with pyridylethynyl derivatives.17,18 In the case of 1, apart from the Au(I) atoms, the structure of the complex possesses a phosphine and a coumarin unit at both ends of the molecule. While the former moiety provides an increase in hydrophilicity, the latter moiety presents strong absorption and emission in the UV region of the spectrum. Thus, we measured the optical properties of the coumarin as a means to study the formation of aggregates that ultimately lead to new luminescent soft materials such as hydrogels.Absorption/fluorescence spectroscopy
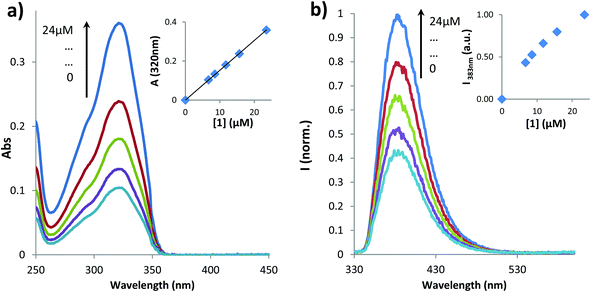
The effect of concentration on the absorption and emission of complex 1 was primarily studied in methanol (Fig. 1) where aggregates are not expected to be formed.As can be seen in Fig. 1a and its inset, no changes were observed both in the shape and in the values for absorbance maximum of the spectra up to 24 μM, with a calculated molar absorptivitiy (ε) of 15![[thin space (1/6-em)]](https://www.rsc.org/images/entities/char_2009.gif) 259 M−1 cm−1 at 320 nm. Although the spectra show that linearity for the fluorescence/concentration ratio is only achieved up to 12 μM (the slight curvature in emission at 383 nm arises from the inner filter and reabsorption effects), the calculated quantum yields remain constant throughout the entire studied concentration range (see Table 1).
259 M−1 cm−1 at 320 nm. Although the spectra show that linearity for the fluorescence/concentration ratio is only achieved up to 12 μM (the slight curvature in emission at 383 nm arises from the inner filter and reabsorption effects), the calculated quantum yields remain constant throughout the entire studied concentration range (see Table 1).
| [1] (μM) | ϕ F |
|---|---|
| 24 | 0.053 |
| 16 | 0.057 |
| 12 | 0.052 |
| 9 | 0.057 |
| 7 | 0.054 |
In water, complex 1 did not dissolve completely at concentrations above 100 μM. In fact, absorption spectra of 1 for concentrations ranging from 5 to 100 μM revealed an increase in the baseline which is a clear indication of precipitation/aggregation phenomena. The analysis of the absorption changes against concentration led us to calculate the critical gelation concentration as 28.5 μM (Fig. S2†).
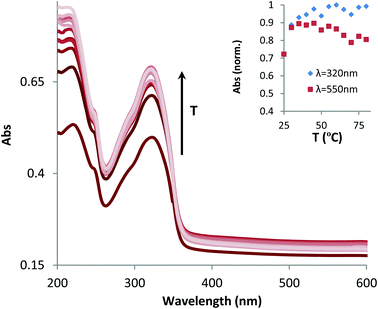
The influence of temperature on the aggregation of 1 was also studied by recording the spectral changes in absorption between 25 and 80 °C (Fig. 2).
Although the shape and the maximum absorption wavelength (320 nm) for the coumarin unit were constant, the value of absorbance at the maximum increased with temperature until reaching a plateau, as depicted in the inset of Fig. 2. However, the values of absorbance at 550 nm, i.e. the tail of the spectrum corresponding essentially to the baseline, reveal the same trend. This rise in absorbance in the baseline is typical for the increased opacity/optical density of the solution corresponding to precipitation of particles. Therefore, we assume that an increased temperature induces the aggregation of 1. This behavior occurs mainly in the temperature range of 25–40 °C, similarly to NIPAM type polymers which collapse with temperature due to breaking of hydrogen bonds with water (solvent) molecules that simultaneously favors hydrophobic interactions.40
A hypothesis to explain these results can be found in the thermodynamics of the system. In most cases, the thermodynamics of aggregation can be described as:
| ΔGaggregation = ΔH − TΔS |
In this particular case, however, the molecule comprises a hydrophobic part (coumarin) and a hydrophilic moiety (phosphine), and the initial formation of micellar-type structures is a possible aggregation mechanism (further evidence was obtained in the following sections). The hydrophobic parts are then surrounded by a shell of water molecules organized in such a way to shade it from the solvent. For aggregation to happen, this shell must be displaced momentarily, which creates a rise in entropy and thus changes the initial formula towards this modified thermodynamic equilibrium:
| ΔGaggregation = ΔH − T (ΔSaggregation + ΔSsolvent) |
If the solvent contribution (positive) is bigger than the aggregation contribution (negative) to entropy, then increasing the temperature will lead to a faster aggregation by increasing the driving force.
Dynamic light scattering
In order to obtain more insight into the size of the aggregates, screening tests at different concentrations were performed using dynamic light scattering. The overall results show that aggregates can be found down to the micromolar concentration range in water (Fig. S3†). The size distribution of the aggregates allows the identification of a single population with a well-defined mean diameter (ranging from 70 to 140 nm, depending on the concentration). However, in all cases, a high polydispersity index is recorded, which is a strong indication of the presence of larger aggregates. Nevertheless, at the lowest concentrations (50 μM or lower) and after filtration with a 0.46 μm filter, we can obtain good mono-exponential fittings of the auto-correlation curves, with low polydispersity index (PDI) values, suggesting the presence of spherical nanostructures.The influence of temperature on the formation/destruction of aggregates was studied by performing temperature ramps at 38 μM in water as a means to complement the results of absorption experiments (Fig. 3).
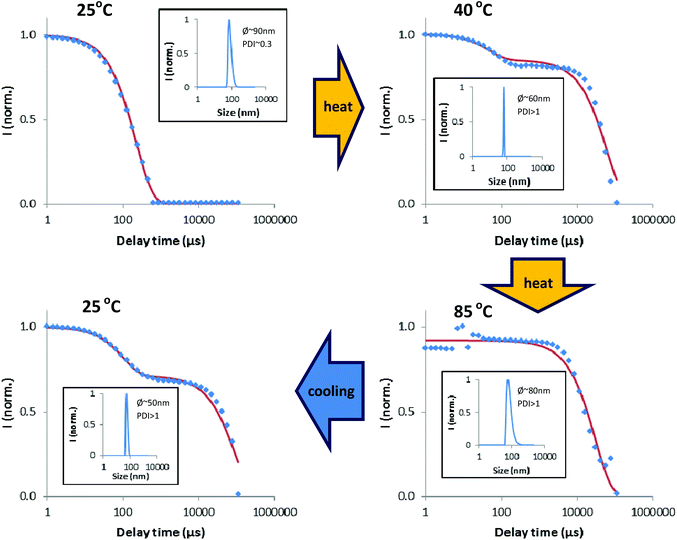 | ||
| Fig. 3 Evolution of DLS scans upon increasing the temperature from 25 °C to 85 °C and cooling back to 25 °C. | ||
As one can observe, a mono-exponential fitting of the DLS correlation function is achieved, with a monodisperse population of aggregates of about 90 nm, typical for micellar-like aggregates that could be created from hydrophobic interactions, as mentioned in the previous section. Raising the temperature to about 40 °C leads to a bi-exponential function due to the appearance of a long decay signal, a clear indication of the formation of bigger structures.
This fact can be explained based on the molecular structure of complex 1 if we consider that linear Au(I)–alkynyl complexes are known to form intermolecular aurophilic bonds and produce gels.17,18 If this is the case, the formation of linear aggregates/fibers may explain the high PDI values, since the DLS models for the determination of hydrodynamics assume a spherical shape for the analyzed samples.
Upon further increasing the temperature, we can no longer observe the initial population of smaller aggregates (in the nm range), although one cannot exclude their presence since the light scattering phenomenon is intrinsically linked to the size in a non-linear way, i.e., bigger particles/structures scatter more light than smaller ones. Finally, by decreasing the temperature, the initial signal for small particles is partially recovered. These results are consistent with the aforementioned hypothesis for temperature-favoured aggregation.
Fluorescence microscopy
Images of the aggregates at different concentrations of 1 were obtained upon drying the solutions and analyzing the samples under the microscope. Fig. 4 shows bright field images of dried solutions of 1. | ||
| Fig. 4 Bright field microscopic images of dried solutions of 1 at (a) 3.8 μM, (b) 38 μM and (c) 1000 μM. | ||
Detailed observation of pictures from Fig. 4 reveals the evolution of aggregation upon increasing the concentrations of 1. Indeed, at low concentration, only small spherical aggregates are observed which is consistent with the results from DLS, even though the size scales are quite different, since the solutions for DLS were previously filtered with a 460 nm filter and particles smaller than 460 nm are not seen under the microscope. A ten-fold more concentrated sample of 1 (image b) already reveals the presence of agglomerates of particles in a linear fashion, while at 1 mM a highly reticulated network of fibers can be clearly identified in the picture which accounts for the observed high polydispersity of the samples in DLS measurements.
Pictures were also taken under UV irradiation using two different bandpass filters. A detailed analysis of these pictures shows that, while green emission is present throughout the whole reticulated network of fibers (Fig. 5b), blue emission can only be detected at the extremities (Fig. 5a).
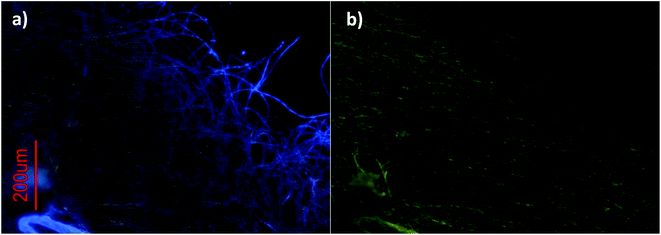 | ||
| Fig. 5 Fluorescence microscopy images of dried solutions of 1 at 1 mM using a bandpass filter of (a) 300–400 nm and (b) 450–490 nm. | ||
A possible explanation for this behavior is the heavy-atom effect induced by the gold atoms, i.e., in the bulk of the aggregate the fibers are highly crosslinked. This causes the gold atoms and coumarins to be closer to each other than in the case of isolated linear fibers that are linked by aurophilic interactions.
Indeed, since it has been shown that this kind of compound shows a linear architecture L1–Au–L2 and that it aggregates by Au⋯Au interactions,22 the coumarin and gold atoms can never be closer than the intramolecular distance, which in the case of 1 consists of four chemical bonds due to the methoxy–alkynyl spacer. However, once this “dense” aggregation phase is reached, gold and coumarin units can be, on average, at a shorter distance than the intramolecular distance, thus allowing for a more efficient intersystem crossing to take place and resulting in coumarin phosphorescence emission. Previous data obtained with ([Au(4-pyridylethynyl)(phosph)] {phosph = PTA (1,3,5-triaza-7-phosphaadamantane)17 and DAPTA = 3,7-diacetyl-1,3,7-triaza-5-phosphabicyclo[3.3.1]nonane)}18 complexes have been a good reference for the analysis of these gels. It must be highlighted that the comparison with previous complexes led us to suggest that the presence of DAPTA phosphine significantly increases the entanglement of the aurophilic gels.
X-ray crystallography
As mentioned above in the text, the formation of particles can occur if we consider the amphiphilic character of 1 that yields micelle-type structure. The growth of fibers at higher concentrations may have resulted from the formation of weak aurophilic interactions in complex 1 between linearly coordinated Au(I) molecules.Although the formation of large aggregates with our gold(I) complexes has been investigated by different spectroscopic and microscopic techniques, X-ray crystallography is one basic powerful tool to visualize and analyze the structural features of metal complexes for the presence of intra- and intermolecular interactions. However, highlighting the demanding work with gels, we successfully isolated single crystals of complex 1 suitable for X-ray analysis by diffusing hexane into a dichloromethane solution of 1.
Selected bond distances and angles are summarized in Table 2.
| Distance | (Å) | Angle | (°) |
|---|---|---|---|
| Au1–Au2 | 3.1274(4) | Au1–Au2–Au3 | 147.611(12) |
| Au2–Au3 | 3.1316(4) | C22–Au1–P2 | 176.9(2) |
| Au1–Au3 | 6.0106(5) | C1–Au2–P1 | 178.2(2) |
| Au1–P2 | 2.2782(18) | C43–Au3–P3 | 177.9(2) |
| Au2–P1 | 2.2706(18) | C1–C2–C3 | 175.3(13) |
| Au3–P3 | 2.2647(19) | C22–C23–C24 | 178.4(10) |
| Au1–C22 | 2.043(8) | C43–C44–C45 | 175.9(9) |
| Au2–C1 | 2.013(7) | P1–Au2–Au1 | 90.52(5) |
| Au3–C43 | 2.013(6) | P1–Au2–Au3 | 91.44(5) |
| C1–C2 | 1.185(12) | P3–Au3–Au2 | 90.50(5) |
| C2–C3 | 1.450(13) | P2–Au1–Au2 | 92.40(5) |
| C10–C11 | 1.463(15) | ||
| C31–C32 | 1.438(15) | ||
| C52–C53 | 1.418(15) |
The crystal structure of 1 confirms the coordination of alkyne and phosphine ligands to gold, as shown in Fig. 6. The asymmetric unit solved in the triclinic space group P![[1 with combining macron]](https://www.rsc.org/images/entities/char_0031_0304.gif) contains three independent alkyne and phosphine ligands coordinated to gold(I) displaying typical linear geometry with C–Au–P angles ranging from 176.9(2)° to 178.2(2)°. These values are similar to those of the recently reported gold alkynyl derivative containing PTA phosphine ligands.41
contains three independent alkyne and phosphine ligands coordinated to gold(I) displaying typical linear geometry with C–Au–P angles ranging from 176.9(2)° to 178.2(2)°. These values are similar to those of the recently reported gold alkynyl derivative containing PTA phosphine ligands.41
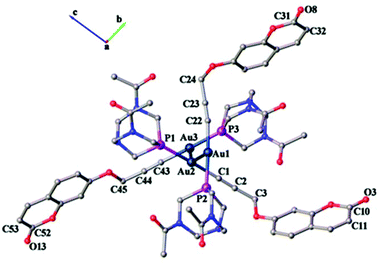 | ||
| Fig. 6 Asymmetric unit of complex 1 viewed down the a-axis displaying aurophilic interactions. Hydrogen atoms and solvent molecules are omitted for clarity. | ||
As seen in Table 1, shortened C–C single bond distances are found next to carbonyl oxygen for the organic ligand,35 due to the conjugation of π electrons of the aromatic rings with those of the carbonyl group. These values are synonymous with previously reported coumarin ligands (1.351, 1.432 and 1.432 Å respectively).42 The methylene group accommodates in the same plane as the alkynyl moieties with angles ranging between 175.9(7)° and 178.4(10)°, which are similar to the values found in the literature (177.6(2)°).35
The Au–C and C–C distances in the alkyne unit are observed to be, for the former, lower than that in previously reported alkyne derivatives and, for the latter, similar to that in similar gold(I) alkynyl complexes.35,43–46 As shown in Fig. 6, the ligand molecules coordinated to linear geometry Au(I) are twisted in an orthogonal fashion to avoid steric hindrance with torsional angles 111.30(7)° [P1–Au2–Au1–P2] and 120.20(7)° [P3–Au3–Au2–P1]. Subsequently, the linearly coordinated Au(I) ions self-assemble via Au⋯Au interactions at distances of 3.1274(4) Å [Au1–Au2] and 3.1316(4) Å [Au2–Au3] to give a zigzag 1-D polymeric chain, as shown in Fig. 7. The aurophilic interactions observed in complex 1 are similar to those observed in gold(I) derivatives with PTA43,44,47,48 and are shorter than values found in similar 1-D polymeric complexes of [Au(PTA)4][Au(CN2)]49 and [Au(C![[triple bond, length as m-dash]](https://www.rsc.org/images/entities/char_e002.gif) C–CH2–SC5H4N)(PTA)]50 with distances of ca. 3.45 Å and ca. 3.27 Å, respectively.
C–CH2–SC5H4N)(PTA)]50 with distances of ca. 3.45 Å and ca. 3.27 Å, respectively.
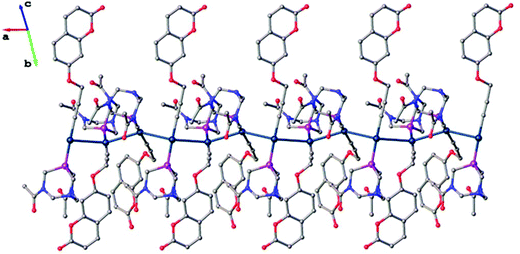 | ||
| Fig. 7 1-D polymeric structure of complex 1, hydrogen atoms and solvent molecules are omitted for clarity. | ||
In the 3-D crystal packing of complex 1, the planar coumarin ligands in each 1-D polymeric chain are positioned in three orientations to give a star-shaped (Fig. S4 and S5†) motif around the irregular aurophilic wire exhibiting π–π interactions, with centroid–centroid distances of 3.69(3) Å (Fig. S3†). These distances are similar to our anionic gold(I) dialkynyl-coumarin complex (3.646 Å) very recently reported by us.35
H-bondings are also observed between the methylene groups and the acetyl units of the DAPTA phosphine with an O⋯H distance of ca. 2.34–2.79 Å.
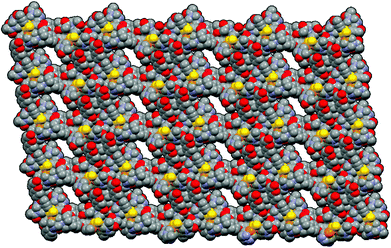
All these weak interactions (aurophilic, π–π stacking and hydrogen bondings) contribute complex 1 to pack three-dimensionally to give MOF-like structures, as shown in Fig. 8. Curiously, to the best of our knowledge, a porous network with 1-D aurophilic interactions that self-assembled either linearly or non-linearly to form aromatic ligands and was stabilized through such interactions to generate MOF-like structures has no precedent in the literature.
Taking into consideration these data, we could expect hydrogen-bonding and π–π stacking interactions to be more favoured in water, being the driving force of the formation of gels. On the other hand, theoretical calculations carried out with similar aurophilic hydrogelators indicate a clear involvement of Au(I)⋯Au(I) interactions in the formation of these larger aggregates.34
Conclusions
The design and characterization of an alkynyl gold(I) complex with a coumarin fluorophore as a new hydrogelator for the synthesis of luminescent soft materials has been performed.Absorption and DLS studies in aqueous media suggested the formation of aggregates at low micromolar concentrations. The same techniques indicated that aggregation was favoured with increasing the temperature.
Fluorescence microscopy revealed the presence of luminescent fiber-like structures at milimolar concentrations. While strong blue emission (corresponding to the fluorescence of the coumarin) was only observed in isolated fibers, green emission (derived from coumarin phosphorescence) was observed throughout the bulk of the reticulated network of fibers. This effect is accounted for by the spatial proximity of coumarins and gold(I) atoms, which leads to an increase in intersystem crossing and, consequently, quenching of fluorescence and enhancement of triplet emission (T1–S0 radiative pathway).
X-ray crystallography confirmed the existence of π–π interactions, hydrogen bondings as well as aurophilic interactions, resulting in highly ordered linear assemblies.
Acknowledgements
The support and sponsorship provided by COST Action CM1005 is acknowledged. Authors are also grateful to the Ministerio de Ciencia e Innovación of Spain (project CTQ2012-31335), Fundação para a Ciência e Tecnologia of Portugal (PTDC/QUI-QUI/112597/2009; PEst-C/EQB/LA0006/2011) and Academy of Finland (K.R., grant no. 263256 and 265328). A.M. thanks FCT for a post-doctoral grant (SFRH/BPD/69210/2010).References
- S. Dong, B. Zheng, D. Xu, X. Yan, M. Zhang and F. Huang, Adv. Mater., 2012, 24, 3191 CrossRef CAS PubMed.
- M. Fleischer and C. Schmuck, Chem. Commun., 2014, 50, 10464 RSC.
- S. Banerjee, R. K. Das and U. Maitra, J. Mater. Chem., 2009, 19, 6649 RSC.
- A. R. Hirst, B. Escuder, J. F. Miravet and D. K. Smith, Angew. Chem., Int. Ed., 2008, 47, 8002 CrossRef CAS PubMed.
- N. M. Sangeetha and U. Maitra, Chem. Soc. Rev., 2005, 34, 821 RSC.
- T. Vermonden, R. Censi and W. E. Hennink, Chem. Rev., 2012, 112, 2853 CrossRef CAS PubMed.
- E. A. Appel, J. del Barrio, X. J. Loh and O. A. Scherman, Chem. Soc. Rev., 2012, 41, 6195 RSC.
- D. D. Díaz, D. Kühbeck and R. J. Koopmans, Chem. Soc. Rev., 2011, 40, 427 RSC.
- S. Saha, J. Bachl, T. Kundu, D. Díaz Díaz and R. Banerjee, Chem. Commun., 2014, 50, 7032 RSC.
- S.-T. Lam, G. Wang and V. W.-W. Yam, Organometallics, 2008, 27, 4545 CrossRef CAS.
- M.-O. M. Piepenbrock, G. O. Lloyd, N. Clarke and J. W. Steed, Chem. Rev., 2010, 110, 1960 CrossRef CAS PubMed.
- A. Yiu-Tam and V. W.-W. Yam, Chem. Soc. Rev., 2013, 42, 1540 RSC.
- J. Zhang and C.-Y. Su, Coord. Chem. Rev., 2013, 257, 1373 CrossRef CAS PubMed.
- J. H. Jung, J. H. Lee, J. R. Silverman and G. John, Chem. Soc. Rev., 2013, 42, 924 RSC.
- T. H. T. Hsu, J. J. Naidu, B.-J. Yang, M.-Y. Jang and I. J. B. Lin, Inorg. Chem., 2012, 51, 98 CrossRef CAS PubMed.
- V. K.-M. Au, N. Zhu and V. W.-W. Yam, Inorg. Chem., 2013, 52, 558 CrossRef CAS PubMed.
- R. Gavara, J. Llorca, J. C. Lima and L. Rodríguez, Chem. Commun., 2013, 49, 72 RSC.
- E. Aguiló, R. Gavara, J. C. Lima, J. Llorca and L. Rodríguez, J. Mater. Chem. C, 2013, 1, 5538 RSC.
- T. F. A. de Greef, M. M. J. Smudlers, M. Wolffs, A. P. H. J. Schenning, R. P. Sijbesma and E. W. Meijer, Chem. Rev., 2009, 109, 5687 CrossRef CAS PubMed.
- S. Sulfur and P. Braun stein, Chem. Soc. Rev., 2011, 40, 2741 RSC.
- H. Schmidbaur and A. Schier, Chem. Soc. Rev., 2012, 41, 370 RSC.
- J. C. Lima and L. Rodríguez, Chem. Soc. Rev., 2011, 40, 5442 RSC.
- R. Visbal and M. C. Gimeno, Chem. Soc. Rev., 2014, 43, 3551 RSC.
- R. Visbal, I. Ospino, J. M. L. ópez-de-Luzuriaga, A. Laguna and M. C. Gimeno, J. Am. Chem. Soc., 2013, 135, 4712 CrossRef CAS PubMed.
- E. R. T. Tiekink and J.-G. Kang, Coord. Chem. Rev., 2009, 253, 1627 CrossRef CAS PubMed.
- X. He and V. W.-W. Vivian, Coord. Chem. Rev., 2011, 255, 2111 CrossRef CAS PubMed.
- L. Rodríguez, J. C. Lima, M. Ferrer, O. Rossell and M. Engeser, Inorg. Chimi. Acta, 2012, 381, 195 CrossRef PubMed.
- R. J. Puddephatt, Chem. Soc. Rev., 2008, 37, 2012 RSC.
- M. J. Katz, K. Sakai and D. B. Leznoff, Chem. Soc. Rev., 2008, 37, 1884 RSC.
- H. E. Abdou, A. A. Mohamed, J. P. Fackler, A. Burini, R. Galassi, J. M. Lopez-de-Luzuriaga and M. E. Olmos, Coord. Chem. Rev., 2009, 253, 1661 CrossRef CAS PubMed.
- M. Ferrer, A. Gutiérrez, M. Mounir, L. Rodríguez, O. Rossell, M. Font-Bardia, P. Gómez-Sal, A. Martín and X. Solans, Organometallics, 2011, 30, 3419 CrossRef CAS.
- E. R. T. Tiekink, Coord. Chem. Rev., 2014, 275, 130 CrossRef CAS PubMed.
- H. Schmidbaur and A. Schier, Gold Bull., 2000, 33, 3 CrossRef CAS.
- R. Gavara, E. Aguiló, C. Fonseca Guerra, L. Rodríguez and J. C. Lima, submitted.
- J. Arcau, V. Andermark, E. Aguiló, A. Gandioso, A. Moro, M. Cetina, J. C. Lima, K. Rissanen, I. Ott and L. Rodríguez, Dalton Trans., 2014, 43, 4426 RSC.
- Oxford Diffraction, Xcalibur CCD System, CRYSALISPRO, Oxford Diffraction Ltd, Abingdon, England, 2013 Search PubMed.
- M. C. Burla, M. Camalli, B. Carrozzini, G. L. Cascarano, C. Giacovazzo, G. Polidori and R. Spagna, J. Appl. Crystallogr., 2003, 36, 1103 CrossRef CAS.
- G. M. Sheldrick, Acta Crystallogr., Sect. A: Fundam. Crystallogr., 2008, 64, 112 CrossRef CAS PubMed.
- L. J. Farrugia, J. Appl. Crystallogr., 1999, 32, 837 CrossRef CAS.
- N. Jordão, R. Gavara and A. J. Parola, Macromolecules, 2013, 46, 9055 CrossRef.
- E. García-Moreno, S. Gascón, M. J. Rodriguez-Yoldi, E. Cerrada and M. Laguna, Organometallics, 2013, 32, 3710 CrossRef.
- K. Ueno, Acta Crystallogr., 1985, 41, 1786 Search PubMed.
- E. Vergara, E. Cerrada, A. Casini, O. Zava, M. Laguna and P. J. Dyson, Organometallics, 2010, 29, 2596 CrossRef CAS.
- F. Mohr, E. Cerrada and M. Laguna, Organometallics, 2006, 25, 644 CrossRef CAS.
- M. Ferrer, A. Gutiérrez, L. Rodríguez, O. Rossell, J. C. Lima, M. Font-Bardia and X. Solans, Eur. J. Inorg. Chem., 2008, 2899 CrossRef CAS.
- M. Ferrer, L. Rodríguez, O. Rossell, F. Pina, J. C. Lima, M. Font-Bardia and X. Solans, J. Organomet. Chem., 2003, 678, 82 CrossRef CAS.
- J. M. Forward, D. Bohmann, J. P. Fackler and R. J. Staples, Inorg. Chem., 1995, 34, 6330 CrossRef CAS.
- Z. Assefa, B. G. McBurnett, R. J. Staples and J. P. Fackler Jr., Inorg. Chem., 1995, 34, 4965 CrossRef CAS.
- Z. Assefa, M. A. Omary, B. G. McBurnett, A. A. Mohamed, H. H. Patterson, R. J. Staples and J. P. Fackler, Inorg. Chem., 2002, 41, 6274 CrossRef CAS PubMed.
- E. García-Moreno, S. Gascón, M. J. Rodríguez-Yoldi, E. Cerrada and M. Laguna, Organometallics, 2013, 32, 3710 CrossRef.
Footnote |
| † Electronic supplementary information (ESI) available: Hydrogel formation with complex 1 checked by the inverted tube method (Fig. S1); absorption spectra of 1 between 5 and 100 μM in water. Inset: Plot of the absorption at 400 nm vs. concentration (Fig. S2); DLS auto-correlation data (left) and the resulting size distributions (right) of aqueous solutions of 1 at different concentrations in water (Fig. S3); schematic representation of (a) the star-shaped 1-D polymeric structure of 1 and (b) the observed π–π interactions (Fig. S4); 3-D crystal packing of 1 (Fig. S5). X-ray crystallographic data for 1 (Table S1). CCDC 1026387. For ESI and crystallographic data in CIF or other electronic format see DOI: 10.1039/c4ob02077d |
| This journal is © The Royal Society of Chemistry 2015 |

