 Open Access Article
Creative Commons Attribution 3.0 Unported Licence
Metal ion mediated transition from random coil to β-sheet and aggregation of Bri2-23, a natural inhibitor of Aβ aggregation†
Marek
Luczkowski
*a,
Riccardo
De Ricco
*b,
Monika
Stachura
c,
Slawomir
Potocki
a,
Lars
Hemmingsen
c and
Daniela
Valensin
*b
aFaculty of Chemistry, University of Wroclaw, F. Joliot Curie 14, 50-383 Wroclaw, Poland. E-mail: marek.luczkowski@chem.uni.wroc.pl
bDepartment of Biotechnology Chemistry and Pharmacy University of Siena, Via A. Moro, 53100 Siena, Italy. E-mail: daniela.valensin@unisi.it
cDepartment of Chemistry, University of Copenhagen, Universitetsparken 5, 2100 Copenhagen, Denmark
First published on 19th January 2015
Abstract
Furin-dependent maturation of the BRI2 protein generates the Bri2-23 fragment that is able to arrest the aggregation of amyloidβ, the peptide implicated in Alzheimer’s disease (AD). Bri2-23 contains cysteines at positions 5 and 22, which are likely to bind to metal ions such as Cu(I). Metal ions may play a role in the etiology of neurodegenerative disorders such as AD, and in this work we explore the metal ion induced folding and aggregation of Bri2-23 using Hg(II) and Ag(I) as spectroscopic probes with structural and ligand preferences similar to those of Cu(I), while not displaying redox activity under the experimental conditions. In general, interaction of Bri2-23 with soft metal ions changes the structural properties and solution behavior of the peptide that tune to increasing metal to peptide stoichiometry. Potentiometric, 199mHg PAC and ESI-MS data indicate that addition of up to 0.5 equivalents of Hg(II) to Bri2-23 yields a two-coordinated HgS2 structure at the metal site. While the free peptide is inherently unstructured, the presence of Ag(I) and Hg(II) gives rise to β-sheet formation. NMR spectroscopy supports the formation of β-sheet structure in the presence of 0.5 equivalents of Hg(II), and displays an interesting and marked change in the TOCSY spectra when increasing the Hg(II) to peptide stoichiometry from 0.5 to 0.7 equivalents, indicating the equilibrium between two structural analogues of the complex. Addition of more than 0.7 equivalents of Hg(II) gives rise to line broadening, presumably reflecting aggregation. This is further supported by ThT fluorescence studies showing that the Bri2-23 peptide does not aggregate over 24 hours, while addition of over 0.7 equivalents of Ag(I) or Hg(II) leads to increase of fluorescence, indicating that these metal ions induce aggregation. Thus, a model integrating all data into a coherent picture is that the metal ion binding to the two thiolates gives rise to folding of the peptide into a structure that is prone to aggregation, forming aggregates with a considerable amount of β-sheets. Molecular dynamics simulations initiated with structures that agree with NMR data additionally support this model.
Introduction
BRI2, also known as ITM2b, is a type II transmembrane protein with unknown function abundantly expressed in neuronal tissues. It is 266 amino acids long and can be divided into a large C-terminal extracellular domain, a transmembrane domain, and a short N-terminal cytoplasmic domain. Mutations of the ITM2b gene result in the expression of the protein precursors ABriPP and ADanPP.1 Like the amyloid precursor protein (APP), BRI2 is subject to enzymatic processing by a number of proteolytic enzymes, including prohormone furin-like convertases able to cleave the WT BRI2 protein near the C-terminus to produce a 23-amino acid peptide, called Bri2-23 (Fig. 1). Similarly to WT BRI2, ABriPP and ADanPP proteins also undergo proteolytic cleavage at the C-terminal region generating ABri and ADan peptides (Fig. 1).2,3 These peptides constitute the hallmarks of the Familiar British Dementia (FBD) and Familiar Danish Dementia (FDD) disorders, that share many mechanistic and pathological similarities with Alzheimer’s disease (AD).1 This process is initialized by the activation of the convertase in the trans region of the Golgi apparatus and continues once the secretory vesicle merges with the cellular membrane. Although both the Golgi lumen and extracellular space represent the exoplasmic face of the membrane, they differ in redox potential, with the lumen being a more reductive environment.4,5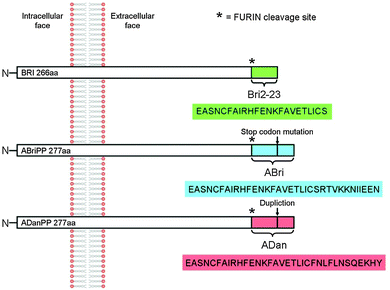 | ||
| Fig. 1 Schematic representation of Bri2 protein, its disease related forms and the products of their enzymatic processing by furin. | ||
The accumulation of ABri and ADan triggers a complex pathological cascade of events leading to neurodegeneration,6,7 while Bri2-23 preserves its solubility.8 Both ABri and ADan peptides exist in reduced or oxidized form due to the presence of two cysteine residues within the peptide sequence, which are able to form disulphide bridges.9 However, the consequences of the oxidation are found to be contradictory with respect to the peptides’ susceptibility to form oligomers and to aggregate.10 While the intramolecular disulphide bridge promotes the β sheet formation and aggregation with subsequent fibrillation in ABri,11 the amyloid-like aggregates of ADan are mainly formed by the reduced form of the peptide.10 These contradictory results imply that the upstream formation of non-fibrillar soluble oligomers rather than insoluble aggregates representing the pathogenic species causes neurodegeneration.10,12
Contrary to the ABri and ADan behavior, the wild type peptide, Bri2-23 has no toxic effects, yielding neither oligomers nor aggregates of high order. Interestingly, Bri2-23 has been found to inhibit Aβ aggregation in vitro and in vivo.13 This inhibitory effect is probably mediated by the fragment containing the –FENKF– sequence, which is analogous to that found in peptidic inhibitors of amyloid aggregation (–KLVFF–).14 Moreover, a peptide encompassing similar sequence has been demonstrated to interact with the glycine-zipper segment of Aβ1–40 (–G33XXXG37–) that is critical for the formation of a stable β sheet structure.14,15 In addition, the Bri2-23 peptide transported to the plasma membrane, is able to interact with APP reducing the access of α-, β- and γ-secretases to their respective cleavage sites.16 As a result, the release of any APP metabolite, including Aβ, is reduced.
Transition metal ions, like Cu, Zn and Fe are implicated in many neurodegenerative disorders and are believed to influence either the aggregation of amyloidogenic proteins or the formation of reactive oxygen species (ROS).17–28 Metal ions are involved in the aggregation of ABri and ADan peptides as well.20 On the other hand nothing is known about the metal binding abilities of Bri2-23 and more importantly whether metal ions affect its structure and aggregation ability. Bri2-23 contains several residues, like Cys, His, Glu (Fig. 1), which might interact with metal transition ions. In particular, the presence of two cysteines points out a possible Cu(I)–S2 coordination geometry and high Cu(I)–Bri2-23 affinity.
Herein, we aim at investigating the interaction between Cu(I) and Bri2-23 by combining experimental and theoretical methods. In order to elucidate the role, if any, played by the cuprous ion we used Hg(II) or Ag(I), as spectroscopic probes of Cu(I),29 while Molecular Dynamics calculations (MD) were performed by using Cu(I). The choice to use Hg(II) and Ag(I) as Cu(I) probes was due to the fact that Cu(I) is a redox active metal which can easily oxidize to Cu(II). For this reason sample preparation is usually performed in inert atmosphere and in the presence of reducing agents such as ascorbic acid or dithionite. Unfortunately, such a procedure does not completely exclude the presence of Cu(II), which although very small can interfere with Cu(I)–Bri2-23 binding in two different ways: (i) by interacting with the peptide and (ii) by oxidizing Cys residues. Moreover, Hg(II) and Ag(I) ions are commonly used to investigate Cu(I) sites, as demonstrated by previous studies.30–41 By applying a multitechnique approach we characterize the metal coordination sphere, the binding affinity and stoichiometry, the speciation profiles and the structural rearrangements of Bri2-23 induced by the metal ion.
Experimental section
Peptide synthesis and purification
Peptides were synthesized on an Activotec Activo-P11 automated peptide synthesizer, on a 0.25 mmol scale using standard Fmoc chemistry.42 Fmoc–Ser(tBu)–Wang resin was used as the solid support so that the resulting peptides would have a unprotected C-terminus as in the natural system. Cleavage from the resin was performed for 120 min in a 90% trifluoroethanol (TFA) solution containing 5% thioanisole, 2% anisole, and 3% ethanedithiol as free radical scavengers. After precipitation with cold ether, the peptides were redissolved in water and lyophilized to obtain a fluffy off-white powder. The solid was redissolved in 10% acetic acid and purified by reversed phase HPLC on a Varian Prostar HPLC with a preparative C18 column (Varian Pursuit XRs C 18) with a semi-linear gradient of 0.1% TFA in water to 0.1% TFA in 9![[thin space (1/6-em)]](https://www.rsc.org/images/entities/char_2009.gif) :
:![[thin space (1/6-em)]](https://www.rsc.org/images/entities/char_2009.gif) 1 CH3CN/H2O over 45 min. The identity of the peptides was verified by ESI (electrospray ionization) mass spectrometry.
1 CH3CN/H2O over 45 min. The identity of the peptides was verified by ESI (electrospray ionization) mass spectrometry.
ThT fluorescence spectroscopy assay
The fluorometric assay was performed on a FP-6500 JASCO spectrofluorometer. The peptide Bri2-23 was analyzed in the presence and in the absence of 0.7 equivalents of Ag(I) and Hg(II). 50 mM phosphate buffer solutions (pH 7.4) were used to dissolve the peptide to a final concentration of 10 μM. Thioflavin-T was added to all analyzed systems to give a 10 μM final concentration. All the samples were monitored immediately after the preparation and after one day of incubation at room temperature.Mass spectrometry
High-resolution mass spectra were obtained on a BrukerQ-FTMS spectrometer equipped with an Apollo II electrospray ionization source with an ion funnel. The mass spectrometer was operated in the positive ion mode with the following parameters: scan range m/z 400–1600, dry gas-nitrogen, temperature 170 °C, ion energy 5 eV. Capillary voltage was optimized to 4500 V to obtain the highest S/N ratio. Changing the voltage (±500 V) did not significantly affect the optimized spectra. The samples (metal/ligand in a 1![[thin space (1/6-em)]](https://www.rsc.org/images/entities/char_2009.gif) :
:![[thin space (1/6-em)]](https://www.rsc.org/images/entities/char_2009.gif) 1 stoichiometry, cBri2-23 = 1 × 10⁻⁴ M) were prepared in a 9
1 stoichiometry, cBri2-23 = 1 × 10⁻⁴ M) were prepared in a 9![[thin space (1/6-em)]](https://www.rsc.org/images/entities/char_2009.gif) :
:![[thin space (1/6-em)]](https://www.rsc.org/images/entities/char_2009.gif) 9
9![[thin space (1/6-em)]](https://www.rsc.org/images/entities/char_2009.gif) :
:![[thin space (1/6-em)]](https://www.rsc.org/images/entities/char_2009.gif) 2 MeOH/H2O/DMSO mixture in carbonate buffer pH 6.5. Variation of the solvent composition down to 5% of MeOH did not change the speciation. The sample was infused at a flow-rate of 3 mL min−1. The instrument was calibrated externally with the Tunemix™ mixture (Bruker Daltonik, Germany) in quadratic regression mode. Data were processed by using the Bruker Compass Data Analysis 4.0 program. The mass accuracy for the calibration was higher than 5 ppm, enabling together with the true isotopic pattern (SigmaFit) an unambiguous confirmation of the elemental composition of the obtained complex.
2 MeOH/H2O/DMSO mixture in carbonate buffer pH 6.5. Variation of the solvent composition down to 5% of MeOH did not change the speciation. The sample was infused at a flow-rate of 3 mL min−1. The instrument was calibrated externally with the Tunemix™ mixture (Bruker Daltonik, Germany) in quadratic regression mode. Data were processed by using the Bruker Compass Data Analysis 4.0 program. The mass accuracy for the calibration was higher than 5 ppm, enabling together with the true isotopic pattern (SigmaFit) an unambiguous confirmation of the elemental composition of the obtained complex.
Circular dichroism spectroscopy
CD spectra were recorded using a Jasco J-815 spectropolarimeter and the temperature was controlled with a PTC-423S temperature controller. A quartz cell with 1 cm optical path was used. The spectra range was 190–260 nm with a resolution of 0.1 nm and a bandwidth of 1 nm. A scan speed of 20 nm min−1 with 1 s response time was employed. Baseline spectra were subtracted from each spectrum and data were smoothed using the Savitzky–Golay method. Data were processed using Origin 7.0 spread sheet/graph package. The direct CD measurements (θ, in millidegrees) were converted to mean residue molar ellipticity, using the relationship mean residue Δε = θ/(33![[thin space (1/6-em)]](https://www.rsc.org/images/entities/char_2009.gif) 000 × c × l × number of residue). 10 μM solution of apo and metal (Ag(I) and Hg(II)) bound Bri2-23 either in phosphate buffer (50 mM) and at acidic pH (∼3.0) were analyzed.
000 × c × l × number of residue). 10 μM solution of apo and metal (Ag(I) and Hg(II)) bound Bri2-23 either in phosphate buffer (50 mM) and at acidic pH (∼3.0) were analyzed.
Potentiometry
Stability constants for protons and Hg(II) complexes of cysteine and Bri2-23 were calculated from titration curves obtained at 298 K using a total volume of 1.5 cm3. The metal ion concentration was 5 × 10⁻⁴ mol dm−3 and the metal to ligand ratio was 1![[thin space (1/6-em)]](https://www.rsc.org/images/entities/char_2009.gif) :
:![[thin space (1/6-em)]](https://www.rsc.org/images/entities/char_2009.gif) 2. Competition experiments were carried out with a 5 × 10⁻⁴ mol dm−3 Bri2-23 peptide in the presence of 1 equivalent of cysteine and 1 equivalent of Hg(II) after 1 hour of equilibration time was allowed before the titration started. NaOH was added using a 0.500 cm3 micrometer syringe which was calibrated by both weight titration and the titration of standard materials. The pH-metric titrations were performed at 298 K in 0.1 mol dm−3 NaCl on a MOLSPIN pH-meter system using a Mettler Toledo InLab semi micro combined electrode calibrated in hydrogen concentrations using HCl.43 The HYPERQUAD program was used for stability constant calculations.44 Standard deviations were computed by HYPERQUAD and refer to random errors only. They are, however, a good indication of the importance of a particular species in the equilibrium.
2. Competition experiments were carried out with a 5 × 10⁻⁴ mol dm−3 Bri2-23 peptide in the presence of 1 equivalent of cysteine and 1 equivalent of Hg(II) after 1 hour of equilibration time was allowed before the titration started. NaOH was added using a 0.500 cm3 micrometer syringe which was calibrated by both weight titration and the titration of standard materials. The pH-metric titrations were performed at 298 K in 0.1 mol dm−3 NaCl on a MOLSPIN pH-meter system using a Mettler Toledo InLab semi micro combined electrode calibrated in hydrogen concentrations using HCl.43 The HYPERQUAD program was used for stability constant calculations.44 Standard deviations were computed by HYPERQUAD and refer to random errors only. They are, however, a good indication of the importance of a particular species in the equilibrium.
Isothermal titration calorimetry
Calorimetric titrations of the peptide with Hg(II) ions were performed by isothermal titration microcalorimetry (ITC) using a Nano-ITC Instrument (Ta Instruments, USA). Experiments were carried out at 298 K in distilled water at pH 3.0. Peptide concentration was 0.5 mM (950 μL sample cell), while the metal ion concentration 5.0 mM (in the syringe). Both solutions were degassed for at least 15 min by using a TA Instruments degassing station, and then stored under nitrogen to minimize sample oxidation. Automated titrations were performed until saturation, up to the Hg(II)/peptide mole ratio of about 3. The experiment was repeated three times. Heat of dilution and mixing for each experiment were measured by titrating Hg(II) solution into distilled water at pH 3.5. The effective heat of each peptide metal ion interaction was corrected for dilution and mixing effects. Heats of bimolecular interactions were obtained by integrating the peaks of each injection. The data were analyzed using the NanoAnalyze software v. 2.3.6, using a “multiple sites” binding model. ΔH° and the corresponding binding constant, Ka, molar free energy of binding, ΔG°, and the molar entropy change, ΔS°, were attained from the fundamental equations of thermodynamics: ΔG° = −RT![[thin space (1/6-em)]](https://www.rsc.org/images/entities/char_2009.gif) ln
ln![[thin space (1/6-em)]](https://www.rsc.org/images/entities/char_2009.gif) Ka = ΔH° − T(ΔS°).
Ka = ΔH° − T(ΔS°).
Perturbed angular correlation spectroscopy
The following stock solutions were prepared and used for the PAC experiments: Bri2-23 (2 mM, concentration determined by the Ellman’s test),45 phosphate buffer of pH 3.0 and pH 7.5 (0.93 M), and HgCl2 (3.0 mM). The final samples contained 50 mM of the appropriate buffer, 200 μM or 100 μM Bri2-23, and 100 μM of HgCl2 in 55% sucrose. Water (150 mL) treated so as to lower the concentration of metal ions was placed in a small teflon cup sitting on a copper device, frozen in liquid nitrogen and mounted at the ISOLDE GLM beam line (at CERN) in a vacuum chamber. Radioactive 199mHg was implanted in the ice typically for 1 hour. The radioactive 199mHg was produced by irradiating a liquid lead target with 1 GeV protons and selected using an on line mass separator. Detailed information regarding sample preparation and data collection followed the protocol described in Iranzo et al.46Fits were carried out with 300 points disregarding the first 10 points due to systematic errors in these, 0.05038 ns per channel, 0.981 ns time resolution. The pH presented in the table is the pH in the sample at 274 K.
NMR spectroscopy
NMR experiments were carried out at 14.1 T at controlled temperature (±0.1 K) on a Bruker Avance 600 MHz equipped with a Silicon Graphics workstation. Suppression of the residual water signal was achieved by excitation sculpting, using a selective square pulse on water 2 ms long. Proton resonance assignment was obtained by TOCSY and NOESY experiments. HSQC experiments were carried out with standard pulse sequences. Spectral processing was performed on a Silicon Graphics O2 workstation using the XWINNMR 3.6 or TOPSPIN 3.1 software. Solutions of apo and metal (Ag(I) and Hg(II)) bound Bri2-23 0.3 mM either at acidic (~3.0) and physiological pH were analyzed. The intensities of NOESY cross-peaks, referenced to cross-peaks related to proton pairs at fixed distances were converted into proton–proton distance constraints; the constraints were used to build a pseudopotential energy for a restrained simulated annealing (SA) calculation in torsional angle space. In particular, we performed the calculation with the program DYANA,47 with 300 random starting structures of the peptide and 10![[thin space (1/6-em)]](https://www.rsc.org/images/entities/char_2009.gif) 000 steps of SA.
000 steps of SA.
Molecular dynamics simulations
The MD simulations were performed with the GROMACS 3.3.0 software package48 using the GROMOS 96 force field49 and the flexible SPC water model. The initial structure was immersed in a periodic water box of triclinic shape (1.50 nm thickness) and neutralized with a 1 CL-counterion. Electrostatic energy was calculated using the particle mesh Ewald method.50 Cutoff distances for the calculation of the Coulomb and Van der Waals interaction were 0.9 and 1.0 nm, respectively. After energy minimization using a steepest decent method, the system was subject to equilibration from 0 to 298 K and normal pressure for 30 ps. The system was coupled to the external bath by the Berendsen pressure and temperature coupling.51 No positional restrain was given, only two distance restrains for the Cys5–Cu(I) and Cys 22–Cu(I) binding (low = 1.8, up1 = 2.3, up2 = 2.5). An average structure was refined further using a steepest decent energy minimization. For simulating the Cysteine–copper(I) bond, the CYS2 residue was selected instead of the CYS residue in Gromos 43a2 force field to mimic the oxidized form, ready for metal ion binding. Moreover Arginine (+), Histidine (+) and Lysine (+) were considered in the protonated form like in acidic pH, the total charge of the peptide with Cu(I) ion was of 1+.The starting point of the MD simulation analysis was the NMR output structures obtained through the program DYANA after integrating the NMR 2D NOESY spectra to obtain structural constrains. Seven of the best 30 DYANA structures were randomly selected as the starting points for MD simulation. The Cys–Me binding site was firstly minimized with the steepest descend method to obtain the estimated distance between copper and the cysteine sulfur. The distance restrains were then applied as constrains for MD simulation analysis using the correct Force Field for this type of Me-bounded cysteines (CYS2 for gromos43a1). 100 ns of simulation was performed for each structure to reach the RMSD convergence and it was maintained for at least 20 ns. The seven analyzed structures do not quickly reach the RMSD stabilization, so during the 50 ns of simulation a steepest descend energy minimization was done every 5 ns, also because of the undefined positional restrain given to the system and because of the intrinsic unstructured part of the peptide.
Results
ThT fluorescence spectroscopy assay
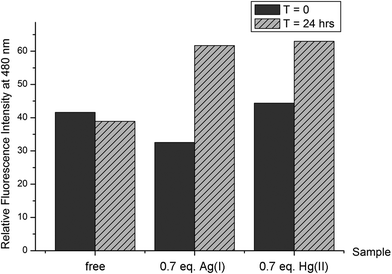
The thioflavin-T (ThT) fluorimetric assay is widely used to underline the presence of a stable β sheet secondary structure for peptides or proteins.52,53 It is also known, especially for amyloidogenic peptides, that a steady increase over time of the ThT fluorescent signal can be correlated to the formation of precipitating complexes. In order to compare the β sheet structural propensity of the peptide Bri2-23, the variation of ThT fluorescence of the Bri2-23 peptide in the presence and in the absence of Ag(I) and Hg(II) metal ions was analyzed. Immediately after the metal additions, similar values of ThT fluorescence were measured (Fig. 2). In contrast, the same experiments repeated after 24 hours showed an increase of ThT fluorescence of Bri2-23 solutions containing metal ions only. In particular, at t = 24 hours, the apo peptide gave almost the same ThT fluorescence as measured at t = 0, while the binding to Ag(I) or Hg(II) ions resulted in 30–50% of fluorescence enhancements. This behavior supports the propensity of the metal bound Bri2-23 peptide to form β sheet structure in solution, and confirms that a similar structural reorganization of the peptide is induced by Ag(I) and Hg(II).Mass spectrometry
The results of mass spectrometric analyses indicate that at slightly acidic pH conditions apo Bri2-23 (data not shown) and its mercurated complex (m/z = 943.8 and 1415.2) exist as monomers (Fig. 3). No species of higher ligand content with respect to metal have been detected, but this may be because it is difficult to detect polymeric forms of ligand or its complexes. To reduce the system’s aggregation susceptibility in the presence of metal, the mixture used in experiments contained 10% of DMSO. Interestingly, in the absence of DMSO (data not shown) no spectra was obtainable for the peptide in the presence of Hg(II), possibly indicating aggregation. The MS data can be modeled with doubly deprotonated Bri2-23 and one Hg(II) ion bound, presumably reflecting coordination by the two thiolates.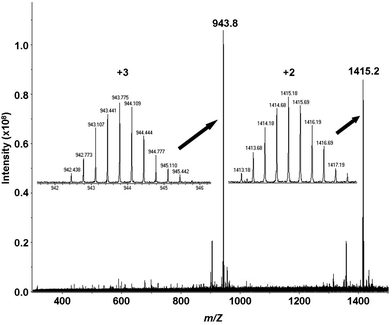 | ||
Fig. 3 ESI-MS spectra of the Hg(II) complex of the Bri2-23 peptide at pH 6.5 in carbonate buffer (1 mM). cBri2-23 = 1 × 10⁻⁴ M; Hg(II)/Bri2-23 ratio 1![[thin space (1/6-em)]](https://www.rsc.org/images/entities/char_2009.gif) : :![[thin space (1/6-em)]](https://www.rsc.org/images/entities/char_2009.gif) 1; MeOH/H2O/DMSO = 9 1; MeOH/H2O/DMSO = 9![[thin space (1/6-em)]](https://www.rsc.org/images/entities/char_2009.gif) : :![[thin space (1/6-em)]](https://www.rsc.org/images/entities/char_2009.gif) 9 9![[thin space (1/6-em)]](https://www.rsc.org/images/entities/char_2009.gif) : :![[thin space (1/6-em)]](https://www.rsc.org/images/entities/char_2009.gif) 2. 2. | ||
Circular dichroism spectroscopy
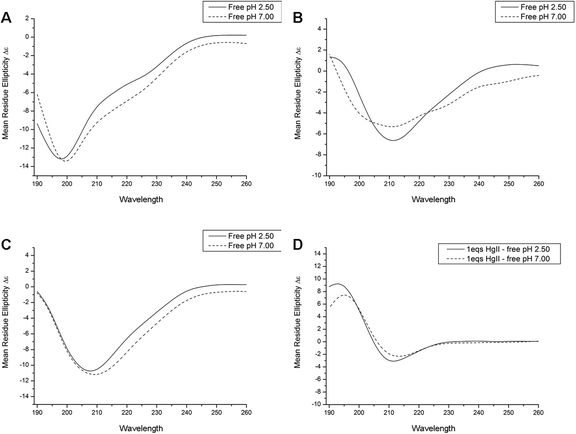
At both physiological and acidic pH apo Bri2-23 displays typical random coil CD spectra (Fig. 4A), with the main absorption at 198 nm characteristic of flexible and disordered protein.54 Upon Hg(II) and Ag(I) addition the CD spectra undergo changes in both the shape and in the wavelength of the main adsorption bands (Fig. 4B and C). The two metals gave very similar changes, showing a negative absorption at 208–210 nm. The difference spectra (Fig. 4D) obtained by subtracting the CD spectra of the apo peptide from the metal complexes have the typical shape of those of β sheet proteins, thus supporting the ThT results indicating that Bri2-23 forms a β sheet structure in the presence of both Hg(II) and Ag(I) ions. It cannot be excluded that the CD spectroscopic changes originate from LMCT bands appearing upon the binding of the metal ions to Bri2-23. However, the change towards a β sheet like spectrum upon metal ion binding is remarkable, and appears qualitatively similar for both metal ions.Potentiometric studies
Potentiometric titration reflects that in the measured pH range the unprotected EASNCFAIRHFENKFAVETLICS peptide (Bri2-23) behaves like H9L acid (Table 1). The nine protonation constants correspond to consecutive proton binding to the ε-amino group of Lys, thiolate groups of two Cys, the terminal α-amino group, imidazole nitrogen of His, γ-carboxylate of three glutamate residues and the terminal α-carboxylate group. The protonation of the guanidinyl function of the Arg residue cannot be followed.| Species | log![[thin space (1/6-em)]](https://www.rsc.org/images/entities/char_2009.gif) β β |
log![[thin space (1/6-em)]](https://www.rsc.org/images/entities/char_2009.gif) K K |
Residue |
|---|---|---|---|
| Bri2-23 | |||
| HL | 10.05(2) | 10.05 | Lys |
| H2L | 19.48(2) | 9.43 | Cys |
| H3L | 28.04(3) | 8.57 | Cys |
| H4L | 35.62(1) | 7.58 | αNH2 |
| H5L | 41.98(5) | 6.36 | His |
| H6L | 46.74(6) | 4.76 | Glu |
| H7L | 50.87(7) | 4.13 | Glu |
| H8L | 54.37(7) | 3.50 | Glu |
| H9L | 57.38(9) | 3.01 | αCOO– |
| Cysteine | |||
| HL | 10.21(1) | 10.21 | αNH2 |
| H2L | 18.45(1) | 8.24 | SH |
| H3L | 20.57(1) | 2.12 | αCOO– |
Since mercury(II) is known for its extreme high affinity to sulfhydryl-containing ligands,55,56 the reasonable explanation of the interactions between the Bri2-23 ligand and Hg(II) obligate us to emphasize that the total complexation of the metal ion with this ligand is essentially complete below pH 2. Therefore, complex formation constants could not be determined directly from potentiometric titration and competitive potentiometric experiments were carried out with cysteine as a competitor ligand under our experimental conditions.57 First, the protonation constants for cysteine were determined from potentiometric titrations followed by the determination of stability constants for its mercuric complexes where the formation constant reported by Stricks and Kolthoff for Hg(Cys)2 species was used as the fixed value.55 Constants determined for cysteine can be assigned to amine (10.21), thiolate (8.24) and carboxylate (2.12) protonations (Table 1). As in previous studies57 five complex species have been found within the measured pH range all engaging two ligands in Hg(II) sequestration (Table 2). Subsequently, potentiometric titration at a 1![[thin space (1/6-em)]](https://www.rsc.org/images/entities/char_2009.gif) :
:![[thin space (1/6-em)]](https://www.rsc.org/images/entities/char_2009.gif) 1
1![[thin space (1/6-em)]](https://www.rsc.org/images/entities/char_2009.gif) :
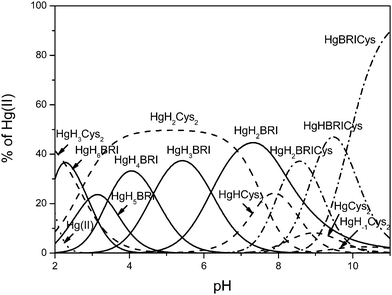
:![[thin space (1/6-em)]](https://www.rsc.org/images/entities/char_2009.gif) 1 Hg(II)/Cys/Bri2-23 ratio was carried out. Slow stabilization in the competition region resulted in relatively high standard deviations reported for the calculated complex species. The best fit results are presented in Table 2. Comprehensive analysis of potentiometric data reveals the presence of 13 complex species, five (HgH3Cys2, HgH2Cys2, HgHCys2, HgCys2, HgH−1Cys2) representing binary Hg(II) species of cysteine, five binary complexes of mercury(II) bound Bri2-23 (HgH6L, HgH5Bri, HgH4Bri, HgH3Bri, HgH2Bri) and three ternary complex species (HgH2CysL, HgHCysL, HgCysL) that coexist in the alkaline pH range (Fig. 5).
1 Hg(II)/Cys/Bri2-23 ratio was carried out. Slow stabilization in the competition region resulted in relatively high standard deviations reported for the calculated complex species. The best fit results are presented in Table 2. Comprehensive analysis of potentiometric data reveals the presence of 13 complex species, five (HgH3Cys2, HgH2Cys2, HgHCys2, HgCys2, HgH−1Cys2) representing binary Hg(II) species of cysteine, five binary complexes of mercury(II) bound Bri2-23 (HgH6L, HgH5Bri, HgH4Bri, HgH3Bri, HgH2Bri) and three ternary complex species (HgH2CysL, HgHCysL, HgCysL) that coexist in the alkaline pH range (Fig. 5).
![[thin space (1/6-em)]](https://www.rsc.org/images/entities/char_2009.gif) :
:![[thin space (1/6-em)]](https://www.rsc.org/images/entities/char_2009.gif) 1
1![[thin space (1/6-em)]](https://www.rsc.org/images/entities/char_2009.gif) :
:![[thin space (1/6-em)]](https://www.rsc.org/images/entities/char_2009.gif) 1; T = 298.2 K and I = 0.1 M in NaCl; cBri2-23 = 5 × 10⁻⁴, cCys = 5 × 10⁻⁴, cHg(II) = 5 × 10⁻⁴
1; T = 298.2 K and I = 0.1 M in NaCl; cBri2-23 = 5 × 10⁻⁴, cCys = 5 × 10⁻⁴, cHg(II) = 5 × 10⁻⁴
| Speciesa | log![[thin space (1/6-em)]](https://www.rsc.org/images/entities/char_2009.gif) β β |
log![[thin space (1/6-em)]](https://www.rsc.org/images/entities/char_2009.gif) K K |
log![[thin space (1/6-em)]](https://www.rsc.org/images/entities/char_2009.gif) K*b K*b |
|---|---|---|---|
a L indicates the Bri2-23 peptide as a ligand.
b log![[thin space (1/6-em)]](https://www.rsc.org/images/entities/char_2009.gif) K* = log K* = log![[thin space (1/6-em)]](https://www.rsc.org/images/entities/char_2009.gif) β(CuHjL) − log β(CuHjL) − log![[thin space (1/6-em)]](https://www.rsc.org/images/entities/char_2009.gif) β(HnL) (where the index j corresponds to the number of the protons in the coordinated ligand to the metal ion and n corresponds to the number of protons coordinated to the ligand).
c Data adapted from Stricks and Kolthoff.55 β(HnL) (where the index j corresponds to the number of the protons in the coordinated ligand to the metal ion and n corresponds to the number of protons coordinated to the ligand).
c Data adapted from Stricks and Kolthoff.55
|
|||
| HgH3Cys2 | 62.51(1) | ||
| HgH2Cys2 | 60.04(1) | 2.47 | |
| HgH1Cys2 | 52.44(1) | 7.60 | |
| HgH0Cys2 | 43.57c | 8.87 | |
| HgH-1Cys2 | 33.51(1) | 10.06 | |
| HgH6L | 54.86(12) | 0.49 | |
| HgH5L | 51.97(11) | 2.89 | 1.10 |
| HgH4L | 48.55(12) | 3.42 | 1.81 |
| HgH3L | 43.91(11) | 4.64 | 1.94 |
| HgH2L | 37.72(12) | 6.19 | 2.10 |
| HgH2CysL | 52.85(6) | ||
| HgHCysL | 43.92(6) | 8.93 | |
| HgCysL | 34.10(6) | 9.82 | |
Although Bri2-23 is a moderately weak competitor of cysteine, we are able to determine the stability of its mercuric complexes in the ternary system. Usually, the most reliable measure that allows for direct assessment of affinity of various ligands toward metal ions is log![[thin space (1/6-em)]](https://www.rsc.org/images/entities/char_2009.gif) K*, the protonation corrected stability constant.58 Taking into account the relatively high standard deviation we are able to quantify the log
K*, the protonation corrected stability constant.58 Taking into account the relatively high standard deviation we are able to quantify the log![[thin space (1/6-em)]](https://www.rsc.org/images/entities/char_2009.gif) K* for Bri2–23 Hg(II) complexes to vary between 0.5 and 2. This discrepancy is the consequence of structural rearrangements of the peptide chain that mutually result from metal binding and changes in proton concentration. Extensions of the peptide sequence with a structure-rearranging domain usually increase the stability of its metal complexes.59,60 The analogous estimate of log
K* for Bri2–23 Hg(II) complexes to vary between 0.5 and 2. This discrepancy is the consequence of structural rearrangements of the peptide chain that mutually result from metal binding and changes in proton concentration. Extensions of the peptide sequence with a structure-rearranging domain usually increase the stability of its metal complexes.59,60 The analogous estimate of log![[thin space (1/6-em)]](https://www.rsc.org/images/entities/char_2009.gif) K* for cysteine complexes of the general formula HgHxCys2 gives a value exceeding 23. In consequence Bri2-23 could hardly compete with cysteine for Hg(II) binding. Furthermore, if this measure is the critical factor, such a high difference in stability would abolish formation of ternary complexes that have been determined by potentiometric titrations. Against all odds, mass spectrometric analysis confirms the occurrence of ternary complexes in the alkaline pH range (see Fig. 1S and 2S for details, ESI†).
K* for cysteine complexes of the general formula HgHxCys2 gives a value exceeding 23. In consequence Bri2-23 could hardly compete with cysteine for Hg(II) binding. Furthermore, if this measure is the critical factor, such a high difference in stability would abolish formation of ternary complexes that have been determined by potentiometric titrations. Against all odds, mass spectrometric analysis confirms the occurrence of ternary complexes in the alkaline pH range (see Fig. 1S and 2S for details, ESI†).
The experiments performed in the ternary system have been followed by corresponding titrations carried out for the binary system with the aim of testing the system’s behavior in the absence of any competing ligand. As we know from competition experiments, Bri2-23 is hardly able to compete with cysteine for metal binding in a wide pH range. To reproduce the constraints of the ternary system and to keep the homogeneity of the complex species formed in solution (vide supra) metal pool accessible for Bri2-23 sequestration was kept at a half the concentration of the ligand. Moreover, the formation constant calculated for the HgH2BRI complex was used as the predetermined value. The best fit results are shown in Table 3. Analysis of potentiometric data reveal the formation of seven complex species HgH6L, HgH5L, HgH4L, HgH3L, HgH2L, HgHL and HgL (Fig. 6). Stability constants for corresponding complex species formed in acidic and neutral pH range correlate well with values calculated for the ternary system (Table 2), while formation constants for species HgHL and HgL, present in the alkaline pH range give reasonable log![[thin space (1/6-em)]](https://www.rsc.org/images/entities/char_2009.gif) K* values. In addition, available potentiometric, mass spectrometric and NMR data do not indicate formation of complex species with two ligand molecules binding Hg(II) (Fig. 6).
K* values. In addition, available potentiometric, mass spectrometric and NMR data do not indicate formation of complex species with two ligand molecules binding Hg(II) (Fig. 6).
![[thin space (1/6-em)]](https://www.rsc.org/images/entities/char_2009.gif) :
:![[thin space (1/6-em)]](https://www.rsc.org/images/entities/char_2009.gif) 2; T = 298.2 K and I = 0.1 M in NaCl; cBri2-23 = 1 × 10⁻³, cHg(II) = 5 × 10⁻⁴
2; T = 298.2 K and I = 0.1 M in NaCl; cBri2-23 = 1 × 10⁻³, cHg(II) = 5 × 10⁻⁴
| Speciesa | log![[thin space (1/6-em)]](https://www.rsc.org/images/entities/char_2009.gif) β β |
log![[thin space (1/6-em)]](https://www.rsc.org/images/entities/char_2009.gif) K K |
log![[thin space (1/6-em)]](https://www.rsc.org/images/entities/char_2009.gif) K*b K*b |
|---|---|---|---|
a L indicates the Bri2-23 peptide as a ligand.
b log![[thin space (1/6-em)]](https://www.rsc.org/images/entities/char_2009.gif) K* = log K* = log![[thin space (1/6-em)]](https://www.rsc.org/images/entities/char_2009.gif) β(CuHjL) − log β(CuHjL) − log![[thin space (1/6-em)]](https://www.rsc.org/images/entities/char_2009.gif) β(HnL) (where the index j corresponds to the number of the protons in the coordinated ligand to the metal ion and n corresponds to the number of protons coordinated to the ligand).
c Calculated in the ternary system. β(HnL) (where the index j corresponds to the number of the protons in the coordinated ligand to the metal ion and n corresponds to the number of protons coordinated to the ligand).
c Calculated in the ternary system.
|
|||
| HgH6L | 55.10(2) | 0.73 | |
| HgH5L | 52.09(1) | 3.01 | 1.22 |
| HgH4L | 48.65(1) | 3.44 | 1.91 |
| HgH3L | 44.01(1) | 4.64 | 2.03 |
| HgH2L | 37.72c | 6.29 | 2.10 |
| HgHL | 29.54(1) | 8.18 | 1.49 |
| HgL | 18.59(2) | 10.95 | 0.59 |
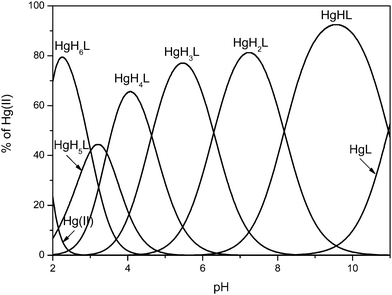 | ||
Fig. 6 Species distribution diagram for Hg(II) complexes of the Bri2-23 peptide at a 1![[thin space (1/6-em)]](https://www.rsc.org/images/entities/char_2009.gif) : :![[thin space (1/6-em)]](https://www.rsc.org/images/entities/char_2009.gif) 2 Hg/Bri2-23 ratio; T = 298.2 K and I = 0.1 M in NaCl; cBri2-23 = 1 × 10⁻³, cHg(II) = 5 × 10⁻⁴. 2 Hg/Bri2-23 ratio; T = 298.2 K and I = 0.1 M in NaCl; cBri2-23 = 1 × 10⁻³, cHg(II) = 5 × 10⁻⁴. | ||
Isothermal titration calorimetry
As we know from potentiometric experiments the total complexation of the metal ion with Bri2-23 is essentially complete below pH 2 and subsequent complex species differ only in the protonation state of groups not involved in Hg(II) binding. Therefore, comprehensive thermodynamic analysis of the interaction of Bri2-23 with Hg(II) by the isothermal titration calorimetry experiments have been performed in the acidic pH range (see ESI† for details).Perturbed angular correlation spectroscopy (PAC)
199mHg PAC spectroscopy was conducted in order to elucidate the metal site coordination geometry. The PAC parameters derived from analysis of the experimental data, Fig. 4S and 7, are summarized in Table 1S (ESI†). With a peptide![[thin space (1/6-em)]](https://www.rsc.org/images/entities/char_2009.gif) :
:![[thin space (1/6-em)]](https://www.rsc.org/images/entities/char_2009.gif) Hg(II) stoichiometry of 2
Hg(II) stoichiometry of 2![[thin space (1/6-em)]](https://www.rsc.org/images/entities/char_2009.gif) :
:![[thin space (1/6-em)]](https://www.rsc.org/images/entities/char_2009.gif) 1 at pH 3.0 one nuclear quadrupole interaction (NQI) dominates the spectra. This NQI compares well with previous observations of HgS2 coordination geometries.46 The same NQI is dominating at peptide
1 at pH 3.0 one nuclear quadrupole interaction (NQI) dominates the spectra. This NQI compares well with previous observations of HgS2 coordination geometries.46 The same NQI is dominating at peptide![[thin space (1/6-em)]](https://www.rsc.org/images/entities/char_2009.gif) :
:![[thin space (1/6-em)]](https://www.rsc.org/images/entities/char_2009.gif) Hg(II) stoichiometry of 1
Hg(II) stoichiometry of 1![[thin space (1/6-em)]](https://www.rsc.org/images/entities/char_2009.gif) :
:![[thin space (1/6-em)]](https://www.rsc.org/images/entities/char_2009.gif) 1 at pH 3.0. At pH 7.4 the signal is still dominated by that of the HgS2 coordination geometry, but it changes slightly, with line broadening especially of the second peak at ∼2.7 rad ns−1, and a minor decrease in frequency. The line broadening implies either internal dynamics at the metal site or that more than one NQI, and thus more than one coordination geometry, is present. Thus, a second NQI was introduced in the data analysis, see Table 1S (ESI†), and the fitted parameters fall in-between reference data for HgS2 and HgS3 model systems, and might indicate that a fraction of the Hg(II) ions are in coordination geometries with a coordination number higher than 2.46 The analysis is difficult, and other fits of equal quality may exist.
1 at pH 3.0. At pH 7.4 the signal is still dominated by that of the HgS2 coordination geometry, but it changes slightly, with line broadening especially of the second peak at ∼2.7 rad ns−1, and a minor decrease in frequency. The line broadening implies either internal dynamics at the metal site or that more than one NQI, and thus more than one coordination geometry, is present. Thus, a second NQI was introduced in the data analysis, see Table 1S (ESI†), and the fitted parameters fall in-between reference data for HgS2 and HgS3 model systems, and might indicate that a fraction of the Hg(II) ions are in coordination geometries with a coordination number higher than 2.46 The analysis is difficult, and other fits of equal quality may exist.
Nuclear magnetic resonance spectroscopy
In order to characterize the metal coordination sphere of Bri2-23 and to better understand the conformational rearrangements of the peptide, the NMR behavior of both apo and metal bound forms was analyzed. Addition of Ag(I) or Hg(II) ions yielded very similar NMR spectra (Fig. 5S, ESI†), suggesting similar coordination features for both metals. However, the spectra of the silver complex were broader than the mercury ones, such that successive analyses were carried out on Hg(II) systems only.Hg(II) titration experiments were performed to determine the metal binding stoichiometry, up to 1.8. Hg(II) equivalents were added to Bri2-23 solutions. Hg(II) additions up to 0.9 equivalents resulted in the change of NMR parameters of selected proton and carbon NMR resonances, on the contrary higher metal concentrations did not significantly further affect the spectra, except for increased line broadening of NMR signals, probably due to the presence of intermolecular species or soluble aggregates. The addition of 0.5 Hg(II) equivalents causes the reduction of NMR resonances belonging to the apo form with the simultaneous appearance of new peaks corresponding to the metal-bound form (Fig. 8A), indicating the occurrence of a slow exchange regime (respect to the NMR time scale) between the free and bound states. The presence of both apo and metal bound signals observed in that condition strongly indicate that 1![[thin space (1/6-em)]](https://www.rsc.org/images/entities/char_2009.gif) :
:![[thin space (1/6-em)]](https://www.rsc.org/images/entities/char_2009.gif) 1 complexes, rather than bis-complexes, are formed. Further addition of Hg(II) results in (i) the complete disappearance of the NMR resonances of the apo Bri2-23 and (ii) an increase of the intensity of the peaks corresponding to the metal complex (Fig. 8B). Furthermore, the correlations observed upon the addition of 0.5 metal equivalents are well superimposed to those corresponding to either the free or metal bound Bri2-23 (Fig. 6S, ESI†). In addition, the NMR spectra revealed the occurrence of two Hg(II) bound forms in slow exchange with respect to the NMR time scale. The two forms (hereafter called form X and Y) exhibited clear and diverse NMR signals for residues 9–21, while showed similar chemical shifts for the first 8 residues. From the evaluation of the relative intensities of the NMR signals belonging to the two bound forms, the form X was found to be more abundant than the other. The full 1H assignments of Bri2-23 and the two Hg(II) bound forms (X and Y) are reported in Tables 2S–4S (ESI†).
1 complexes, rather than bis-complexes, are formed. Further addition of Hg(II) results in (i) the complete disappearance of the NMR resonances of the apo Bri2-23 and (ii) an increase of the intensity of the peaks corresponding to the metal complex (Fig. 8B). Furthermore, the correlations observed upon the addition of 0.5 metal equivalents are well superimposed to those corresponding to either the free or metal bound Bri2-23 (Fig. 6S, ESI†). In addition, the NMR spectra revealed the occurrence of two Hg(II) bound forms in slow exchange with respect to the NMR time scale. The two forms (hereafter called form X and Y) exhibited clear and diverse NMR signals for residues 9–21, while showed similar chemical shifts for the first 8 residues. From the evaluation of the relative intensities of the NMR signals belonging to the two bound forms, the form X was found to be more abundant than the other. The full 1H assignments of Bri2-23 and the two Hg(II) bound forms (X and Y) are reported in Tables 2S–4S (ESI†).
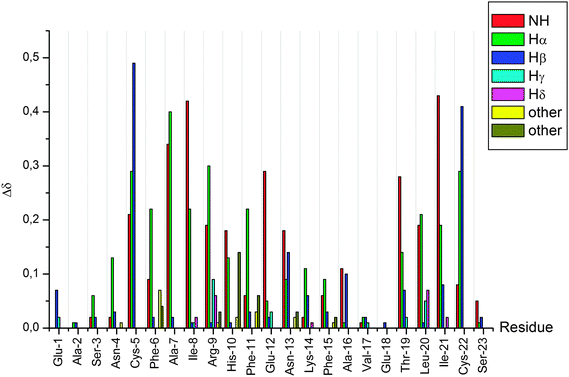
After the complete assignment of the NMR spectra of the apo and Hg(II) bound Bri2-23 forms, the Chemical Shift Index (CSI) and the Chemical Shift Variation induced by the metal ion for the most abundant species (form X) was calculated. The CSI, calculated on the chemical shift of the Hα protons, is reported in Fig. 9. The results obtained for the apo peptide confirm the random coil nature of Bri2-23, as previously detected from CD analysis. On the other hand the CSI obtained for the metal bound form demonstrates a behavior typical of a β strand structured peptide, especially for the regions from Asn-4 to Arg-9 and from Val-17 to Cys-22. Similar results were obtained by the analysis of the chemical shift variation induced by Hg(II) on NH and Hα protons (Fig. 10). Both metal bound forms show large chemical shift variations, especially in the regions from 4 to 8 and from 16 to 22. In order to better determine the metal binding donor atoms, the Hg(II) induced chemical shift variations on all of side-chain protons were calculated as well (Fig. 10). The protons exhibiting the largest changes belong to Hβ of both Cys-5 and Cys-22, strongly supporting the metal coordination to thiolate groups.
The analysis of 2D 1H–1H NOESY spectra was also performed in order to determine the three dimensional structure of the Bri2-23–Hg(II) complex. 70 NOEs were thus converted to proton–proton distance constraints to be used for structure calculation by using the DYANA program. However no clear cut arrangement of the peptide was obtained from those calculations (bb-RMSD: 4.38 ± 0.94 Å, and an average target function of 1.08 ± 0.023).
Molecular dynamics simulations
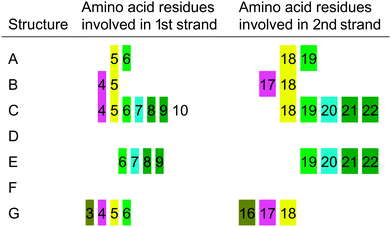
The structural propensity of the Bri2-23–Hg(II) complex was investigated by Molecular Dynamics Simulations (MD) performed on seven random structures selected from the thirty ones generated from DYANA calculation (Fig. 7S, ESI†). Combination of experimental and theoretical techniques has been previously applied to investigate metal binding to amyloidogenic model peptides.61–64 For each of the seven structures shown, a 100 ns of MD simulation was performed using the simulation program GROMACS.31 Contrary to the NMR analysis, we decided to run MD by considering Cu(I) instead of Hg(II) or Ag(I) as the metal bound ion. This choice was mainly due to the fact that Cu(I) is the real metal of interest and that Hg(II) and Ag(I) were just used as probes for Cu(I) in the spectroscopic analysis. Among the seven analyzed structures only five easily reached bb-RMSD convergence after 100 ns (Fig. 11, structures A, B, C, D and G). The stability of each simulated systems was controlled also through the output pdb files, where backbone overlap occurred in the last 20 ns confirming the secondary structure stability (Fig. 11). For structures E and F, after 100 ns of simulation, bb-RMSD did not converge. This can happen when (i) the system attains a random coil secondary structure, so the bb will not be stable at all, or (ii) the major part of the bb remain stable over time while the C- and N-terminus (which could be the random part of the sequence) have a high mobility. To monitor this behavior the fluctuation of single residues over time was calculated for structures E and F. As shown in Fig. 8S (ESI†), we found that the N- and C-termini are much more unstable than the central part of the sequence (especially for structure F). For these reasons we decided to include in our analysis also the results obtained from structures F and E.Ribbon representations are shown in Fig. 11. Structures A, B, C, E and G present a well defined conformation, composed by a short N- and C-termini random part, followed by a short β-sheet (parallel or anti-parallel) and a central domain constituted by turn and bend elements. In contrast, structures D and F do not possess an intrinsic β-sheet frame, and they just show the features of a simple but well organized conformation characterized by a bend, turn and β-bridge secondary structure.
From a statistical point of view, 5 of the 7 analyzed structures show a well defined β sheet arrangement, demonstrating the high propensity of the Cu(I) bound peptide to adopt a partial β sheet secondary structure, confirming the analysis of the CD, ThT and NMR experimental data (Sections 1–3). The obtained data support the existence of a β sheet region located in the proximity of the metal binding site (Cys-5 and Cys-22). The amino acids involved in the β sheet formation are not unequivocally determined (see Table 4) suggesting the dynamic nature of the system. Interestingly, the distance between the two sheets is constant, despite the structured part starts at Ser-3 or at Phe-6.
Discussion
Knowledge of metal binding properties of Bri2 and the products of its proteolytic cleavage is limited to one report related to metallochemistry of ABri, the amyloidogenic product of the furin cleaved homologue of Bri2.20 There are no similar studies for the wild type peptide (Bri2-23) that, contrary to its pathogenic homologue, does not aggregate and even effectively inhibits Aβ aggregation.Our major interest was to examine the interaction of Bri2-23 with soft metal ions, by using Hg(II) and Ag(I) as Cu(I) probes, to assess the impact of metal sequestration on peptide structure and metal binding affinity under conditions where aggregation is disfavored. Hg(II) is known for very high affinity for thiolate containing ligands. Hg(II) binding to low molecular weight compounds like cysteine, penicillamine, and glutathione typically yields extremely stable complex species. On the other hand, the selectivity of metal ion binding to peptides containing two or more cysteinyl residues is strongly dependent on the distance between the thiolates involved in metal ion sequestration,65 over and above their conformational orientation.57,66 Design of peptides that predispose binding thiolates into metal preferred orientation yielded exceptionally stable complex species able to compete with low molecular weight compounds in Hg(II) sequestration.57
As demonstrated by the CD and NMR analyses apo Bri2 23 preferentially adopts random conformation, which do not favor the intramolecular mercury(II) binding to Cys-5 and Cys-22, separated by 16 amino acid residues. Nonetheless, Bri2-23 has the ability to form Hg(II) mononuclear intramolecular species with a HgS2 coordination geometry, as indicated by the analysis of ESI MS data (Fig. 3). The isotopic profile of the detectable species perfectly matches the simulated mononuclear intramolecular HgBri2-23 complex. Furthermore, although PAC spectroscopy does not discriminate between the intra- or inter-molecular metal site, it confirms the occurrence of HgS2 coordination geometry in solution at low pH (Fig. 7). Similarly, the large chemical shift changes observed for Cys-5, Cys-22 and residues nearby, indicates that these residues are coordinated to Hg(II) in the predominant metal complex (Fig. 10). Interestingly, nearly exclusive intramolecular binding is observed at metal ion concentrations not exceeding 0.5 molar equivalents with respect to the peptide, as reflected by the NMR and potentiometric analysis (Fig. 6 and 8). NMR analysis also revealed the presence of two metal-bound species with form (X) still predominant in the equilibrium. Relatively low concentration of minor species (Y) does not allow for its comprehensive structural analysis.
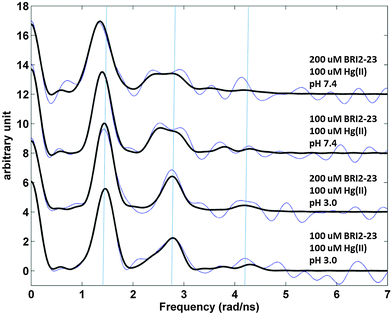 | ||
Fig. 7 Fourier transformed 199mHg PAC data for Bri2-23 in 50 mM phosphate buffer, pH 3.0 or 7.4 with the addition of sucrose (55%); cHg(II) = 1 × 10⁻⁴ M, Hg(II)/Bri2-23 ratio 1![[thin space (1/6-em)]](https://www.rsc.org/images/entities/char_2009.gif) : :![[thin space (1/6-em)]](https://www.rsc.org/images/entities/char_2009.gif) 1 or 1 1 or 1![[thin space (1/6-em)]](https://www.rsc.org/images/entities/char_2009.gif) : :![[thin space (1/6-em)]](https://www.rsc.org/images/entities/char_2009.gif) 2. Blue: fourier transformed experimental data; black: fit with the parameters presented in Table 1S (ESI†). Vertical blue lines are added to aid the eye, at the frequencies recorded at pH 3.0 with 2 2. Blue: fourier transformed experimental data; black: fit with the parameters presented in Table 1S (ESI†). Vertical blue lines are added to aid the eye, at the frequencies recorded at pH 3.0 with 2![[thin space (1/6-em)]](https://www.rsc.org/images/entities/char_2009.gif) : :![[thin space (1/6-em)]](https://www.rsc.org/images/entities/char_2009.gif) 1 Bri2-23 to Hg(II) stoichiometry, reflecting a typical HgS2 coordination geometry. 1 Bri2-23 to Hg(II) stoichiometry, reflecting a typical HgS2 coordination geometry. | ||
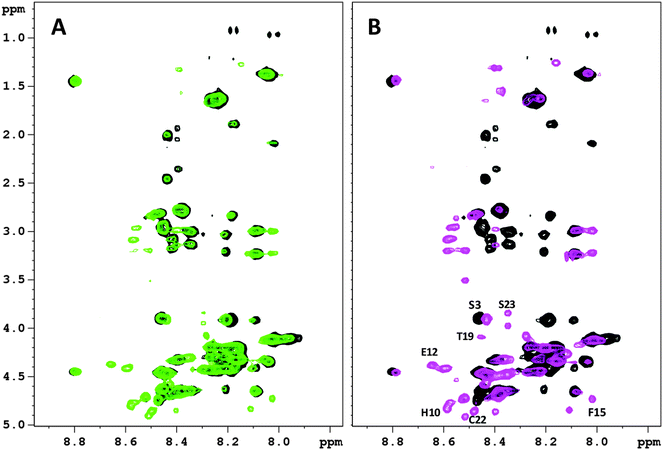 | ||
Fig. 8 2D 1H–1H TOCSY spectra (NH-Hα region) of Bri2-23 0.5 mM in H2O![[thin space (1/6-em)]](https://www.rsc.org/images/entities/char_2009.gif) : :![[thin space (1/6-em)]](https://www.rsc.org/images/entities/char_2009.gif) D2O 90 D2O 90![[thin space (1/6-em)]](https://www.rsc.org/images/entities/char_2009.gif) : :![[thin space (1/6-em)]](https://www.rsc.org/images/entities/char_2009.gif) 10 at 298 10 at 298![[thin space (1/6-em)]](https://www.rsc.org/images/entities/char_2009.gif) K and pH 3.0 in the presence of (A) 0.5 equivalents of Hg(II) ions; (B) 0.7 equivalents of Hg(II) ions. K and pH 3.0 in the presence of (A) 0.5 equivalents of Hg(II) ions; (B) 0.7 equivalents of Hg(II) ions. | ||
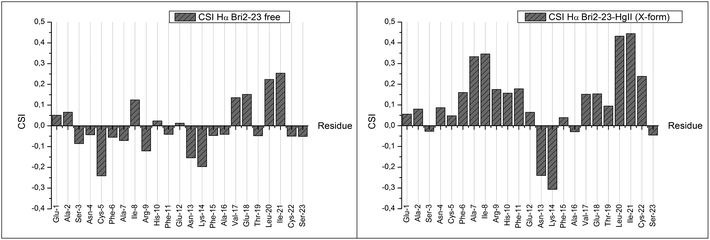 | ||
| Fig. 9 Chemical Shift Index of Bri2-23 apo form (left panel) and of the most abundant Hg(II)–Bri2-23 complex X (right panel). | ||
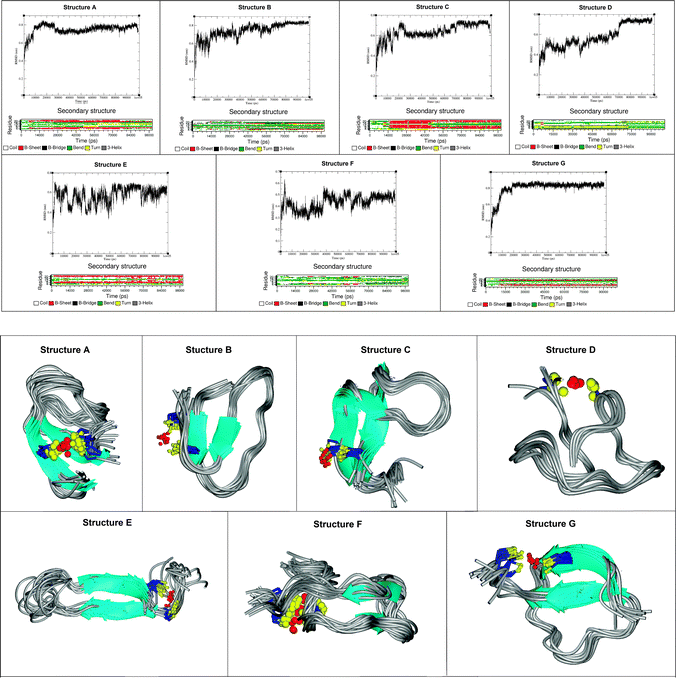 | ||
| Fig. 11 Backbone RMSD, secondary structure evolutions as a function of time (upper panel) and the snapshots from the last part of the MD trajectories of Hg(II)-Bri2-23 molecules (lower panel). | ||
As indicated by the large broadening of NMR signals and by the ITC experiments, further increase of M![[thin space (1/6-em)]](https://www.rsc.org/images/entities/char_2009.gif) :
:![[thin space (1/6-em)]](https://www.rsc.org/images/entities/char_2009.gif) L ratios results in the evolution of metal-bridged oligomeric species (e.g. Hgm(BRI2 23)n) that may coexist in solution with HgBri2-23 macrochelates. This behavior epitomizes previously detected pH dependent scrambling of ABri.67
L ratios results in the evolution of metal-bridged oligomeric species (e.g. Hgm(BRI2 23)n) that may coexist in solution with HgBri2-23 macrochelates. This behavior epitomizes previously detected pH dependent scrambling of ABri.67
Our titration experiments indicate that Hg(II) interact with Bri2-23 in a concentration dependent manner, yielding primarily a mixture of intramolecular macrochelate and structurally undefined species that with metal concentration exceeding 0.7 Hg(II) equivalents are converted into polymeric species of unknown structure and stoichiometry. Aggregates giving response in ThT assays are formed, indicating that the presence of 0.7 Hg(II) or Ag(I) equivalents does lead to aggregation (Fig. 2).
The three dimensional structure of the mononuclear Bri2-23 complex was unapproachable directly from NMR data analysis. However, NMR provided reliable constraints to molecular dynamics analysis. Nearly all MD trajectories present a predominantly β sheet arrangement of peptide structure upon metal binding in contrast to a completely random structure of the free peptide (Fig. 11). As indicated in Table 4, the residues involved in the β-sheet structure are not well defined. This behavior is consistent with a relative flexibility of the β-sheet rearrangement and it is in agreement with the lack of precise NOE constraints unequivocally leading to the NMR structure of the metal complex. However, as supported by the chemical shift analysis (Fig. 9) and by the MD data (Fig. 11), metal ion binding has a critical impact on molecular architecture of the peptide and enforces its refolding to yield species of predominant β pleated sheet conformation, hence more prone to aggregation. Although these species are not exactly the same in terms of proposed molecular architecture of the peptide backbone, most of them resemble either parallel or antiparallel β-sheet rich structures. The suggested conformational shift is additionally supported by changes in the far-UV profile of CD spectra demonstrating transition towards β-sheet arrangement of the peptide backbone (Fig. 4).
Formation of oligomeric species observed at a higher metal concentration may either proceed through subsequent Hg(II) and peptide incorporation that yields an expanded metal bridged precipitate or alternatively represents the required core for Bri2-23 aggregation. The time dependence and molecular mechanism of aggregation remains to be elucidated. As a consequence, metal ion sequestration may eradicate a key attribute of Bri2-23, its Aβ aggregation inhibitory activity and/or even convert the peptide into an aggregation promoter.
Acknowledgements
We would like to thank National Science Center (NCN 2011/01/B/ST5/03936), PRIN (Programmi di Ricerca di Rilevante Interesse Nazionale) (2010M2JARJ_004), CIRMMP (Consorzio Interuniversitario Risonanze Magnetiche di Metalloproteine Paramagnetiche) and CIRCMSB (Consorzio Interuniversitario di Ricerca in Chimica dei Metalli nei Sistemi Biologici) for financial support. LH thanks ISOLDE/CERN for beam time grant IS488, and for ENSAR support.References
- J. Ghiso, A. Rostagno, Y. Tomidokoro, T. Lashley, M. Bojsen-Moller, H. Braendgaard, G. Plant, J. Holton, R. Lal, T. Revesz and B. Frangione, Brain Pathol., 2006, 16, 71–79 CrossRef CAS PubMed.
- R. Vidal, B. Frangione, A. Rostagno, S. Mead, T. Revesz, G. Plant and J. Ghiso, Nature, 1999, 399, 776–781 CrossRef CAS PubMed.
- R. Vidal, T. Revesz, A. Rostagno, E. Kim, J. L. Holton, T. Bek, M. Bojsen-Moller, H. Braendgaard, G. Plant, J. Ghiso and B. Frangione, Proc. Natl. Acad. Sci. U. S. A., 2000, 97, 4920–4925 CrossRef CAS PubMed.
- D. P. Jones, J. Intern. Med., 2010, 268, 432–448 CrossRef CAS PubMed.
- D. P. Jones and Y. M. Go, Diabetes, Obes. Metab., 2010, 12, 116–125 CrossRef CAS PubMed.
- T. E. Golde, J. Clin. Invest., 2003, 111, 11–18 CrossRef CAS.
- S. H. Kim, R. Wang, D. J. Gordon, J. Bass, D. F. Steiner, D. G. Lynn, G. Thinakaran, S. C. Meredith and S. S. Sisodia, Nat. Neurosci., 1999, 2, 984–988 CrossRef CAS PubMed.
- S. I. Choi, R. Vidal, B. Frangione and E. Levy, FASEB J., 2003, 17, 373–375 CrossRef PubMed.
- M. Tsachaki, J. Ghiso, A. Rostagno and S. Efthimiopoulos, Neurobiol. Aging, 2010, 31, 88–98 CrossRef CAS PubMed.
- G. Gibson, N. Gunasekera, M. Lee, V. Lelyveld, O. M. A. El-Agnaf, A. Wright and B. Austen, J. Neurochem., 2004, 88, 281–290 CrossRef CAS.
- O. M. A. El-Agnaf, J. M. Sheridan, C. Sidera, G. Siligardi, R. Hussain, P. I. Haris and B. M. Austen, Biochemistry, 2001, 40, 3449–3457 CrossRef CAS PubMed.
- O. M. A. El-Agnaf, S. Nagala, B. P. Patel and B. M. Austen, J. Mol. Biol., 2001, 310, 157–168 CrossRef CAS PubMed.
- J. Kim, V. M. Miller, Y. Levites, K. J. West, C. W. Zwizinski, B. D. Moore, F. J. Troendle, M. Bann, C. Verbeeck, R. W. Price, L. Smithson, L. Sonoda, K. Wagg, V. Rangachari, F. Zou, S. G. Younkin, N. Graff-Radford, D. Dickson, T. Rosenberry and T. E. Golde, J. Neurosci., 2008, 28, 6030–6036 CrossRef CAS PubMed.
- T. Sato, P. Kienlen-Campard, M. Ahmed, W. Liu, H. L. Li, J. I. Elliott, S. Aimoto, S. N. Constantinescu, J. N. Octave and S. O. Smith, Biochemistry, 2006, 45, 5503–5516 CrossRef CAS PubMed.
- W. Liu, E. Crocker, W. Y. Zhang, J. I. Elliott, B. Luy, H. L. Li, S. Aimoto and S. O. Smith, Biochemistry, 2005, 44, 3591–3597 CrossRef CAS PubMed.
- S. Matsuda, Y. Matsuda, E. L. Snapp and L. D'Adamio, Neurobiol. Aging, 2011, 32, 1400–1408 CrossRef CAS PubMed.
- A. Binolfi, L. Quintanar, C. W. Bertoncini, C. Griesinger and C. O. Fernandez, Coord. Chem. Rev., 2012, 256, 2188–2201 CrossRef CAS PubMed.
- C. Hureau, Coord. Chem. Rev., 2012, 256, 2164–2174 CrossRef CAS PubMed.
- C. Hureau and P. Dorlet, Coord. Chem. Rev., 2012, 256, 2175–2187 CrossRef CAS PubMed.
- A. Khan, A. E. Ashcroft, O. V. Korchazhkina and C. Exley, J. Inorg. Biochem., 2004, 98, 2006–2010 CrossRef CAS PubMed.
- C. Migliorini, E. Porciatti, M. Luczkowski and D. Valensin, Coord. Chem. Rev., 2012, 256, 352–368 CrossRef CAS PubMed.
- Y. Miller, B. Y. Ma and R. Nussinov, Coord. Chem. Rev., 2012, 256, 2245–2252 CrossRef CAS PubMed.
- S. Morante, Curr. Alzheimer Res., 2008, 5, 508–524 CrossRef CAS.
- K. I. Silva and S. Saxena, J. Phys. Chem. B, 2013, 117, 9386–9394 CrossRef CAS PubMed.
- F. Stellato, A. Spevacek, O. Proux, V. Minicozzi, G. Millhauser and S. Morante, Eur. Biophys. J., 2011, 40, 1259–1270 CrossRef CAS PubMed.
- J. H. Viles, Coord. Chem. Rev., 2012, 256, 2271–2284 CrossRef CAS PubMed.
- I. Zawisza, M. Rozga and W. Bal, Coord. Chem. Rev., 2012, 256, 2297–2307 CrossRef CAS PubMed.
- F. M. Zhou and G. L. Millhauser, Coord. Chem. Rev., 2012, 256, 2285–2296 CrossRef CAS PubMed.
- R. De Ricco, S. Potocki, H. Kozlowski and D. Valensin, Coord. Chem. Rev., 2014, 269, 1–12 CrossRef CAS PubMed.
- A. Bharti, P. Bharati, M. K. Bharty, R. K. Dani, S. Singh and N. K. Singh, Polyhedron, 2013, 54, 131–139 CrossRef CAS PubMed.
- F. Camponeschi, D. Valensin, I. Tessari, L. Bubacco, S. Dell'Acqua, L. Casella, E. Monzani, E. Gaggelli and G. Valensin, Inorg. Chem., 2013, 52, 1358–1367 CrossRef CAS PubMed.
- R. De Ricco, S. Potocki, H. Kozlowski and D. Valensin, Coord. Chem. Rev., 2014, 269, 1–12 CrossRef CAS PubMed.
- P. Faller, C. Hureau, P. Dorlet, P. Hellwig, Y. Coppel, F. Collin and B. Alies, Coord. Chem. Rev., 2012, 256, 2381–2396 CrossRef CAS PubMed.
- J. F. Jiang, I. A. Nadas, M. A. Kim and K. J. Franz, Inorg. Chem., 2005, 44, 9787–9794 CrossRef CAS PubMed.
- M. A. Kihlken, C. Singleton and N. E. Le Brun, JBIC, J. Biol. Inorg. Chem., 2008, 13, 1011–1023 CrossRef CAS PubMed.
- B. O. Leung, F. Jalilehvand, V. Mah, M. Parvez and Q. Wu, Inorg. Chem., 2013, 52, 4593–4602 CrossRef CAS PubMed.
- M. Luczkowski, B. A. Zeider, A. V. H. Hinz, M. Stachura, S. Chakraborty, L. Hemmingsen, D. L. Huffman and V. L. Pecoraro, Chem. – Eur. J., 2013, 19, 9042–9049 CrossRef CAS PubMed.
- O. Seneque, S. Crouzy, D. Boturyn, P. Dumy, M. Ferrand and P. Delangle, Chem. Commun., 2004, 770–771 RSC.
- L. M. Utschig, T. Baynard, C. Strong and T. V. OHalloran, Inorg. Chem., 1997, 36, 2926–2927 CrossRef CAS.
- L. M. Utschig, J. G. Wright, G. Dieckmann, V. Pecoraro and T. V. Ohalloran, Inorg. Chem., 1995, 34, 2497–2498 CrossRef CAS.
- G. C. Vanstein, G. Vankoten, K. Vrieze, C. Brevard and A. L. Spek, J. Am. Chem. Soc., 1984, 106, 4486–4492 CrossRef CAS.
- W. C. Chan and P. D. White, Fmoc solid phase peptide synthesis: a practical approach, Oxford University Press, New York, 2000, p. xxiv, 346 Search PubMed.
- H. M. Irving, M. G. Miles and L. D. Pettit, Anal. Chim. Acta, 1967, 38, 475–488 CrossRef CAS.
- P. Gans, A. Sabatini and A. Vacca, Talanta, 1996, 43, 1739–1753 CrossRef CAS.
- G. L. Ellman, Arch. Biochem. Biophys., 1959, 82, 70–77 CrossRef CAS.
- O. Iranzo, P. W. Thulstrup, S. B. Ryu, L. Hemmingsen and V. L. Pecoraro, Chem. – Eur. J., 2007, 13, 9178–9190 CrossRef CAS PubMed.
- P. Guntert, C. Mumenthaler and K. Wuthrich, J. Mol. Biol., 1997, 273, 283–298 CrossRef CAS PubMed.
- D. Van der Spoel, E. Lindahl, B. Hess, G. Groenhof, A. E. Mark and H. J. C. Berendsen, J. Comput. Chem., 2005, 26, 1701–1718 CrossRef CAS PubMed.
- W. R. P. Scott, P. H. Hunenberger, I. G. Tironi, A. E. Mark, S. R. Billeter, J. Fennen, A. E. Torda, T. Huber, P. Kruger and W. F. van Gunsteren, J. Phys. Chem. A, 1999, 103, 3596–3607 CrossRef CAS.
- U. Essmann, L. Perera, M. L. Berkowitz, T. Darden, H. Lee and L. G. Pedersen, J. Chem. Phys., 1995, 103, 8577–8593 CrossRef CAS PubMed.
- H. J. C. Berendsen, J. P. M. Postma, W. F. Vangunsteren, A. Dinola and J. R. Haak, J. Chem. Phys., 1984, 81, 3684–3690 CrossRef CAS PubMed.
- T. Ban, D. Hamada, K. Hasegawa, H. Naiki and Y. Goto, J. Biol. Chem., 2003, 278, 16462–16465 CrossRef CAS PubMed.
- H. LeVine, Arch. Biochem. Biophys., 1997, 342, 306–316 CrossRef CAS PubMed.
- V. N. Uversky and S. Longhi, Instrumental analysis of intrinsically disordered proteins: assessing structure and conformation, Wiley, Hoboken, N.J., 2010, p. xxix, 744, 716 of plates Search PubMed.
- W. Stricks and I. M. Kolthoff, J. Am. Chem. Soc., 1953, 75, 5673–5681 CrossRef CAS.
- R. Strand, W. Lund and J. Aaseth, J. Inorg. Biochem., 1983, 19, 301–309 CrossRef CAS.
- S. Pires, J. Habjanic, M. Sezer, C. M. Soares, L. Hemmingsen and O. Iranzo, Inorg. Chem., 2012, 51, 11339–11348 CrossRef CAS PubMed.
- H. Kozlowski, W. Bal, M. Dyba and T. Kowalik-Jankowska, Coord. Chem. Rev., 1999, 184, 319–346 CrossRef CAS.
- T. Kowalik-Jankowska, M. Ruta-Dolejsz, K. Wisniewska and L. Lankiewicz, J. Inorg. Biochem., 2002, 92, 1–10 CrossRef CAS.
- D. Witkowska, S. Bielinska, W. Kamysz and H. Kozlowski, J. Inorg. Biochem., 2011, 105, 208–214 CrossRef CAS PubMed.
- P. Giannozzi, K. Jansen, G. La Penna, V. Minicozzi, S. Morante, G. Rossi and F. Stellato, Metallomics, 2012, 4, 156–165 RSC.
- F. Guerrieri, V. Minicozzi, S. Morante, G. Rossi, S. Furlan and G. La Penna, JBIC, J. Biol. Inorg. Chem., 2009, 14, 361–374 CrossRef CAS PubMed.
- C. Migliorini, A. Sinicropi, H. Kozlowski, M. Luczkowski and D. Valensin, JBIC, J. Biol. Inorg. Chem., 2014, 19, 635–645 CrossRef CAS PubMed.
- L. Quintanar, L. Rivillas-Acevedo, R. Grande-Aztatzi, C. Z. Gomez-Castro, T. Arcos-Lopez and A. Vela, Coord. Chem. Rev., 2013, 257, 429–444 CrossRef CAS PubMed.
- T. M. DeSilva, G. Veglia, F. Porcelli, A. M. Prantner and S. J. Opella, Biopolymers, 2002, 64, 189–197 CrossRef CAS PubMed.
- P. Rousselot-Pailley, O. Seneque, C. Lebrun, S. Crouzy, D. Boturyn, P. Dumy, M. Ferrand and P. Delangle, Inorg. Chem., 2006, 45, 5510–5520 CrossRef CAS PubMed.
- R. Srinivasan, E. M. Jones, K. Liu, J. Ghiso, R. E. Marchant and M. G. Zagorski, J. Mol. Biol., 2003, 333, 1003–1023 CrossRef CAS PubMed.
Footnote |
† Electronic supplementary information (ESI) available: Mass spectrometry analysis of the ternary system; Fig. 1S, ESI-MS spectra of the Hg(II) complex of the Bri2-23 peptide at pH 11 in ammonium hydroxide (0.4 M). cBri2-23 = 1 × 10⁻⁴ M; Hg(II)/Bri2-23/Cys ratio 1![[thin space (1/6-em)]](https://www.rsc.org/images/entities/char_2009.gif) : :![[thin space (1/6-em)]](https://www.rsc.org/images/entities/char_2009.gif) 1 1![[thin space (1/6-em)]](https://www.rsc.org/images/entities/char_2009.gif) : :![[thin space (1/6-em)]](https://www.rsc.org/images/entities/char_2009.gif) 1; MeOH/H2O = 1 1; MeOH/H2O = 1![[thin space (1/6-em)]](https://www.rsc.org/images/entities/char_2009.gif) : :![[thin space (1/6-em)]](https://www.rsc.org/images/entities/char_2009.gif) 2. Fig. 2S, the isotopic profile of ternary Hg(II) complex species of Bri2-23 and cysteine at pH 11 in ammonium hydroxide (0.4 M). [Bri2-23] 1 × 10⁻⁴ M; Hg(II)/Bri2-23/Cys ratio 1 2. Fig. 2S, the isotopic profile of ternary Hg(II) complex species of Bri2-23 and cysteine at pH 11 in ammonium hydroxide (0.4 M). [Bri2-23] 1 × 10⁻⁴ M; Hg(II)/Bri2-23/Cys ratio 1![[thin space (1/6-em)]](https://www.rsc.org/images/entities/char_2009.gif) : :![[thin space (1/6-em)]](https://www.rsc.org/images/entities/char_2009.gif) 1 1![[thin space (1/6-em)]](https://www.rsc.org/images/entities/char_2009.gif) : :![[thin space (1/6-em)]](https://www.rsc.org/images/entities/char_2009.gif) 1; MeOH/H2O = 1 1; MeOH/H2O = 1![[thin space (1/6-em)]](https://www.rsc.org/images/entities/char_2009.gif) : :![[thin space (1/6-em)]](https://www.rsc.org/images/entities/char_2009.gif) 2; isothermal titration calorimetry; Fig. 3S, total measured heat associated with titration of the Bri peptide with Hg(II), and the binding isotherm derived from the enthalpy of each injection as a function of molar equivalents of Hg(II); Fig. 4S, 199mHg PAC data for BRI2-23 under the indicated experimental conditions; Fig. 5S, 2D 1H–1H TOCSY spectra (NH-Hα region) of Bri2-23 0.5 mM in H2O 2; isothermal titration calorimetry; Fig. 3S, total measured heat associated with titration of the Bri peptide with Hg(II), and the binding isotherm derived from the enthalpy of each injection as a function of molar equivalents of Hg(II); Fig. 4S, 199mHg PAC data for BRI2-23 under the indicated experimental conditions; Fig. 5S, 2D 1H–1H TOCSY spectra (NH-Hα region) of Bri2-23 0.5 mM in H2O![[thin space (1/6-em)]](https://www.rsc.org/images/entities/char_2009.gif) : :![[thin space (1/6-em)]](https://www.rsc.org/images/entities/char_2009.gif) D2O 90 D2O 90![[thin space (1/6-em)]](https://www.rsc.org/images/entities/char_2009.gif) : :![[thin space (1/6-em)]](https://www.rsc.org/images/entities/char_2009.gif) 10 at 298 K and pH 3.0 in the presence of (A) 0.9 equivalents of Ag(I) ions; (B) 0.9 equivalents of Hg(II) ions; Fig. 6S, 2D 1H–1H TOCSY spectra of Bri2-23 0.5mM in H2O 10 at 298 K and pH 3.0 in the presence of (A) 0.9 equivalents of Ag(I) ions; (B) 0.9 equivalents of Hg(II) ions; Fig. 6S, 2D 1H–1H TOCSY spectra of Bri2-23 0.5mM in H2O![[thin space (1/6-em)]](https://www.rsc.org/images/entities/char_2009.gif) : :![[thin space (1/6-em)]](https://www.rsc.org/images/entities/char_2009.gif) D2O 90 D2O 90![[thin space (1/6-em)]](https://www.rsc.org/images/entities/char_2009.gif) : :![[thin space (1/6-em)]](https://www.rsc.org/images/entities/char_2009.gif) 10 at 298K and pH 3.0, in the presence of 0.5 equivalents of Hg(II) ions, in the presence of 0.9 equivalents of Hg(II) ions; Fig. 7S, superimposed selected structures obtained by NMR DYANA calculations; Fig. 8S, RMS fluctuation calculated for each residue of structures E and F. See DOI: 10.1039/c4mt00274a 10 at 298K and pH 3.0, in the presence of 0.5 equivalents of Hg(II) ions, in the presence of 0.9 equivalents of Hg(II) ions; Fig. 7S, superimposed selected structures obtained by NMR DYANA calculations; Fig. 8S, RMS fluctuation calculated for each residue of structures E and F. See DOI: 10.1039/c4mt00274a |
| This journal is © The Royal Society of Chemistry 2015 |

