 Open Access Article
Creative Commons Attribution 3.0 Unported Licence
Evaluation of water displacement energetics in protein binding sites with grid cell theory†
G.
Gerogiokas
a,
M. W. Y.
Southey
b,
M. P.
Mazanetz
b,
A.
Hefeitz
b,
M.
Bodkin
b,
R. J.
Law
b and
J.
Michel
*a
aEaStCHEM School of Chemistry, Joseph Black Building, The King's Buildings, Edinburgh, EH9 3JJ, UK. E-mail: mail@julienmichel.net
bEvotec (UK) Limited, 114 Innovation Drive, Milton Park, Abingdon, Oxfordshire OX14 4SA, UK
First published on 12th January 2015
Abstract
Excess free energies, enthalpies and entropies of water in protein binding sites were computed via classical simulations and Grid Cell Theory (GCT) analyses for three pairs of congeneric ligands in complex with the proteins scytalone dehydratase, p38α MAP kinase and EGFR kinase respectively. Comparative analysis is of interest since the binding modes for each ligand pair differ in the displacement of one binding site water molecule, but significant variations in relative binding affinities are observed. Protocols that vary in their use of restraints on protein and ligand atoms were compared to determine the influence of protein–ligand flexibility on computed water structure and energetics, and to assess protocols for routine analyses of protein–ligand complexes. The GCT-derived binding affinities correctly reproduce experimental trends, but the magnitude of the predicted changes in binding affinities is exaggerated with respect to results from a previous Monte Carlo Free Energy Perturbation study. Breakdown of the GCT water free energies into enthalpic and entropic components indicates that enthalpy changes dominate the observed variations in energetics. In EGFR kinase GCT analyses revealed that replacement of a pyrimidine by a cyanopyridine perturbs water energetics up three hydration shells away from the ligand.
Introduction
A long standing goal in computational chemistry is the routine accurate prediction of free energies of binding of drug-like small molecule ligands to proteins.1 A strategic driver for this objective is its potential for significantly decreasing the resources and time commitments currently necessary for preclinical drug discovery activities.2,3 A full description of protein–ligand interactions in aqueous environments requires a thorough analysis of the contributions of protein, ligand and solvent particles to the binding energetics. The role played by water in particular is the subject of intense research owing to its large influence on the binding process. In particular, there is extensive evidence that binding site water molecules are key players in this process.4–7 This report focuses on the perturbations in binding site water network structure and associated energetics that occur upon small chemical modifications of small molecule ligands. This task is commonly attempted during hit-to-lead and lead optimisation phases of a structure-based drug discovery campaign.Numerous computational methods have been developed to determine water location and energetics in binding sites owing to the difficulty of measuring these observables and quantities with experiments. A non-exhaustive list includes: the rolling probe-based Grid software; molecular dynamics probes based methods such as MDMix,8 MixMD,9 SILCS;10 the Monte-Carlo λ-dynamics based algorithm JAWS,11,12 inhomogeneous fluid solvation theory (IFST) based techniques,13–16 including the popular method Watermap;17 implicit and semi-explicit solvent methods such as SZMAP,18 three dimensional reference interaction site model (3D-RISM),19 and variational implicit solvent model (VISM).20
There is growing evidence that judicious use of the above methods is not only useful to further understanding of protein–ligand interactions with retrospective studies, but also to assist structure-based medicinal chemistry efforts. For instance the Watermap program was used at Pfizer to rationalise SAR and guide development of improved BACE-1 inhibitors.21 In pursuit of a robust general methodology to this end our groups have recently proposed the Grid Cell Theory (GCT) methodology. The approach relies on a discretisation of the cell theory method developed by Henchman and co-workers,22–25 to spatially resolve the free energy, enthalpy and entropy of water molecules at a protein interface. The methodology has been validated by prediction of the hydration thermodynamics of small molecules,26 and has been applied to elucidate the binding thermodynamics of idealised host–guest systems.27
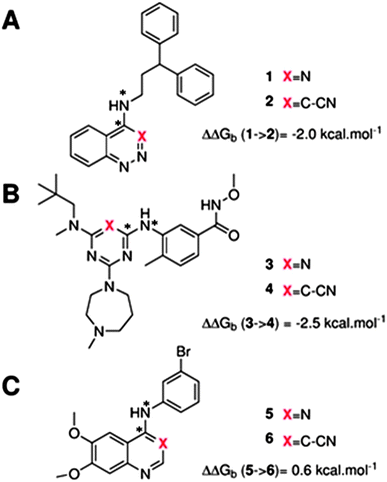
The GCT method is applied in the present report for the first time to protein–ligand complexes in order to elucidate the impact of ligand modifications on the thermodynamic properties of binding site water molecules. Pairs of congeneric ligands of three different proteins have been chosen for the present study, scytalone dehydratase,28 p38α MAP kinase,29 and EGFR kinase.30 In each case, a similar strategy was used to displace a single binding site water molecule by introduction of a cyano group, yet significant differences were observed in the changes in binding affinity (Fig. 1). Previous computational work has reproduced the observed trends in relative binding affinities with the aid of Monte Carlo free energy perturbation methodologies (MC/FEP), but did not provide details of the enthalpic and entropic components of the binding affinities or the details of the water network perturbations.31 The goals of the present study were, firstly to assess whether GCT is a competitive alternative to MC/FEP, secondly to determine solvent enthalpic and entropic contributions to binding affinities, and thirdly to determine the extent of binding site water perturbations upon a local ligand modification.
Theory and methods
Thermodynamic cycles
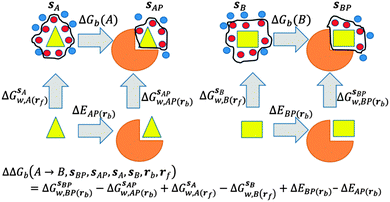
GCT analyses were performed on the basis of the thermodynamic cycle depicted in Fig. 2. The free energy change for water displacement is given by eqn (1): | (1) |
 is the free energy of hydration of the monitored region sAP in the presence of ligand A and protein P with restraint protocol rc, whereas expressions for ligand B are for the water displacing analogue. The water reorganisation free energy is given by eqn (2):
 | (2) |
 and B
and B  computed using regions sA and sB and restraint protocol rl. Relative free energies of binding are obtained with eqn (3):
 | (3) |
Grid cell theory
Hydration free energies were computed using the grid cell theory method. In this approach the density, enthalpy, entropy and free energy of water are evaluated for an arbitrary region of space s surrounding a solute X restrained by protocol r. The approach involves three steps.• Evaluation of cell parameters for water molecules within s:
For each frame f to analyse, cell parameters for each of the Nf water molecules i ∈ s are determined. The cell parameters are: the solute–water interaction energy ΔHX(r)i; the water–water interaction energy ΔHwi; the principal axes components of the force Fji (j = x, y, z) acting on the water molecule; the principal axes components of the torques τji (j = x, y, z) acting on the water molecule; the orientational number Ωorii of the water molecule. Detailed expressions for these quantities are available in ref. 26.
• Evaluation of voxels parameters within s:
The region s is decomposed into Ns cubic voxels of volume V(k). Cell parameters are computed for each voxel k according to eqn (4):
 | (4) |
 | (5) |
Solute and solvent components of the enthalpy of hydration of region s are given by eqn (6) and (7):
 | (6) |
 | (7) |
| ΔHsw,X(r) = ΔHsX(r) + ΔHsw | (8) |
Noting that the average number of water molecules within s is:
 | (9) |
Expressions for the average orientational number and forces/torques of region s are given by eqn (10):
 | (10) |
 | (11) |
 | (12) |
 | (13) |
| ΔSsw,X(r) = ΔSs,oriw,X(r) + ΔSs,vibw,X(r) + ΔSs,libw,X(r) | (14) |
The excess free energy of water is obtained from the enthalpic and entropic components:
| ΔGsw,X(r) = ΔHsw,X(r) − TΔSsw,X(r) | (15) |
Eqn (4)–(15) were evaluated with the trajectory analysis software Nautilus. Details of the potential energy functions, regions and restraint protocols used in the present study are given below.
Restraints protocols
GCT calculations were performed with several different protocols that vary in their use of restraints to control the conformations sampled by the ligands or protein during the simulations. GCT calculations can in principle be performed without any restraints on solutes; however this has a number of disadvantages. Firstly, extensive conformational sampling is required to obtain converged water properties for flexible solutes. Secondly, graphical analyses of voxel properties are more complex. Thirdly, the thermodynamic cycle depicted in Fig. 2 doesn't consider contributions from changes in conformations or flexibility from the protein and ligands. On the other hand restraints are artificial and may negatively affect the predictions of free energies of binding. In the present work different restraining protocols r were compared in an effort to identify a practical protocol for routine calculations.In the r = rot protocol positional restraints were applied on two atoms of a ligand. This was done to suppress rigid body motions of the ligand. For all ligands the restrained atom is denoted by a star in Fig. 1. In the r = bb protocol, positional restraints were applied to protein backbone heavy atoms only. Finally, in the r = full protocol, positional restraints were applied to all heavy atoms of both ligand and protein. When in solution with the full protocol, ligands were restrained in their binding site conformation. Restraints were implemented with a force constant of 10 kcal mol−1 Å−2 for the bb and full protocols, and with a force constant of 5 kcal mol−1 Å−2 for the rot protocol. All restraints were applied on absolute Cartesian coordinates.
Preparation of molecular models
Models of scytalone dehydratase in complex 1 and 2 were generated using the PDB structure 3STD which was in complex with 2. The crystal structure of EGFR kinase in complex with erlotinib (PDB 1M17) was used to define the binding mode of 5 and 6. For p38 MAP kinase case the crystal structure of PDB 1DI9 which is in complex with a quinazoline inhibitor, was used to generate the protein model. AutoDock Vina32 with the pymol plugin33 was used to find suitable binding modes for 3 and 4 that matched structural data reported by Liu et al.29 for 4. The lowest energy pose produced by Vina for 4 was found to bind in a similar orientation.The TIP4P-Ew water model was used throughout.34 All the small molecules were parameterized using the GAFF force field35 and AM1-BCC charges,36 as implemented in the AMBER11 software suite.37 For the protein, the ff12SB force field was used. Each protein complex and ligand was solvated with water extending 12 angstrom away from the edge of the solutes before performing energy minimisation. The preparation of molecular models was largely automated by the use of the software FESetup.38
Molecular dynamics simulations
Molecular simulations were produced using the software Sire/OpenMM wich in the present study results from linking of the general purpose molecular simulation package Sire revision 1786, with the GPU molecular dynamics library OpenMM revision 3537.39 Simulations were run at 1 atm and 298 K using an atom-based generalized reaction field nonbonded cutoff of 10 Å for the electrostatic interactions,40 and an atom-based non bonded cutoff of 10 Å for the Lennard-Jones interactions. A velocity-Verlet integrator with a time step of 2 fs was used. Temperature control was achieved with an Andersen thermostat with a coupling constant of 10 ps−1.41 Pressure control used isotropic box edge scaling Monte Carlo moves every 25 time steps. The OpenMM default error tolerance settings were used to constrain the intramolecular degrees of freedom of water molecules. For each system three simulations of 22 ns were run using the same starting conformation but a different random velocity assignment. Snapshots were stored every 1 ps and were written into a DCD format. The first 1 ns of each trajectory was discarded to enable equilibration.Grid cell theory analyses
All GCT analyses were performed with the trajectory post-processing software Nautilus.26 Bulk parameters for TIP4P-Ew were taken from a previous GCT study.26 The following protocols were used to define the regions of space subjected to Nautilus analyses. For each simulation, a 3D grid of evenly spaced points was centered on the Cartesian coordinates of the centre of mass of the ligand (xcom, ycom, zcom). A rectangular region with minimum and maximum coordinates (xcom ± Δx, ycom ± Δy, zcom ± Δz) was next defined and filled with grid points spaced every 0.5 Å along the x, y, and z components. The parameters Δx, Δy and Δz were chosen such that the grid would extend well beyond the ligand atoms or binding site region of interest (typical values are 11–14 Å). Cell parameters for every grid point within this rectangular region were then computed. For the simulations of the unbound ligands with the restraint protocol r = full, regions sA/sB were defined as the union of the set of grid points that were within Xvdw Å of the van-der-Waals surface of the ligands A or B respectively. AMBER GAFF forcefield radii were used to define the van-der-Waals surface from the input ligand coordinates and several values of Xvdw were tested. For the simulations of the unbound ligands with the protocol r = rot, regions sA/sB were defined as the length Xcubic of the edge of a cube centred on (xcom, ycom, zcom).For the simulations of the bound ligands with the restraint protocol r = full or r = bb, regions sAP, sBP were defined by density-clustering of the trajectories of AP and BP. All grid points were first sorted by their local water density ρ(k) in the simulation of AP. The medoid of a cluster was taken to be the grid point with highest density, and all grid points within 1.5 Å of this medoid were assigned to the cluster. All grid points belonging to the cluster were then removed from the grid and the process was iterated until no grid point with a density greater than 1.5 times bulk was found, yielding kAP medoids. The process was repeated for the trajectory of BP, yielding kBP medoids. Next, only medoids present in the binding site region of interest were retained, these were typically medoids present in binding site regions disconnected from bulk.
Next regions sAP or sBP were defined by selecting all grid points within Xmedoid Å of each of the kAP and kBP medoids In some instances, the medoids from the AP or BP simulations had very similar coordinates and a single medoid was retained. The procedure yielded a monitoring region sC that is the union of sAP and sBP. In some instances, additional analyses were performed by breaking-down sAP or sBP into M sub-regions {s0,…, sm}. This was done by defining a centre rm = (xm, ym, zm) for each of the M regions. The distance dim of each grid point i in sAP/sBP to each rm was computed and the grid point i was assigned to the region M with the smallest value of dim.
Results
Ligand hydration energetics
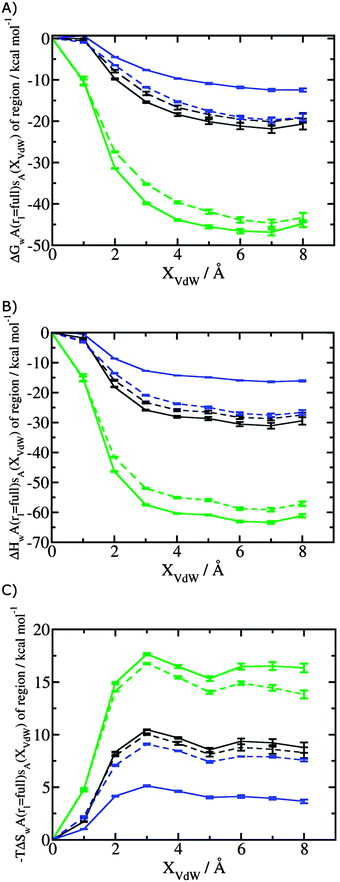
Fig. 3A shows that the computed free energy of hydration of a ligand in the GCT formalism depends on the size of the monitored region. With the r = full restraint protocol, hydration free energies have converged for regions that extend approximately 6 Å away from the van der Waals surface of the ligands. For regions of this size, uncertainties in the absolute hydration free energies are on the order of 1 kcal mol−1. As discussed elsewhere, GCT hydration free energies are less precise than those computed by FEP or TI approaches because of the contribution of water–water interaction energies to the enthalpy of hydration (Fig. 3B). The entropies of hydration (Fig. 3C) are by contrast typically slightly better converged.25 For the purpose of computing relative binding free energies between a pair of ligands, relative free energies of hydration are sufficient, and Fig. 3A shows that reasonable estimates of the difference can be estimated with smaller regions that extend about 4 Å away from the van der Waals surface of the ligands. The use of very large GCT regions is actually detrimental to accuracy since the magnitude of uncertainties increases with the size of the region. Overall for these ligands, a good trade-off is to select a value of the parameter XVdW between 4–6 Å.Fig. 4 shows the computed hydration free energies (Fig. 4A), hydration enthalpies (Fig. 4B), and hydration entropies (Fig. 4C) with the rl = rot protocol. Convergence of the computed hydration energetics is observed for cubes of edge length Xcubicca. 10 Å. The uncertainties in the computed quantities are larger than with rl = full protocol since the volume of the monitored region is actually larger. The relative hydration free energies are broadly comparable between the two restraint protocols for ligands 1, 2 and for ligands 3, 4, but a noticeable discrepancy is apparent for ligands 5, 6 ΔΔGhyd(5 → 6, s6, s5, rl = full, XVdW = 6 Å) = −7.3 ± 0.5 kcal mol−1, versus ΔΔGhyd(5 → 6, s6, s5, rl = rot, Xcubic = 9 Å) = −0.3 ± 1.5 kcal mol−1. Visualization of the trajectories indicates that this likely occurred because the pyrimidine N1 nitrogen of 5 is poorly hydrated owing to the close proximity of the bromophenyl group in the rl = full simulations. This occurred because the ligand was restrained to adopt the binding mode seen in the complex with EGFR kinase. Without such restraints in the rl = rot simulations, 5 relaxed to a different conformation that increases hydration of the pyrimidine N1 nitrogen in 5.
Protein–ligand complex hydration energetics
Fig. 5A shows the convergence of ΔΔGhyd(AP → BP, sBP, sAP, rc) as a function of time, for three different monitored regions sc defined by varying the parameter Xmedoid, and for two different restraining protocols rc. For low or intermediate values of Xmedoid, similar results are obtained and trajectories of ca. 15 ns are needed to observe convergence. The same hydration free energy is obtained because the larger region defined with Xmedoid = 4 Å still includes only one water molecule. However for Xmedoid = 8 Å, the hydration free energies differ markedly because the monitored region sc is now sufficiently large that it includes additional water molecules, some of them located out of the binding site of scytalone dehydratase. The hydration energetics are therefore different, and in the case of the rc = bb protocol, no convergence is observed. The hydration energies between the rc = bb and rc = full protocols are not consistent because conformational changes in protein residues during the rc = bb simulations affect the energetics of water molecules within the monitored region sc. Similar variability is seen for p38 MAP kinase and EGFR kinase (Fig. S1 in ESI†).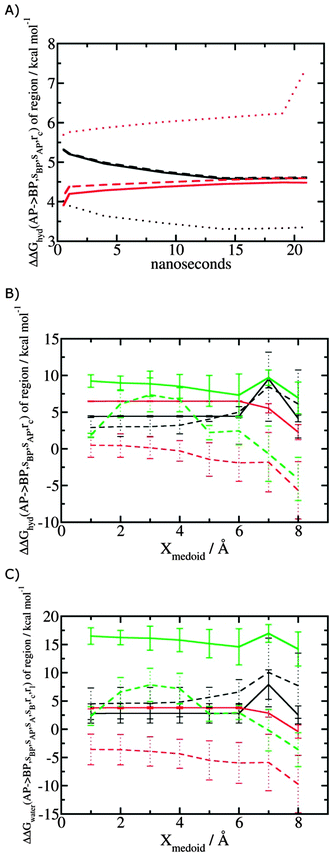 | ||
| Fig. 5 Convergence of hydration energetics and water reorganisation energetics for protein–ligand complexes. (A) Convergence of hydration energetics (eqn (1)) with respect to trajectory duration for scytalone dehydratase. Results in black are for rc = full, and in red for rc = bb. The solid line is for Xmedoid = 1 Å, the dashed line for Xmedoid = 4 Å, and the dotted line for Xmedoid = 8 Å. (B) Hydration energetics as a function of Xmedoid using the full trajectories for scytalone dehydratase (black) p38 MAP kinase (red), and EGFR kinase (green). Solid lines are the results obtained with the rc = full protocol and dotted lines are the results obtained with the rc = bb protocol. (C) Same as (B) but for the water reorganisation energy (eqn (2)) using rl = full, XVdW = 6 Å or rl = rot, Xcubic = 10 Å. | ||
Fig. 5B shows the computed hydration energetics for the three complexes using the full trajectories, but varying Xmedoid. The plots show that the changes in hydration energetics between ligand pairs is relatively constant for small values of Xmedoid, and the rc = full protocol. Larger fluctuations are seen for EGFR kinase since the monitoring region sc is larger and contains more water molecules. Larger values of Xmedoid, or the additional protein flexibility in the rc = bb protocol, causes increased statistical errors and fluctuations in the computed energetics. This indicates that much longer trajectories would be needed to obtain well reproducible changes in hydration energetics of the complexes. Consequently similar variability is seen in the evaluation of water reorganisation energies with eqn (3) (Fig. 5C). Overall, with trajectories of the order of ca. 10 ns, it seems advisable to use the rc = full protocol with Xmedoid values between 4 to 6 Å if reproducible hydration energies are desired.
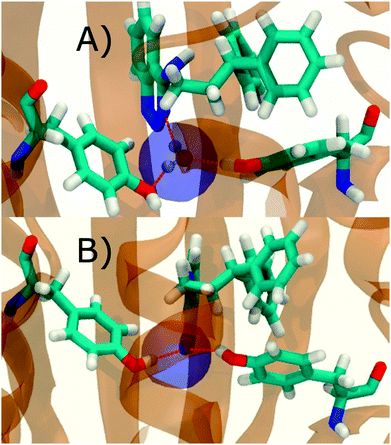
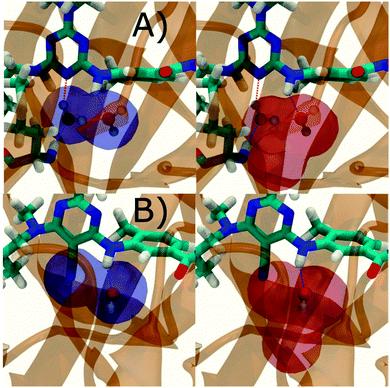
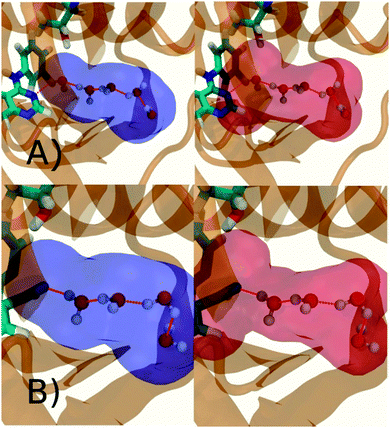
Fig. 6A shows the water content of the monitored region for the scytalone dehydratase/1 complex. A single buried water molecule is present, hydrogen-bonded to two nearby tyrosine side-chains, and the nitrogen N1 of 1. As expected, the water molecule is displaced in the scytalone dehydratase/2 complex, and the cyano group is instead hydrogen-bonded to the two tyrosine phenolic hydroxyl groups (Fig. 6B). The monitored region in the p38 MAP kinase/3 complex contains two water molecules that mediate hydrogen-bonding interactions between the ligand and the protein (Fig. 7A). Interestingly, the rc = full and rc = bb protocols lead to qualitatively different monitored regions. This is because in simulations of the complex with 3 under rc = bb conditions, one of the two water molecules may sometime migrate to a third position, and then escape from the binding site. This occurred in ca. 5 ns in the first replicate, didn't occur in the second replicate, and occurred after 3 ns in the third replicate, but another water molecule returned after 20 ns to reproduce the original hydration state. This suggests a slow equilibrium between at least two hydration states. By contrast, the picture that emerges from simulation of 4 with the two restraining protocols is relatively consistent (Fig. 7B). In the case of EGFR kinase in complex with 5 (Fig. 8A), the monitored region contains a cluster of five water molecules in a tunnel that leads back to a solvent exposed surface of the protein. The monitored regions in the two restraining protocols are broadly similar, with the rc = bb protocol leading to an enlarged monitored region owing to greater fluctuations in the positions of the water molecules. The cyano analogue 6 displaces a single water molecule as expected.
Binding energetics
Table 1 summarizes the components of the thermodynamic cycle depicted in Fig. 2, for varying restraint protocols and parameters that define the size of the monitored regions. The hydration free energies (rows 1–4) have been discussed previously. This data is completed with protein–ligand interaction energies (rows 5, 6), enabling computation of all the components (rows 7–12) of the thermodynamic cycle depicted in Fig. 2 for restraint protocols that feature heavy-atom restraints or limited restraints. Comparison of rows 7 and 8 indicate that while interaction energies are broadly consistent for scytalone dehydratase and EGFR kinase with the rc = full or rc = bb protocols, there is a significant variation in the case of p38 MAP kinase. Visualisation of the trajectories indicate that this occurs because 3 adopts a shifted binding mode owing to the occasional decreased water content of the monitored region, and protein side-chain rearrangements. Variations in protein–protein interaction energies are ignored in the present cycle and the result is unbalanced interaction energies between 3 and 4. Row 11 and 12 lists the resulting binding site water displacement free energy for the three systems with the rc = full or rc = bb protocols. Both protocols indicate that the energetic cost for removing the water displaced by 6 in EGFR kinase is higher than for the displaced water molecules in scytalone dehydratase and p38 MAP kinase. However the free energy cost for displacing a water molecule from p38 MAP kinase is strongly influenced by restraints. This is because, as noted previously, in the rc = bb protocol the water content of the monitored region exchanges slowly between states with one or two water molecules. Thus on average 4 displaces less than one water molecule under these conditions. The data in rows 11 and 12 can be compared with MC/FEP results from Michel et al.,10 that reported MC/FEP water displacement free energies of 5.5 ± 0.2 kcal mol−1 (scytalone dehydratase), 4.2 ± 0.1 kcal mol−1 (p38 MAP kinase) and 6.9 ± 0.1 kcal mol−1 (EGFR kinase). Quantitative agreement is not expected as the forcefield and methods used differ, but qualitatively these figures are in closer agreement with those produced by the rc = full protocol. Completing the cycle yields relative binding free energies (rows 13 and 14). The binding free energies are more precise for the full restraints protocol for scytalone dehydratase and p38 MAP kinase, but not EGFR kinase, presumably because of the larger number of water molecules in the monitored region of the latter protein. The variations of the computed relative binding energies are much greater than observed experimental data (row 15) or those obtained by previous MC/FEP calculations (row 16, albeit with a different forcefield).31 GCT computed hydration free energies of small organic molecules have been shown previously to be highly correlated to TI computed hydration free energies. This suggests that the discrepancy here is likely due to the neglect of additional contributions such as changes in intramolecular energetics, or protein–ligand entropies, that would normally be included in a FEP/TI calculation. Others have also reported that the use of restraints tends to exaggerate the magnitude of the binding free energies of probe molecules to protein regions.42 Nevertheless, the qualitative picture doesn't change, and the relative binding free energy for 5 → 6 is much less favourable than for 1 → 2 and 3 → 4.| Protein | Scytalone dehydratase | p38 MAP kinase | EGFR kinase | |||
|---|---|---|---|---|---|---|
| Ligand | 1 | 2 | 3 | 4 | 5 | 6 |
 , rc = bb, Xmedoid = 4 Å , rc = bb, Xmedoid = 4 Å |
−3.2 ± 1.2 | 0 | −7.9 ± 1.5 | −8.2 ± 0.4 | −39.6 ± 2.9 | −32.9 ± 3.1 |
 , rc = full, Xmedoid = 4 Å , rc = full, Xmedoid = 4 Å |
−4.2 ± 0.2 | 0 | −12.70 ± 0.02 | −6.2 ± 0.1 | −36.4 ± 0.4 | −27.9 ± 1.8 |
 , rl = full, Xvdw = 6 Å , rl = full, Xvdw = 6 Å |
−21.2 ± 0.8 | −19.6 ± 0.8 | −46.6 ± 0.5 | −43.9 ± 0.6 | −11.8 ± 0.2 | −19.1 ± 0.4 |
 , rl = rot, Xcubic = 9 Å , rl = rot, Xcubic = 9 Å |
−17.7 ± 0.8 | −19.3 ± 1.5 | −43.5 ± 1.3 | −39.4 ± 0.8 | −17.4 ± 1.5 | −17.9 ± 0.6 |
| ΔE(AP → BP, rc), rc = bb | −59.9 ± 0.2 | −72.3 ± 0.2 | −79.7 ± 0.2 | −82.2 ± 3.1 | −57.9 ± 0.3 | −65.8 ± 0.4 |
| ΔE(AP → BP, rc), rc = full | −61.4 ± 0.1 | −75.0 ± 0.1 | −68.4 ± 0.3 | −83.7 ± 0.2 | −54.7 ± 0.1 | −62.0 ± 0.1 |
| ΔΔE(AP →BP, rc), rc = bb | −12.39 ± 0.04 | −2.5 ± 3.0 | −8.0 ± 0.5 | |||
| ΔΔE(AP →BP, rc), rc = full | −13.6 ± 0.2 | −15.3 ± 0.2 | −7.2 ± 0.1 | |||
| ΔΔGhyd(A → B, sA, sB, rl), rl = full, Xvdw = 6 Å | −1.6 ± 1.7 | −2.7 ± 0.2 | 7.3 ± 0.7 | |||
| ΔΔGhyd(A → B, sA, sB, rl), rl = rot, Xcubic = 9 Å | 1.6 ± 1.5 | −4.1 ± 1.2 | 0.5 ± 1.5 | |||
| ΔΔGhyd(AP → BP, sBP, sAP, rc), rc = full, Xmedoid = 4 Å | 4.4 ± 0.1 | 6.48 ± 0.04 | 8.5 ± 1.7 | |||
| ΔΔGhyd(AP → BP, sBP, sAP, rc), rc = bb, Xmedoid = 4 Å | 3.2 ± 1.2 | −0.3 ± 1.4 | 6.7 ± 1.7 | |||
| ΔΔGb(A → B, sBP, sAP, sA, sB, rc, rl), rc = full, Xmedoid = 4 Å, rl = full, Xvdw = 6 Å | −10.8 ± 1.7 | −11.6 ± 0.4 | 8.6 ± 2.2 | |||
| ΔΔGb(A → B, sBP, sAP, sA, sB, rc, rl), rc = bb, Xmedoid = 4 Å, rl = rot, Xcubic = 9 Å | −8.2 ± 2.9 | −6.8 ± 2.6 | −0.8 ± 2.2 | |||
| ΔΔGb experimental | −2.0 | −2.5 | 0.6 | |||
| ΔΔGb MC/FEP study31 (OPLS-AA/TIP4P) | −1.2 ± 0.2 | −3.0 ± 0.3 | 1.4 ± 0.2 | |||
Entropic and enthalpic contributions to the energetics of binding site water displacement
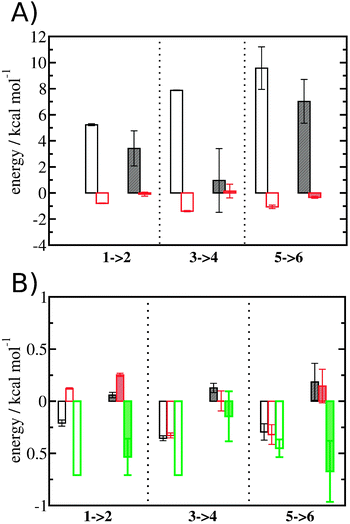
The free energy change for water displacement was decomposed in enthalpic and entropic contribution. Fig. 9A indicates that in almost all cases the enthalpic component is unfavourable, whereas the entropic component is favourable regardless of the restraining protocol. The only exception is for 3 → 4 and rc = bb, where the results are difficult to interpret since the number of water molecules displaced is on average less than one. The entropic component is relatively small and varies little across all systems, and variations in enthalpy changes dominate the overall thermodynamic signature. Fig. 9B breaks down further the entropy changes into vibrational, librational and orientational components. The results indicate that displacing a water molecule may increase or decrease the vibrational and librational water entropy depending on the binding site and the simulation protocol, but the orientational entropy component dominates the overall entropy variations. This indicates that the favourable entropic contribution upon water displacement is due to the increased number of hydrogen-bonding orientations available to water in bulk.Localisation of perturbations in water energetics
Additional insights into the binding process are gained by spatial decomposition of the hydration energetics of the monitored regions sc into sub-regions. Fig. 10A shows that for p38 MAP kinase, the largest contribution arise from the volume of space s0 (blue) that was occupied by the water molecule displaced by 4. The cyano group additionally perturbs the interactions of the neighbouring water molecule, shifting it from region s1 (red) towards s2 (green). The net effect almost cancels out and the energetic contributions from s0 are very similar to the full monitored region sc. | ||
| Fig. 10 Spatial decomposition of the changes in hydration energetics within the GCT monitored regions. The monitored region depicted in Fig. 7 and 8 was broken down into sub-regions for the rc = full protocol simulations. For each sub-region, the relative hydration free energy ΔΔGhyd(AP → BP, sBP, sAP, rc), relative hydration enthalpy ΔΔHhyd(AP → BP, sBP, sAP, rc) and relative hydration entropy −TΔΔShyd(AP → BP, sBP, sAP, rc) are depicted as bars (left). The contributions from the full region sc are shown in black. The right panel depicts the localisation of each sub-region. (A) p38 MAP kinase. (B) EGFR kinase. | ||
In EGFR kinase (Fig. 10B) the water volume displaced by the cyano group of 6 (blue) also accounts for the majority of the changes in hydration energetics. Additionally, the first hydration (red) and second (purple) hydration shells of the cyano group are destabilized, whereas the third (maroon) hydration shell is stabilised, and the fourth hydration shell (green) is unperturbed. Thus introduction of the cyano group has perturbed water properties up to 10 Å away. Here water network perturbations (all regions si, i > 0) contribute approximately 1 additional kcal mol−1 to the changes in hydration energetics. Thus, that the 5 → 6 substitution is not energetically favourable is the result of: higher water displacement energetics (Fig. 10As0versusFig. 10Bs0), water network rearrangement penalties (Fig. 10Bs1, s2, s3), and weaker improvements in protein–ligand interaction energies (Table 1, row 8).
Discussion
The present study analysed in details the consequences of the use of different restraint protocols to control the allowed flexibility of protein and ligand atoms over the course of an MD simulation. Restraints are undesirable in the sense that they are artificial, and as the results have shown, can quantitatively and qualitatively affect the outcome of a GCT analysis. On the other hand, limited or lack of restraints, that should give more accurate results, leads actually to poor reproducibility of computed quantities for simulations on a ca. 10 ns timescale. An important consideration of the present study was to explore the feasibility of using GCT for routine analyses in the context of structure-based drug design programs where computation is typically asked to inform evaluation of hundreds of candidate compounds on a time-scale of a few days. In this context, very long MD simulations are not practical. Overall the results suggest that for thermodynamic cycle analyses restraints should be used to probe specific protein–ligand conformational states. If different binding modes are to be evaluated, this is best done by separate analyses of different conformational states with rc = full restraints, alternatively prohibitively long simulations may be needed to average over multiple binding modes, as evidenced for 3 with the protocol that enabled side-chain and ligand flexibility in p38 MAP kinase. If the expected binding modes are unknown, they could be explored prior analyses by means of unrestrained MD simulations. Additionally, care should be taken when selecting a representative conformation of the ligand for solution calculations, as evidenced by the discrepancy in computed relative hydration free energies for 5 and 6.Arguably, the appeal of GCT is in the additional information that it provides over, for instance, an alchemical relative hydration free energy calculation. The breakdown of hydration free energies into enthalpic and entropic components revealed that the variations in hydration energetics upon water displacement are dominated by enthalpy. A rationale for displacing water molecules from binding sites is the associated gain in entropy that should favour the process. However the data shown in Fig. 9 shows that this outcome, at least for the cases investigated here, may only be achieved if the relatively larger loss of enthalpy is counter-balanced by equally favourable additional protein–ligand interaction energies. In essence, harnessing entropy by water displacement requires carefully maintaining an energetically similar pattern of hydrogen-bonding interactions at the site of the displaced water molecule. The entropy gains are dominated by a favourable increase in orientational entropy and this is due to the lower average number of orientations that a water molecule may adopt in a binding site versus bulk conditions. Such observations have been reported for water in other binding sites,27,43 and for a range of idealised host–guest cavities.27 While it is possible to evaluate enthalpic and entropic contributions to free energies of binding of water molecules with FEP/TI this would require many more simulations at multiple temperatures,44 and this route doesn't provide a breakdown of entropic contributions into physically insightful translational, rotational and orientational motions.
An important additional insight into the physical chemistry principles that underpin water-mediated protein–ligand interactions is provided by Fig. 10. In both p38 MAP kinase and EGFR kinase, most of the change in hydration free energy due to water displacement comes from the water molecule that was displaced by the cyano group of 4 and 6 respectively. However, further analysis of the neighboring solvent regions reveal that large but compensating variations in water energetics occurred. In the case of EGFR kinase, the perturbations in water properties propagate up to the third hydration shell of the cyano moiety, and these water network perturbations penalize additionally water displacement by approximately 1 kcal mol−1. Investigation of other systems is desirable to establish the magnitude and frequency of water network perturbation effects in protein–ligand complexes.
Conclusions
The GCT methodology was developed to provide insights into the hydration thermodynamics of organic and biomolecules. Here it was applied for the first time to a set of protein–ligand complexes where congeneric ligand pairs displace a single water molecule from the binding site. It was shown that protocols that restrain the range of allowed motions of the protein and ligand may be more judicious in context where throughput and speed considerations are important, as it is for applications to structure-based drug design programs. More realistic models (i.e. fewer or no restraints) will require significantly longer simulations to achieve reasonable reproducibility. While hydration free energies can be predicted with a range of methodologies, the appeal of the GCT technique is that it provides insights into the contributions of enthalpy and entropy to the free energy changes, and that it enables a spatial decomposition of these components. This was used here to determine the spatial extent of the energetics perturbations in a water network upon modification of the chemical structure of a ligand. Further developments of the GCT formalism would be desirable to account for associated changes in protein and ligand entropy,45 and to automatically assess the conformational dependence of hydration free energies. Overall the current GCT implementation appears well suited for clarifying the role of water in protein–ligand binding, and applications in combination with for instance alchemical free energy methods,46 should be envisioned.Acknowledgements
J.M. is supported by a University Research Fellowship from the Royal Society. This research was also supported by EPSRC through an award of a CASE studentship to G.G. and by a Royal Society research equipment grant (No. RG110450). The authors acknowledge Zhesi Zhu for useful preliminary results from an earlier study. The research leading to these results has also received funding from the European Research Council under the European Union's Seventh Framework Programme (FP7/2007–2013)/ERC Grant Agreement No. 336289 to J.M.Notes and references
- W. L. Jorgensen, Science, 2004, 303, 1813–1818 CrossRef CAS PubMed.
- J. Michel, Phys. Chem. Chem. Phys., 2014, 16, 4465–4477 RSC.
- J. Michel, N. Foloppe and J. W. Essex, Mol. Inf., 2010, 29, 570–578 CrossRef CAS.
- A. Woodhead, H. Angove, M. Carr, G. Chessari, M. Congreve, J. Coyle, J. Cosme, B. Graham, P. Day, R. Downham, L. Fazal, R. Feltell, E. Figueroa, M. Frederickson, J. Lewis, R. McMenamin, C. Murray, A. O'Brien, L. Parra, S. Patel, T. Phillips, D. Rees, S. Rich, D.-M. Smith, G. Trewartha, M. Vinkovic, B. Williams and A. Woolford, J. Med. Chem., 2010, 53, 5956–5969 CrossRef CAS PubMed.
- M. Adler, D. D. Davey, G. B. Phillips, S. H. Kim, J. Jancarik, G. Rumennik, D. R. Light and M. Whitlow, Biochemistry, 2000, 39, 12534–12542 CrossRef CAS PubMed.
- N. Huang and B. K. Shoichet, J. Med. Chem., 2008, 51, 4862–4865 CrossRef CAS PubMed.
- Z. Li and T. Lazaridis, J. Phys. Chem. B, 2004, 109, 662–670 CrossRef PubMed.
- D. Alvarez-Garcia and X. Barril, J. Med. Chem., 2014, 57, 8530–8539 CrossRef CAS PubMed.
- K. W. Lexa and H. A. Carlson, J. Chem. Inf. Model., 2013, 53, 391–402 CrossRef CAS PubMed.
- W. Yu, S. K. Lakkaraju, E. P. Raman and A. D. MacKerell Jr., J. Comput.-Aided Mol. Des., 2014, 28, 491–507 CrossRef CAS PubMed.
- J. Michel, J. Tirado-Rives and W. Jorgensen, J. Phys. Chem. B, 2009, 113, 13337–13346 CrossRef CAS PubMed.
- M. S. Bodnarchuk, R. Viner, J. Michel and J. W. Essex, J. Chem. Inf. Model., 2014, 54, 1623–1633 CrossRef CAS PubMed.
- T. Lazaridis, J. Phys. Chem. B, 1998, 102, 3531–3541 CrossRef CAS.
- T. Lazaridis, J. Phys. Chem. B, 1998, 102, 3542–3550 CrossRef CAS.
- C. Nguyen, T. K. Young and M. Gilson, J. Chem. Phys., 2012, 137, 044101 CrossRef PubMed.
- C. N. Nguyen, A. Cruz, M. K. Gilson and T. Kurtzman, J. Chem. Theory Comput., 2014, 10, 2769–2780 CrossRef CAS PubMed.
- T. Young, R. Abel, B. Kim, B. J. Berne and R. A. Friesner, Proc. Natl. Acad. Sci. U. S. A., 2007, 104, 808–813 CrossRef CAS PubMed.
- J. F. Truchon, A. Nicholl's, J. A. Grant, R. I. Iftimie, B. Roux and C. I. Bayly, J. Comput. Chem., 2010, 31, 811–824 CAS.
- J.-F. Truchon, B. M. Pettitt and P. Labute, J. Chem. Theory Comput., 2014, 10, 934–941 CrossRef CAS PubMed.
- S. Zhou, L. T. Cheng, J. Dzubiella, B. Li and J. A. McCammon, J. Chem. Theory Comput., 2014, 10, 1454–1467 CrossRef CAS PubMed.
- M. A. Brodney, G. Barreiro, K. Ogilvie, E. Hajos-Korcsok, J. Murray, F. Vajdos, C. Ambroise, C. Christoffersen, K. Fisher, L. Lanyon, J. Liu, C. E. Nolan, J. M. Withka, K. A. Borzilleri, I. Efremov, C. E. Oborski, A. Varghese and B. T. O'Neill, J. Med. Chem., 2012, 55, 9224–9239 CrossRef CAS PubMed.
- S. J. Irudayam and R. H. Henchman, Mol. Phys., 2011, 109, 37–48 CrossRef CAS.
- S. Irudayam, R. Plumb and R. Henchman, Faraday Discuss., 2010, 145, 467–485 RSC.
- R. Henchman, J. Chem. Phys., 2007, 126, 064504 CrossRef PubMed.
- S. J. Irudayam and R. H. Henchman, J. Phys.: Condens. Matter, 2010, 22, 284108 CrossRef PubMed.
- G. Gerogiokas, G. Calabro, R. H. Henchman, M. W. Y. Southey, R. J. Law and J. Michel, J. Chem. Theory Comput., 2014, 10, 35–48 CrossRef CAS.
- J. Michel, R. H. Henchman, G. Gerogiokas, M. W. Y. Southey, M. P. Mazanetz and R. J. Law, J. Chem. Theory Comput., 2014, 10, 4055–4068 CrossRef CAS.
- J. M. Chen, S. L. Xu, Z. Wawrzak, G. S. Basarab and D. B. Jordan, Biochemistry, 1998, 37, 17735–17744 CrossRef CAS.
- C. Liu, S. T. Wrobleski, J. Lin, G. Ahmed, A. Metzger, J. Wityak, K. M. Gillooly, D. J. Shuster, K. W. McIntyre, S. Pitt, D. R. Shen, R. F. Zhang, H. Zhang, A. M. Doweyko, D. Diller, I. Henderson, J. C. Barrish, J. H. Dodd, G. L. Schieven and K. Leftheris, J. Med. Chem., 2005, 48, 6261–6270 CrossRef CAS PubMed.
- A. Wissner, D. M. Berger, D. H. Boschelli, M. B. Floyd, L. M. Greenberger, B. C. Gruber, B. D. Johnson, N. Mamuya, R. Nilakantan, M. F. Reich, R. Shen, H. R. Tsou, E. Upeslacis, Y. F. Wang, B. Q. Wu, F. Ye and N. Zhang, J. Med. Chem., 2000, 43, 3244–3256 CrossRef CAS PubMed.
- J. Michel, J. Tirado-Rives and W. L. Jorgensen, J. Am. Chem. Soc., 2009, 131, 15403–15411 CrossRef CAS PubMed.
- O. Trott and A. J. Olson, J. Comput. Chem., 2010, 31, 455–461 CAS.
- D. Seeliger and B. L. de Groot, J. Comput.-Aided Mol. Des., 2010, 24, 417–422 CrossRef CAS PubMed.
- H. W. Horn, W. C. Swope, J. W. Pitera, J. D. Madura, T. J. Dick, G. L. Hura and T. Head-Gordon, J. Chem. Phys., 2004, 120, 9665–9678 CrossRef CAS PubMed.
- J. Wang, R. Wolf, J. Caldwell, P. Kollman and D. Case, J. Comput. Chem., 2004, 25, 1157–1174 CrossRef CAS PubMed.
- A. Jakalian, D. Jack and C. Bayly, J. Comput. Chem., 2002, 23, 1623–1641 CrossRef CAS PubMed.
- D. Case, T. A. Darden, T. E. Cheatham, C. Simmerling, J. Wang, R. Duke, R. Luo, M. Crowley, R. Walker, W. Zhang, K. M. Merz, B. Wang, S. Hayik, A. Roitberg, G. Seabra, I. Kolossváry, K. F. Wong, F. Paesani, J. Vanicek, X. Wu, S. Brozell, T. Steinbrecher, H. Gohlke, L. Yang, C. Tan, J. Mongan, V. Hornak, G. Cui, D. H. Mathews, M. G. Seetin, C. Sagui, V. Babin and P. Kollman, Amber 11, University of California, San Francisco, 2010 Search PubMed.
- H. Loeffler, C. J. Woods and J. Michel, FESetup 1.0, http://ccpforge.cse.rl.ac.uk/gf/project/ccpbiosim/ Search PubMed.
- (a) C. J. Woods and J. Michel, Sire Molecular Simulation Framework, Revision 1786, 2013, http://siremol.org/Sire/Home.html Search PubMed; (b) P. Eastman, M. S. Friedrichs, J. D. Chodera, R. J. Radmer, C. M. Bruns, J. P. Ku, K. A. Beauchamp, T. J. Lane, L.-P. Wang, D. Shukla, T. Tye, M. Houston, T. Stich, C. Klein, M. R. Shirts and V. S. Pande, J. Chem. Theory Comput., 2013, 9, 461–469 CrossRef CAS PubMed.
- I. Tironi, R. Sperb, P. Smith and W. van Gunsteren, J. Chem. Phys., 1995, 102, 5451–5459 CrossRef CAS PubMed.
- H. Andersen, J. Chem. Phys., 1980, 72, 2384–2393 CrossRef CAS PubMed.
- D. Alvarez-Garcia and X. Barril, J. Chem. Theory Comput., 2014, 10, 2608–2614 CrossRef CAS.
- S. J. Irudayam and R. H. Henchman, J. Phys. Chem. B, 2009, 113, 5871–5884 CrossRef CAS PubMed.
- L. R. Olano and S. W. Rick, J. Am. Chem. Soc., 2004, 126, 7991–8000 CrossRef CAS PubMed.
- U. Hensen, F. Gräter and R. H. Henchman, J. Chem. Theory Comput., 2014, 10, 4777–4781 CrossRef CAS.
- J. Michel and J. W. Essex, J. Comput.-Aided Mol. Des., 2010, 24, 639–658 CrossRef CAS PubMed.
Footnote |
| † Electronic supplementary information (ESI) available: Additional figures on convergence of computed GCT energetics. See DOI: 10.1039/c4cp05572a |
| This journal is © the Owner Societies 2015 |

