A simple one-pot synthesis of highly fluorescent nitrogen-doped graphene quantum dots for the detection of Cr(VI) in aqueous media†
Fei Caia,
Xidong Liub,
Shuang Liub,
Hong Liu*c and
Yuming Huang*a
aKey Laboratory of Luminescent and Real-Time Analytical Chemistry, Ministry of Education, College of Chemistry and Chemical Engineering, Southwest University, Chongqing 400715, P R China. E-mail: ymhuang@swu.edu.cn
bCollege of Materials and Chemical Engineering, Chongqing University of Arts and Sciences, Chongqing 402160, P R China
cChongqing Institute of Green and Intelligent Technology, Chinese Academy of Sciences, Chongqing 400714, P R China. E-mail: liuhong@cigit.ac.cn
First published on 8th October 2014
Abstract
A new method for selective determination of Cr(VI) in environmental water samples was developed based on its quenching effect on the fluorescent N-doping graphene quantum dots (N-GQDs). The N-GQDs were synthesized by a simple one-step method using citric acid as the carbon source and ammonia as the nitrogen source with a 65% yield, showing that mass production of the N-GQDs is possible. The obtained N-GQDs with oxygen-rich functional groups exhibited a strong blue emission with a quantum yield of 18.6%, which was 7 times greater than that of graphene quantum dots (GQDs). Due to the selective coordination to Cr(VI), the N-GQDs can be used as a green and facile sensing platform for label-free sensitive and selective detection of Cr(VI) ions in aqueous solution and real water samples. Compared to GQDs, the N-GQDs as a fluorescent probe promises much improved selectivity for sensing of Cr(VI). The N-GQDs fluorescence probe shows a sensitive response to Cr(VI) in a wide concentration range of 0–140 μM with a detection limit of 40 nM. The N-GQDs-based fluorescence method was successfully used to selectively detect Cr(VI), and discriminate it and Cr(III) as well in aqueous samples.
1. Introduction
Chromium is widely used in industrial processes like metal smelting, leather tanning, electroplating and dyestuff. All these processes caused the release of large amounts of chromium into natural water bodies, which would contaminate drinking water systems.1 In aqueous media, chromium exists mainly in two valence states: namely Cr(III) and Cr(VI). Cr(III) has a low toxicity and is an essential trace element for mammals. However, Cr(VI) is approximately 100 times more toxic than Cr(III) and is considered a human carcinogen with adverse impact on human health.1–3 Therefore, it is of particular interest to develop a sensitive method for selective determination of Cr(VI). Over the past decades, various techniques have been developed for selective determination of Cr(VI), including atomic absorption spectrophotometry, inductively coupled plasma-mass spectroscopy (ICP-MS) and X-ray fluorescence (XRF).2,4Graphene is a material of two-dimensional (2D) crystalline structure with interesting physical and chemical properties. It has great potential applications in electronic devices and molecule sensors.5a,b Also, it can be used as an ideal surface-enhanced Raman scattering-active substrate.5c The theoretical and experimental studies proved that the properties of graphene depend on its size, shape, geometry and chemical nature.6,7 Graphene nanosheets of less than 100 nm in size are known as graphene quantum dots (GQDs) and attracts particular interest owing to their excellent photoluminescence (PL) properties.5 Various strategies, including chemical ablation from graphene,8 electrochemical synthesis,9 oxygen plasma treatment,10 and solution chemistry methods11–13 have been proposed for the preparation of GQDs. However, the quantum yield (QY) of the as-synthesized GQDs is still usually low. For example, Dong et al. proposed a simple hydrothermal approach to synthesize a GQDs with QY of 9.0%.14 Fan et al. reported a chemical method to obtain the fluorescent GQDs with a QY of 5.5%.15 Zhuo et al. suggested a facile ultrasonic method to prepare GQDs with QY of 3.4%.16 Shen et al. proposed a facile hydrazine hydrate reduction of graphene oxide with PEG surface passivation strategy for the fabrication of GQDs with QY of 7.4%.17 Therefore, synthesis of GQDs with high quantum yield is still a challenge work for their wide applications.
Doping GQDs with heteroatoms can effectively tune their intrinsic properties, including optical characteristics, surface and local chemical features.5a Previous studies have reported that nitrogen-doping of GQDs (N-GQDs) is a relatively easy method for improving the photoluminescence quantum yield and the obtained N-GQDs promise excellent PL properties,17,18 effective electrocatalytic activity and strong electron-withdrawing ability.19–21 Nevertheless, most of the previously reported methods are in need of expensive equipments,19 time consuming procedures,20 or harsh reaction conditions such as high temperature or fields.22 Thus, a facile, low-cost and high-yield method for the preparation of N-GQDs with a strong fluorescence (FL) emission is highly expected.
Herein, we report a facile hydrothermal route to synthesize N-doped GQDs using citric acid (CA) as the carbon source and ammonia (NH3·H2O) as the nitrogen source. The obtained N-GQDs are highly blue-luminescent with a QY of 18.6%. It was observed that the blue emission of N-GQDs could be strongly quenched in the presence of Cr(VI), likely through the interaction between the –OH group and/or –NH group on the N-GQDs and the aqueous Cr(VI) anions.23 Some other common ions, including Fe3+, Ca2+, Ni2+, Cr3+, Cd2+, Cu2+, Pb2+, Zn2+, Mg2+, Mn2+, Al3+, Na+, K+, Au3+, Ba2+, Co2+, Hg2+, NO3−, Cl−, PO43−, IO4− and SO42− ions, have minor effects on the FL of N-GQDs. On this basis, a facile, green, sensitive, and selective chemosensor was developed for the detection of Cr(VI). The successful application of the N-GQDs to the detection of Cr(VI) ions in aqueous samples is also demonstrated. To the best of our knowledge, although graphene quantum dots have been widely used to detect metal ions, no attention has been paid to use of N-GQDs as a fluorescent sensing platform for label-free detection of Cr(VI).
2. Experimental section
2.1. Material and reagents
K2Cr2O7, ammonia, NaOH, HCl, H2SO4 and H3PO4 were purchased from Chongqing Taixin Chemical Co. Ltd. (Chongqing, China). Citric acid (CA) was obtained from Signopharm Chemical Reagent Co. Ltd. (Shanghai, China). All chemicals used in this work were of analytical grade and used as received without further purification. Ultra pure water was prepared in the lab. The solution pH was adjusted using diluted HCl and NaOH solutions. All glasswares were soaked in the diluted HNO3 and thoroughly cleaned before use.2.2. Synthesis of the fluorescent N-GQDs
2 g citric acid and 20 mL of ammonia were mixed into a 25 mL Teflon-lined stainless steel autoclave and heated at 200 °C for 10 h. After cooling down to room temperature, the obtained black liquid was added into 50 mL of water, and then the resulting solution was heated to 100 °C for 1 h to vaporize excess ammonia. The resulting N-GQDs solution was diluted to 250 mL with water (with concentration of 5.2 mg mL−1) and stored in the dark at room temperature. Note that the dry weight of the N-GQDs under this condition was 1.3 g, giving a 65% yield. Thus, one of the key advantages of this process is that mass production of the N-GQDs is possible.2.3. Instrumentation
The fluorescence spectrum and intensity were recorded on a Hitachi F-7000 spectrofluorometer (Kyoto, Japan). The UV-visible spectra were measured on a U-4100 spectrophotometer (Hitachi, Japan). Transmission electron microscopy (TEM) image was obtained on a LIBRA 200 electron microscope at 200 kV. Atomic force microscopy (AFM) images were collected on a Bruker Multimode 8 AFM/SPM (Bruker, Germany) system. X-ray photoelectron spectroscopy (XPS) characterizations were conducted by using a VG Multilab 2000X instrument (Thermal Electron, USA). Fourier transform infrared (FT-IR) spectra of the GQDs and N-GQDs were obtained using a Tenson 27 Fourier Transform Infrared spectrometer (Bruker, Germany).2.4. Quantum yield (QY) measurement
QY of N-GQDs was determined by using quinine sulfate as the standard sample and was calculated according to the following equation:
 | (1) |
2.5. General procedure for fluorescent detection
In a typical process, 100 μL of 5.2 mg mL−1 N-GQDs solution and 500 μL of 0.05 M phosphate buffer (pH 7.4) was added into a series of working standard Cr(VI) solution (with final concentration of 1–140 μM). The mixture was diluted to 10 mL with water, and then FL spectra measurements and photographs were carried out. The relative fluorescence intensity (F0 − F)/F0 versus Cr(VI) concentration were used for calibration. Here, F0 and F are the fluorescence intensities of N-GQDs in the absence and presence of Cr(VI), respectively.For Cr(VI) determination in real samples, samples were taken locally from lake water, river water, domestic sewage and industrial wastewater. Lake water sample was taken from Chongde Lake in the Southwest University. River water sample was collected from the Jialingjiang River in the upper reaches of the Three Gorges Reservoir area. The domestic sewage was from septic tank in the students' dormitory of Southwest University. The industrial wastewater was collected from the effluent of an electroplating factory. Prior to analysis, all samples were filtered through a 0.45 μm mixed fiber membrane. Due to very low level of Cr(VI) in the samples of lake water, river water and domestic sewage, 100 mL of the water samples was concentrated by evaporation to approximately 1 mL before analysis. For Cr(VI) analysis, 100 μL of 5.2 mg mL−1 N-GQDs solution and 500 μL of 0.05 M phosphate buffer (pH 7.4) was added into 1.00 mL of the selected water sample. The obtained mixture was treated by the same way as Cr(VI) standard. Ultrapure water diluted N-GQDs with final concentration of 52 mg L−1 was used as a control.
For total chromium detection in the lake water, river water sample, domestic wastewater and industrial wastewater, the sample was treated following the recommended procedures24 with minor modification. Briefly, 0.5 mL of sulfuric acid (1![[thin space (1/6-em)]](https://www.rsc.org/images/entities/char_2009.gif) :
:![[thin space (1/6-em)]](https://www.rsc.org/images/entities/char_2009.gif) 1) and 0.5 mL of phosphoric acid (1
1) and 0.5 mL of phosphoric acid (1![[thin space (1/6-em)]](https://www.rsc.org/images/entities/char_2009.gif) :
:![[thin space (1/6-em)]](https://www.rsc.org/images/entities/char_2009.gif) 1) were added into 50 mL of the neutralized industrial wastewater or 100 mL of the neutralized other water samples, followed by addition of a proper amount of 4% KMnO4. The mixture was heated to boiling until the volume of solution reduced by about 50%. After cooling to room temperature, 2 mL of urea (20%) was added in the mixture, then a proper NaNO2 (2%) was added until the purple solution disappeared. For the industrial wastewater, the resulting mixture was diluted to 50 mL with ultra pure water. Then 1 mL of the obtained solution was used for the analysis of total chromium. For the other water samples, the resulting mixture was evaporated to about 1 mL. Then 100 μL of 5.2 mg mL−1 N-GQDs solution and 500 μL of 0.05 M phosphate buffer (pH 7.4) was added into the pretreated water sample. The obtained mixture was treated by the same way as Cr(VI) standard.
1) were added into 50 mL of the neutralized industrial wastewater or 100 mL of the neutralized other water samples, followed by addition of a proper amount of 4% KMnO4. The mixture was heated to boiling until the volume of solution reduced by about 50%. After cooling to room temperature, 2 mL of urea (20%) was added in the mixture, then a proper NaNO2 (2%) was added until the purple solution disappeared. For the industrial wastewater, the resulting mixture was diluted to 50 mL with ultra pure water. Then 1 mL of the obtained solution was used for the analysis of total chromium. For the other water samples, the resulting mixture was evaporated to about 1 mL. Then 100 μL of 5.2 mg mL−1 N-GQDs solution and 500 μL of 0.05 M phosphate buffer (pH 7.4) was added into the pretreated water sample. The obtained mixture was treated by the same way as Cr(VI) standard.
3. Results and discussion
3.1. Physicochemical characterization of the N-GQDs
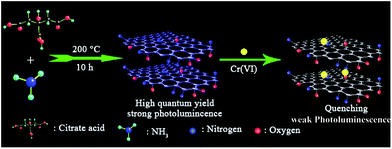
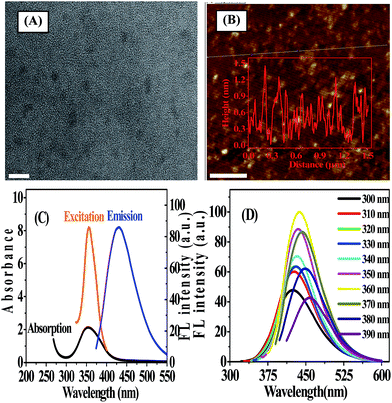
N-GQDs were prepared by a one-pot pyrolysis of CA as carbon source in the presence of ammonia as nitrogen source at 200 °C. As shown in Scheme 1, CA self-assembles into a nanosheet structure through intermolecular H-bonding at the initial stage of the reaction, and then the pure graphene core rich in various functional groups forms via the dehydration between the carboxyl and hydroxyl of the intermolecules.8,14 In addition to be nitrogen source as a nitrogen doping agent, ammonia also acts as a catalyst25 to speed up the intermolecule dehydration of CA during the hydrothermal process.The TEM image showed that the average size of the N-GQDs was 6.4 ± 0.3 nm (Fig. 1A). The AFM image (Fig. 1B) showed a typical topographic height of 0.5 to 1.2 nm (inset of Fig. 1B). Based on the fact that the theoretical thickness of a graphene layer was 0.34 nm, the AFM results indicated that most of the N-GQDs consist of 1–4 graphene layers, quite close to that of the previously reported GQDs with 1–5 graphene layers.19
To further explore the optical properties of the N-GQDs, UV-vis absorption and FL spectra were recorded. Fig. 1C illustrated a typical absorption peak at ca. 360 nm on the UV-vis absorption spectra of the N-GQDs, which was almost the same as that of the maximum excitation peak of N-GQDs. FL characterization indicated that the N-GQDs emitted strong blue FL under excitation at 365 nm by a UV lamp (Fig. S1 ESI†). The photograph showed that N-GQDs solution was pale-yellow, transparent and clear under daylight, while exhibited blue emission under UV irradiation by 365 nm. It was reported that isolated sp2-hybridized clusters with a size of ca. 6 nm within the carbon–oxygen matrix could yield band gaps consistent with blue emission due to the localization of electron–hole pairs,26 suggesting that both the size and surface effects played an important role in the blue emission from N-GQDs. As shown in Fig. 1D, N-GQDs exhibited an excitation-dependent FL behavior. As the excitation wavelength varied from 300 nm to 390 nm, the associated FL peak shifted from 424 nm to 456 nm. The most intense fluorescence from the N-GQDs appeared at 360 nm excitation and maximized at 430 nm. This excitation-dependent FL behavior was extensively reported in fluorescent carbon-based nanomaterials, and it might resulted from optical selection of differently sized GQDs and surface defects of GQDs. As the excitation wavelength increased, the emission peak shifted to longer wavelength while the intensity decreased sharply. It was assumed that the giant red-edge effect was responsible for the strong dependence of the FL peak position upon the wavelength of the excitation source.27 The QY of N-GQDs was determined to be 18.6% (using quinine sulfate as the reference, Table S1 ESI†), which was 7 times greater than that of GQDs. This implied that doping nitrogen to GQDs significantly enhanced the FL quantum yield of GQDs. In addition, the effect of different molar ratios of ammonia to CA on the PL emission of the as-prepared N-GQDs was investigated. The results showed that the PL intensity of the as-prepared N-GQDs was dependent on the molar amount of ammonia. When the molar amount of ammonia was more than that of CA, the products possessed stronger PL intensity. In contrast, when the molar amount of ammonia was zero or less than that of CA, PL emission weakened (Fig. S2, ESI†).
The as-synthesized N-GQDs were readily water-dispersible due to the presence of hydroxyl and carboxylic groups on the surface and edges, which was confirmed by FT-IR measurement (Fig. S3 ESI†). Clearly, both the GQDs and N-GODs exhibited absorption of carboxyl group and hydroxyl group. The absorption band at 3416 cm−1 was assigned to the OH and N–H stretching vibrations. The absorption band at about 1630 cm−1 belonged to C![[double bond, length as m-dash]](https://www.rsc.org/images/entities/char_e001.gif) O stretching vibration. The peak at 1400 cm−1 was assigned to C–N stretching vibrations.28 Compared with GQDs, the FT-IR spectrum of N-GQD showed the additional absorption peak from C–N stretching vibrations at 1400 cm−1, confirming the successful preparation of the N-GQDs.
O stretching vibration. The peak at 1400 cm−1 was assigned to C–N stretching vibrations.28 Compared with GQDs, the FT-IR spectrum of N-GQD showed the additional absorption peak from C–N stretching vibrations at 1400 cm−1, confirming the successful preparation of the N-GQDs.
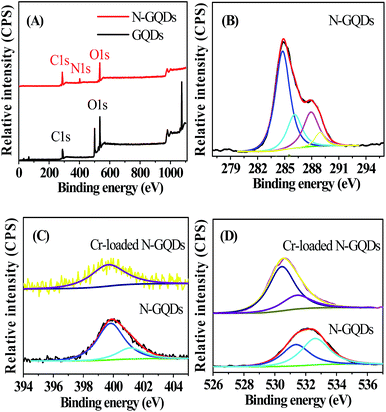
XPS survey spectra indicated that GQDs involved the core levels of C1s and O1s (Fig. 2A), while the full range XPS analysis showed the presence of C, N and O in the N-GQDs sample (Fig. 2A). The corresponding C1s, N1s and O1s peaks centered at 284 eV, 400 eV and 532 eV, respectively (Fig. 2B–D). This confirmed the successful nitrogen doping of GQDs by the one-pot pyrolysis reaction in the presence of ammonia. The high-resolution C 1s spectrum of N-GQDs (Fig. 2B) indicated that there were four peaks at 284.6, 286.0, 288 and 289 eV, corresponding to C![[double bond, length as m-dash]](https://www.rsc.org/images/entities/char_e001.gif) C/C–C in graphene, C–N(O), C
C/C–C in graphene, C–N(O), C![[double bond, length as m-dash]](https://www.rsc.org/images/entities/char_e001.gif) O and O–C
O and O–C![[double bond, length as m-dash]](https://www.rsc.org/images/entities/char_e001.gif) O groups,19,28 respectively. As shown in Fig. 2C, there were two peaks at 400 and 401.8 eV in the N 1s spectrum, which were attributed to the pyrrole-like N (C–N–C) and graphitic N or N–H bands, respectively. The O 1s spectrum of N-GQDs presented two peaks, which were assigned to C
O groups,19,28 respectively. As shown in Fig. 2C, there were two peaks at 400 and 401.8 eV in the N 1s spectrum, which were attributed to the pyrrole-like N (C–N–C) and graphitic N or N–H bands, respectively. The O 1s spectrum of N-GQDs presented two peaks, which were assigned to C![[double bond, length as m-dash]](https://www.rsc.org/images/entities/char_e001.gif) O or O–C
O or O–C![[double bond, length as m-dash]](https://www.rsc.org/images/entities/char_e001.gif) O at 531.5 eV and N–C
O at 531.5 eV and N–C![[double bond, length as m-dash]](https://www.rsc.org/images/entities/char_e001.gif) O at 532.7 eV (Fig. 2D), indicating the as-prepared N-GQDs were rich in hydroxyl, carbonyl and carboxylic acid groups on the surfaces,9,19 which was in line with the result shown in FT-IR spectra (Fig. S3 ESI†).
O at 532.7 eV (Fig. 2D), indicating the as-prepared N-GQDs were rich in hydroxyl, carbonyl and carboxylic acid groups on the surfaces,9,19 which was in line with the result shown in FT-IR spectra (Fig. S3 ESI†).
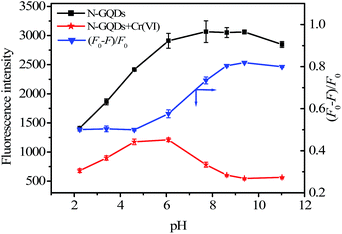
The as-prepared N-GQDs solution remains homogeneous even after 3 months storage at room temperature without any perceptible changes (e.g. aggregation or color change), which could be further confirmed by the almost unchanged FL spectra (Fig. S4 ESI†). Interesting, the as-prepared N-GQDs are very stable, and the FL intensity shows almost no change even though they were dispersed in an aqueous solution with an ionic strength of 1.0 M NaCl (Fig. S5 ESI†), indicating that the N-GQDs could resist comparatively high ionic strength and not aggregate in high salt medium. Result in Fig. 3 indicated that the FL intensity of the N-GQDs significantly enhanced with the increase of pH from 2 to 8, and smoothly in 8 to 10. When pH > 10, the FL intensity the N-GQDs decreased. In addition, different buffer systems had almost no effect on the FL response of the N-GQDs (Fig. S6 ESI†).
3.2. Fluorescence response of the N-GQDs to Cr(VI)
The N-GQDs in the PBS buffer (50 mM, pH 7.4) displayed intense blue FL (Fig. 3 and S1 ESI†), which could be fastly quenched in the presence of Cr(VI). For example, upon addition of Cr(VI), the strong blue emission of the N-GQDs solution decreased by over 70% at pH ≥ 7.4 (Fig. 3). This suggested the highly effective quenching effect of Cr(VI) on the FL emission of N-GQDs. The possible sensing mechanism could be understood that parts of Cr(VI) were reduced to Cr(III) on the surface of N-GQDs, leading to the quenching of the N-GQDs emission. To confirm this, first, the variation of the concentrations of Cr(VI) and Cr(III) in solution after reaction between Cr(VI) and N-GQDs as a function of the initial solution pH was investigated. The results suggest that chromium has a valence change, and the reduction from Cr(VI) to Cr(III) occurs in the presence of N-GQDs (Fig. S7 ESI†). This suggests that Cr(VI) reduction to Cr(III) reaction occurred in the presence of N-GQDs. Second, XPS was used to characterize the surface states of N-GQDs after contact with Cr(VI). The binding energies at 577.5 eV and 587.1 eV assigned to Cr 2p3/2 and Cr 2p1/2 orbital's, respectively. The fact that the binding energy of the Cr 2p3/2 locates at 577.5 eV (Fig. 4) confirms that the adsorbed Cr is in Cr(III) form, implying that chemical reduction of Cr(VI) occurred.29 From Fig. 2D, after Cr(VI) addition, the significant shift of binding energy peak was observed in the O 1s spectrum of the N-GQDs. This result suggested that the –OH groups were likely involved in the reduction of Cr(VI) ion. Also, the intensity of N peak at about 400 eV was reduced with a weak shift to 399.5 eV in the N 1s spectrum of the N-GQDs (Fig. 2C). This indicated that nitrogen in the N-GQDs was probably involved in the reduction of Cr(VI) to produce Cr(III). Therefore, a simple fluorescent assay for Cr(VI) could be designed and established through the monitoring of the N-GQDs–Cr(VI) solution fluorescence (Scheme 1).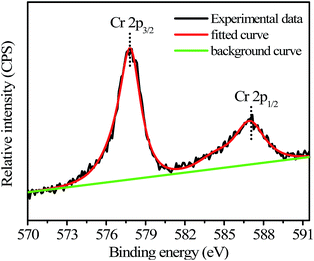 | ||
| Fig. 4 Cr 2p XPS spectrum of the N-GQDs after reaction with Cr(VI) (initial Cr(VI) concentration: 2.5 mM; initial N-GQDs concentration: 5.2 mg mL−1; solution pH = 7.4). | ||
Based on the Cr(VI)-induced quenching of the N-GQDs, the capability of the N-GQDs to allow the highly sensitive and selective detection of Cr(VI) was investigated. To obtain the optimal analytical conditions for the proposed method, we explored the effect of pH in the range of 2–11 on the FL intensities of the N-GQDs in the absence and presence of Cr(VI) and the kinetic behavior of the reaction. As shown in Fig. 3, in the absence of Cr(VI), the FL intensity of the N-GQDs kept almost stable over a wide pH range from 6 to 11. However, the quenched FL intensity of the N-GQDs was pH-dependent in the presence of Cr(VI). In an acidic media (pH ≤ 4.5), the quenching efficiencies decreased with pH from 2 to 4.5, then remained stable from 4.5 to 6.0, and then increased with pH from 6.0 to 11.0 (Fig. 3). Finally, the neutral phosphate buffer (pH 7.4) was chosen for the sensitive detection of Cr(VI) due to its physiological relevance. The kinetic behavior of reactions between the N-GQDs and Cr(VI) was investigated by monitoring the FL intensity as a function of time. It was clear that the quenching equilibrium reached in less than 3 min (Fig. S8 ESI†), showing fast interaction between the N-GQDs and Cr(VI). The FL signal remained almost constant with increasing reaction time to 30 min. Hence, 5 min was selected as reaction time in the subsequent experiments. Finally, the effect of the N-GQDs concentration was investigated over the range of 13–520 mg L−1 (Fig. S9 ESI†). It was found that the maximal FL quenching of the N-GQDs was obtained at 52 mg L−1 N-GQDs, above which it decreased. Finally, 52 mg L−1 of the N-GQDs was chosen.
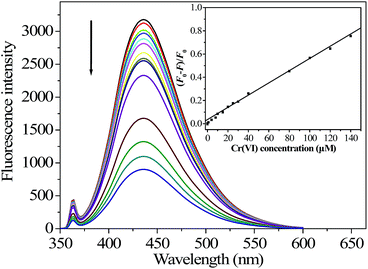
Under the optimized conditions, a quantitative analysis of Cr(VI) was performed to test the sensitivity. As indicated in Fig. 5, the FL intensity of N-GQDs decreased monotonically with increasing Cr(VI) concentration from 0 to 140 μM, verifying the validity of the FL assay for detection of Cr(VI). A significant linear correlation existed between the value of (F0 − F)/F0 at 430 nm and the Cr(VI) concentrations in the range of 0 to 140 μM, giving a calibration curve (inset in Fig. 5) with a linear regression equation of (F0 − F)/F0 = 5.2 × 10⁻³ cCr(VI) (μM) + 0.03 (correlation coefficient r2 = 0.9937, n = 14). The detection limit with a signal-to-noise ratio (S/N) of 3 for Cr(VI) calibration was 40 nM, which was about 24-fold lower than the maximum level (0.96 μM) of total chromium in drinking water permitted by the WHO.30
To test the selectivity of the developed method for Cr(VI), the influence of various environmentally relevant metal ions and anions were tested, including Fe3+, Ca2+, Ni2+, Cr3+, Cd2+, Cu2+, Pb2+, Zn2+, Mg2+, Mn2+, Al3+, Na+, K+, Au3+, Ba2+, Co2+, Hg2+, NO3−, Cl−, PO43−, IO4− and SO42− ions. The results demonstrated that all the tested cations and anions caused minor FL variation of the N-GQDs, demonstrating that the proposed method was highly selective for Cr(VI) over the other ions (Fig. 6). It should be indicated that as compared to GQDs, the N-GQDs as a fluorescent probe promises much improved selectivity for sensing of Cr(VI) (Fig. S10 ESI†). The high selectivity of N-GQDs for Cr(VI) could be due to the fact that the Cr(VI) ion had a higher binding affinity and faster chelating kinetics with N and O functional groups of N-GQDs than other transition-metal ions. Also, the effects of some organic compounds on FL response of N-GQDs were evaluated. The tested organic compounds included humic acid, volatile fatty acids (including acetic acid, propionic acid, n-butyric acid, isobutyric acid, and valeric acid), phenols, and 2,4-dinitrophenol because these substances were detected in wastewater or natural aqueous water samples. The concentration levels of these substances were selected according to published works (Table S2 ESI†). As can be seen from Table S2,† the effects of the tested organic substances on FL response of N-GQDs were negligible. Thus they did not interference with Cr(VI) determination. Finally, the effects of some polymers, including polypyrrole and chitosan, on FL response of N-GQDs were evaluated. The result indicated that the FL of N-GQDs was quenched in the presence of the tested polymers (Table S2 ESI†). A similar phenomenon was also found by Ramanavicius et al. who reported that polypyrrole as a polymer could quench the photoluminescence of (CdSe)ZnS quantum dots.31
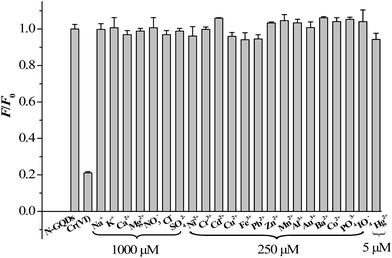 | ||
| Fig. 6 Relative fluorescence intensities (F/F0 at 430 nm) of the N-GQDs solution after addition of 140 μM Cr(VI) and various other ions at 5 to 1000 μM. | ||
3.3. Application of the proposed sensor for speciation of chromium in water samples
The applicability of the proposed method for detecting chromium ions in real water samples was further evaluated. Because of high selectivity of N-GQDs to Cr(VI), the proposed sensor can be used to discriminate Cr(VI) and Cr(III). The water samples included wastewater, river water and lake water samples. The results were shown in Table 1. Also the results were compared with those by the standard colorimetric method. As can be seen from Table 1, the results obtained by the proposed method agreed well with those obtained by the standard colorimetric method, confirming the validity of the N-GQDs-based FL sensing method for the detection of toxic Cr(VI) in real samples. Most importantly, it was easy to realize simultaneous determination of Cr(VI) and Cr(III) by a simple oxidation process of the real sample solution, showing great potential of the proposed method for the routine estimation of Cr(VI) and Cr(III) in water samples.| Sample | Proposed method (μg mL−1) | Spectrometric method (μg mL−1) | ||
|---|---|---|---|---|
| a Average of three measurements (mean ± SD, n = 3). | ||||
| Cr(VI)a | Cr(III)a | Cr(VI)a | Cr(III)a | |
| Wastewater | 30.9 ± 0.27 | 18.0 ± 0.25 | 31.7 ± 0.02 | 18.3 ± 0.02 |
| Lake water | 0.033 ± 0.002 | 0.062 ± 0.003 | 0.029 ± 0.002 | 0.053 ± 0.001 |
| Jialing river | 0.053 ± 0.007 | 0.084 ± 0.007 | 0.047 ± 0.003 | 0.078 ± 0.001 |
| Domestic sewage | 0.032 ± 0.005 | 0.109 ± 0.016 | 0.032 ± 0.001 | 0.098 ± 0.002 |
4. Conclusion
In this work, a simple one-pot hydrothermal method for the preparation of N-doped graphene quantum dots was developed. For this, citric acid and ammonia were used as the carbon source and the nitrogen source, respectively. The process gave a 65% yield of the N-GQDs. The as-synthesized N-GQDs exhibited a strong blue emission with a quantum yield of 18.6%. It was demonstrated the N-GQDs-based sensing method for Cr(VI) ions detection in water had improved selectivity and high sensitivity. In terms of the XPS analysis, the sensing mechanism could be understood that parts of Cr(VI) were reduced to Cr(III) on the surface of N-GQDs, leading to the quenching of the N-GQDs emission. In the assay, a good linearity between the fluorescence response and Cr(VI) concentration within a range from 0 to 140 μM was obtained, with a detection limit of 40 nm. The developed method was successfully used for Cr(VI) ion determination in practical application. In addition, because of high selectivity of N-GQDs to Cr(VI), the proposed sensor could be used to discriminate Cr(VI) and Cr(III). It was easy to realize simultaneous determination of Cr(VI) and Cr(III) by a simple oxidation process of the real sample solution, indicating the great potential of the proposed method for the routine estimation of Cr(VI) and Cr(III) in water samples.Acknowledgements
The financial support by the Natural Science Foundation of China (no. 21277111 and 51378494), the National College Students' innovation and entrepreneurship training program (no. 201310642001), and One Hundred Talents Program (Chinese Academy of Sciences) are acknowledged.References
- V. Gomez and M. Callao, TrAC, Trends Anal. Chem., 2006, 25, 1006–1015 CrossRef CAS PubMed.
- R. Rakhunde, L. Deshpande and H. Juneja, Crit. Rev. Environ. Sci. Technol., 2012, 42, 776–810 CrossRef CAS.
- J. Kotaś and Z. Stasicka, Environ. Pollut., 2000, 107, 263–283 CrossRef.
- M. Gochfeld, Environ. Health Perspect., 1991, 92, 41–43 CrossRef CAS.
- (a) L. Zhang, Z.-Y. Zhang, R.-P. Liang, Y.-H. Li and J.-D. Qiu, Anal. Chem., 2014, 86, 4423–4430 CrossRef CAS PubMed; (b) Q. Mei, C. Jiang, G. Guan, K. Zhang, B. Liu, R. Liu and Z. Zhang, Chem. Commun., 2012, 48, 7468–7470 RSC; (c) L. Zhang, C. Jiang and Z. Zhang, Nanoscale, 2013, 5, 3773–3779 RSC.
- D. Wei, Y. Liu, Y. Wang, H. Zhang, L. Huang and G. Yu, Nano Lett., 2009, 9, 1752–1758 CrossRef CAS PubMed.
- P. Blake, P. D. Brimicombe, R. R. Nair, T. J. Booth, D. Jiang, F. Schedin, L. A. Ponomarenko, S. V. Morozov, H. F. Gleeson and E. W. Hill, Nano Lett., 2008, 8, 1704–1708 CrossRef PubMed.
- D. Pan, J. Zhang, Z. Li and M. Wu, Adv. Mater., 2010, 22, 734–738 CrossRef CAS PubMed.
- Y. Li, Y. Hu, Y. Zhao, G. Shi, L. Deng, Y. Hou and L. Qu, Adv. Mater., 2011, 23, 776–780 CrossRef CAS PubMed.
- T. Gokus, R. Nair, A. Bonetti, M. Bohmler, A. Lombardo, K. Novoselov, A. Geim, A. Ferrari and A. Hartschuh, ACS Nano, 2009, 3, 3963–3968 CrossRef CAS PubMed.
- S. Yang, X. Feng, X. Wang and K. Müllen, Angew. Chem., Int. Ed., 2011, 50, 5339–5343 CrossRef CAS PubMed.
- I. P. Hamilton, B. Li, X. Yan and L. Li, Nano Lett., 2011, 11, 1524–1529 CrossRef CAS PubMed.
- Q. Li, S. Zhang, L. Dai and L. Li, J. Am. Chem. Soc., 2012, 134, 18932–18935 CrossRef CAS PubMed.
- Y. Dong, J. Shao, C. Chen, H. Li, R. Wang, Y. Chi, X. Lin and G. Chen, Carbon, 2012, 50, 4738–4743 CrossRef CAS PubMed.
- L. Fan, Y. Hu, X. Wang, L. Zhang, F. Li, D. Han, Z. Li, Q. Zhang, Z. Wang and L. Niu, Talanta, 2012, 101, 192–197 CrossRef CAS PubMed.
- S. Zhuo, M. Shao and S.-T. Lee, ACS Nano, 2012, 6, 1059–1064 CrossRef CAS PubMed.
- J. Shen, Y. Zhu, C. Chen, X. Yang and C. Li, Chem. Commun., 2011, 47, 2580–2582 RSC.
- S. Liu, J. Tian, L. Wang, Y. Zhang, X. Qin, Y. Luo, A. M. Asiri, A. O. Al-Youbi and X. Sun, Adv. Mater., 2012, 24, 2037–2041 CrossRef CAS PubMed.
- Y. Li, Y. Zhao, H. Cheng, Y. Hu, G. Shi, L. Dai and L. Qu, J. Am. Chem. Soc., 2011, 134, 15–18 CrossRef PubMed.
- Q. Liu, B. Guo, Z. Rao, B. Zhang and J. R. Gong, Nano Lett., 2013, 13, 2436–2441 CrossRef CAS PubMed.
- Y. Dong, H. Pang, H. B. Yang, C. Guo, J. Shao, Y. Chi, C. M. Li and T. Yu, Angew. Chem., Int. Ed., 2013, 52, 7800–7804 CrossRef CAS PubMed.
- H. Liu, Y. Liu and D. Zhu, J. Mater. Chem., 2011, 21, 3335–3345 RSC.
- S. Vallejos, A. Muñoz, F. C. García, F. Serna, S. Ibeas and J. M. García, J. Hazard. Mater., 2012, 227, 480–483 CrossRef PubMed.
- State Environmental Protection Administration, The editorial board of water and wastewater monitoring and analysis methods, water and wastewater monitoring and analysis methods, 4th edn, Beijing, China, 2002, pp. 346–349 Search PubMed.
- L. Tang, R. Ji, X. Li, G. Bai, C. P. Liu, J. Hao, J. Lin, H. Jiang, K. S. Teng, Z. Yang and S. P. Lau, ACS Nano, 2014, 8, 6312–6320 CrossRef CAS PubMed.
- H. Sun, N. Gao, L. Wu, J. Ren, W. Wei and X. Qu, Chem.–Eur. J., 2013, 19, 13362–13368 CrossRef CAS PubMed.
- S. K. Cushing, M. Li, F. Huang and N. Wu, ACS Nano, 2013, 8, 1002–1013 CrossRef PubMed.
- Z. Wu, M. Gao, T. Wang, X. Wan, L. Zheng and C. Huang, Nanoscale, 2014, 6, 3868–3874 RSC.
- (a) I. Kim, H. A. Hosein, D. R. Strongin and T. Douglas, Chem. Mater., 2002, 14, 4874–4879 CrossRef CAS; (b) X. Guo, G. T. Fei, H. Su and L. D. Zhang, J. Phys. Chem. C, 2011, 115, 1608–1613 CrossRef CAS.
- WHO, Guidelines for Drinking-Water Quality, World Health Organization, 4th edn, Geneva, Switzerland, 2011 Search PubMed.
- A. Ramanavicius, V. Karabanovas, A. Ramanaviciene and R. Rotomskis, J. Nanosci. Nanotechnol., 2009, 9, 1909–1915 CrossRef CAS PubMed.
Footnote |
| † Electronic supplementary information (ESI) available: Supporting tables and figures. See DOI: 10.1039/c4ra09320h |
| This journal is © The Royal Society of Chemistry 2014 |

