DOI:
10.1039/C4JA00059E
(Technical Note)
J. Anal. At. Spectrom., 2014,
29, 1299-1305
Comparison of signal enhancement by co-existing carbon and by co-existing bromine in inductively coupled plasma mass spectrometry
Received
13th February 2014
, Accepted 10th April 2014
First published on 10th April 2014
Abstract
In inductively coupled plasma (ICP) mass spectrometry, signal enhancement by co-existing carbon results from multiple factors. To elucidate the signal enhancement factors, we compared the effects of co-existing carbon and co-existing bromine, which have similar ionization energies (C, 11.26 eV; Br, 11.81 eV). We eliminated the effect of sample introduction efficiency changes, which are considered to be one reason for signal enhancement, by using two nebulizers. The intensities of the P, I, S, As, Se and B signals were enhanced when a multi-element solution was introduced into the ICP from one nebulizer and a carbon solution was introduced from the other. No signal enhancement was observed by co-existing bromine. We focused on the bond energies of the oxides as a possible explanation for the difference between the results for carbon and bromine. Carbon oxide has a higher bond energy than bromine oxide, and therefore carbon reduces analyte oxides more readily than bromine does. We also considered the effects of the bond energies of the analyte oxides, as well as the effects of the degree of analyte ionization in the ICP, on signal enhancement. Signal enhancement was observed for analytes that were less than 60% ionized in the ICP and whose oxide bond energies exceeded 450 kJ mol−1. Iodine was an exception; signal enhancement was observed for I (ionization degree, 29.85%), even though the bond energy of iodine oxide is only 240 kJ mol−1. Therefore, charge transfer could not be eliminated as a cause of signal enhancement.
1 Introduction
In inductively coupled plasma mass spectrometry (ICP-MS), signal enhancement by co-existing carbon has been reported by several research groups.1–9 In particular, enhancements of the signals for P, S, As and Se, which have first-ionization energies of 9–11 eV, have been observed.10–12 The enhancement is generally accepted as being due to charge transfer (CT) between the analyte atom (M) and positively charged carbon ions or carbon–H ions (C+-species) in the matrix:13,14| | | C+-species + M → C-species + M+ | (1) |
CT is possible only when the ionization energy of the analyte is similar to that of C (11.26 eV) or CH (10.64 eV). However, signal enhancement cannot be explained by eqn (1) alone. One reason is that signal enhancement has been observed not only in ICP-MS but also in ICP optical emission spectrometry (OES).15–18 In ICP-MS analyte ions are observed and in ICP-OES the emission of analyte atoms is observed. If CT affects the ionization degree of analytes and decreases analyte atoms, the signal of ICP-OES should be suppressed. Moreover, the effects of co-existing carbon on the sample nebulization efficiency, optimal carrier gas flow rate and plasma temperature have also been suggested as causes of signal enhancement or suppression.1,19–22
In this study, to investigate the cause of signal enhancement due to co-existing carbon, we compared the signal enhancement effects on analyte signals by co-existing bromine (ionization energy, 11.81 eV) and by co-existing carbon (ionization energy, 11.26 eV). Specifically, a carbon- or bromine-containing sample solution and a multi-element solution were introduced into the ICP-MS separately via concentric and ultrasonic nebulizers, respectively, and the resulting aerosols were merged upstream of the plasma torch. This sample introduction system eliminates changes in the aerosol size produced by a nebulizer as a reason for signal enhancement effects. To elucidate the enhancement mechanism, we also considered the relative bond energies of analyte oxides, carbon oxide and bromine oxide, as well as the degree of ionization of the analytes in the ICP.
2 Experimental
2.1 Reagents and samples
Ultrapure water with a resistivity >18.2 MΩ cm was obtained from a Milli-Q system (Millipore, Tokyo, Japan) and used throughout this work for preparation of all solutions. A stock solution containing carbon at a concentration of 10 mg mL−1 was prepared by dissolving urea (CO(NH2)2, Kanto Chemical Co., Inc., Tokyo, Japan) in ultrapure water. For pH effects on signal enhancement, oxalic acid dihydrate ((COOH)2·2H2O, Kanto Chemical Co., Inc.) was used. A stock solution containing bromine at 10 mg mL−1 was prepared by dissolving ammonium bromide (NH4Br, Sigma Aldrich, USA) in ultrapure water. From these stock solutions, 0, 100, 500, 1000, 1500, 2000, 3000 and 4000 μg mL−1 sample solutions of carbon and bromine were prepared by diluting with ultrapure water.
A multi-element solution was prepared from 1 mg mL−1 Be, P, Cu, Zn, As, Se, Cd, Sb, I, W, Pt and Au standards (chemical analysis grade, Kanto Chemical Co., Inc., Tokyo, Japan) and 1 mg mL−1 B, S and Te standards (SPEX CertiPrep Inc., USA). The concentrations of the elements in the multi-element solution were as follows: 0.1 μg mL−1 Cu and B and 0.5 μg mL−1 Be, P, S, Zn, As, Se, Cd, Sb, Te, I, W, Pt and Au.
RbBr (Wako Pure Chemical Industries, Osaka, Japan) and CsI (Kanto Chemical Co., Inc.) were used for measuring the plasma temperature. RbBr and CsI were dissolved in the carbon and bromine sample solutions so that the Br and I concentrations were 0.1 μg mL−1 and 0.1 μg mL−1, respectively.
2.2 ICP-MS
ICP-MS measurements were performed with an HP4500 spectrometer (Agilent Technologies, Tokyo, Japan). The instrumental operating parameters are listed in Table 1, and a schematic diagram of the analytical system is shown in Fig. 1. One hundred microliters of a sample solution of carbon or bromine was injected into a Scott-type spray chamber via a flow injection system. Ultrapure water or the multi-element solution was introduced into an ultrasonic nebulizer (U-6000AT+, CETAC Technologies, Omaha, USA) coupled with a desolvation system (membrane desolvator, CETAC Technologies, Omaha, USA) by means of a peristaltic pump (Minipuls 3, Gilson, France) at a sample uptake rate of 0.5 mL min−1. Aerosols from the spray chamber and the ultrasonic nebulizer were merged and then introduced into the ICP-MS.
Table 1 ICP-MS operating conditions
| Agilent HP4500 ICP-MS |
| Rf power |
1400 W |
| Coolant gas flow rate |
15.0 L min−1 |
| Auxiliary gas flow rate |
1.0 L min−1 |
| Carrier gas flow rate (concentric nebulizer) |
0.65 L min−1 |
| Sample uptake rate (concentric nebulizer) |
0.5 mL min−1 |
| Carrier gas flow rate (ultrasonic nebulizer) |
0.60 L min−1 |
| Sample uptake rate (ultrasonic nebulizer) |
0.5 mL min−1 |
| Chamber |
Scott type |
| Sampling cone |
Orifice diameter 1 mm Ni |
| Skimmer cone |
Orifice diameter 0.4 mm Ni |
| Sampling depth |
7.5 mm from top of the load coil |
| Dwell time per isotope |
0.1 s |
| Isotopes measured |
9Be, 11B, 40Ar12C, 31P, 34S, 65Cu, 66Zn, 75As, 77Se or 82Se, 79Br, 81Br1H, 85Rb, 111Cd, 121Sb, 125Te, 127I, 133Cs, 182W, 195Pt, 197Au |
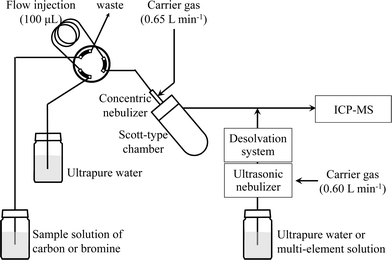 |
| | Fig. 1 Schematic diagram of the sample introduction system. | |
2.3 Calculation of signal enhancement ratios
To determine the signal enhancements due to co-existing carbon, we introduced ultrapure water or a sample solution of carbon into the ICP by means of the concentric nebulizer while the multi-element solution was introduced into the ICP by means of the ultrasonic nebulizer. The intensities of the 9Be, 11B, 40Ar12C, 31P, 34S, 65Cu, 66Zn, 75As, 77Se, 81Br1H, 111Cd, 121Sb, 125Te, 127I, 182W, 195Pt and 197Au signals were measured in time-resolved analysis mode. Signal enhancement ratios were calculated by dividing the area of each analyte peak in the presence of carbon by the area in the presence of ultrapure water.
2.4 Measurement of the plasma ionization temperature
For determination of the plasma ionization temperature (Ti), a carbon sample solution containing RbBr or a bromine sample solution containing CsI was introduced into the ICP-MS by means of the flow injection system. The ratio of the intensities of the Br+ and Rb+ signals and the ratios of the intensities of the I+ and Cs+ signals were used to calculate Ti from eqn (2):| |  | (2) |
where α is the ionization degree; ni, na and ne are the number densities (m−3) of ions, atoms and electrons, respectively; m is the mass of the electron (kg); k is the Boltzmann constant (J K−1); h is the Planck constant (K s), Zi and Za are the ion and atom partition functions; and Ei is the ionization energy (J).23,24 In this equation, Br+/Rb+ and I+/Cs+ can be substituted for α in Chapter 3.4. For ne a typical number density of 1.0 × 1015 cm−3 was used.25
3 Results and discussion
3.1 Effects of co-existing carbon on analyte signals
Two typical signal intensity profiles are shown in Fig. 2 for an experiment in which the multi-element solution was continuously introduced into the ICP via an ultrasonic nebulizer, so that the analyte signals were observed continuously during the measurement. A sample solution of carbon was also introduced into the ICP via a concentric nebulizer, and the carbon and analyte signals were simultaneously observed in time-resolved analysis mode. The intensity of the Cu signal was constant even when the sample solution of carbon was introduced into the ICP (Fig. 2a); that is, the Cu signal was not enhanced by co-existing carbon. In contrast, the As signal was enhanced by co-existing carbon (Fig. 2b). The signal enhancement ratios of B, P, S, As, Se and I as a function of carbon concentration are shown in Fig. 3. Signal enhancement was observed for B, P, S, As, Se and I, and the magnitude of the enhancement increased with increasing carbon concentration. The signal enhancement ratios of B, P, S, As, Se and I at a carbon concentration of 4000 μg mL−1 were 116 ± 6, 119 ± 2, 113 ± 6, 132 ± 6, 137 ± 4 and 144 ± 5%, respectively. Because in this study the sample introduction efficiency was the same with and without carbon, we attributed the signal enhancements to CT, the relative bond energies of the analyte and carbon oxides and a change in the plasma temperature. The ionization energies of B, P, S, As, Se and I, the elements for which signal enhancements were observed, are 8.29, 10.48, 10.36, 9.81, 9.75 and 10.45 eV, respectively. It has been reported that CT occurs when the difference between the ionization energy of C (11.26 eV) or CH (10.64 eV) and that of the analyte is less than 2 eV.26 Because the differences in the ionization energy between B and C and between B and CH exceed 2 eV, we assumed that CT was not responsible for the signal enhancement observed for B.
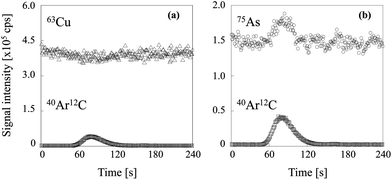 |
| | Fig. 2 Signal intensity profiles of (a) 63Cu and (b) 75As when the sample solution of carbon was introduced. | |
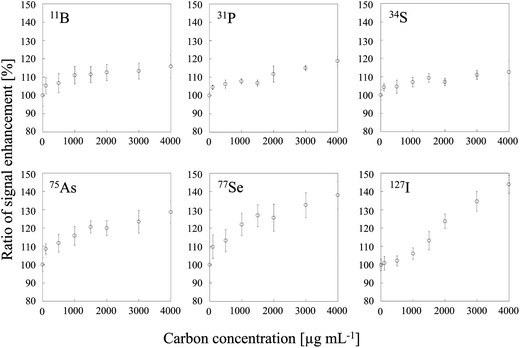 |
| | Fig. 3 Dependence of signal enhancement ratios of 11B, 31P, 34S, 75As, 77Se and 127I on the carbon concentration. Error bars indicate standard deviation (n = 3). | |
3.2 Effect of co-existing bromine on analyte signals
To examine the influence of CT, we conducted signal enhancement experiments with sample solutions of bromine, which has an ionization energy similar to that of carbon and should therefore result in signal enhancement in the same way that carbon does. We found that no signal enhancement was observed for B, P, S, As, Se and I at any of the tested bromine concentration (Fig. 4). The signal enhancement ratios at a bromine concentration of 4000 μg mL−1 were 99 ± 2, 100 ± 2, 101 ± 2, 101 ± 2, 101 ± 3 and 100 ± 2%, respectively. Therefore, some difference between carbon and bromine must be invoked to explain their different effects on the signal intensity. One possibility is the difference between the bond energies of the oxides of carbon and bromine, which differ substantially (1076 and 235 kJ mol−1, respectively).27
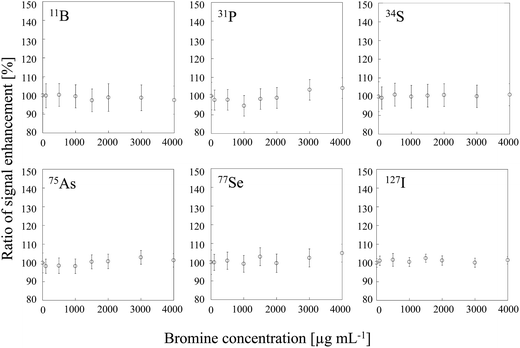 |
| | Fig. 4 Dependence of signal enhancement ratios of 11B, 31P, 34S, 75As, 77Se and 127I on the bromine concentration. Error bars indicate standard deviation (n = 3). | |
3.3 Effects of bond energies of analyte, carbon and bromine oxides
As stated above, signal enhancements due to co-existing carbon have been attributed to CT, as shown in eqn (1). As illustrated in Fig. 5, the CT mechanism is believed to involve transfer of the energy of C+-species to the analyte atoms in the plasma, which results in an increase in the ionization degree (α) of the analyte atoms. In addition, because the bond energy of carbon oxide is high relative to the bond energies of the analyte oxides, the analyte oxides are reduced in the plasma, and C is oxidized. This process increases the atomization ratio (β) of the analyte oxides, thus increasing the number of analyte atoms and enhancing their signals. In contrast, bromine oxide has a low bond energy and thus has difficulty in reducing the analyte oxides. Therefore, no signal enhancement due to co-existing bromine is observed. The bond energy of boron oxide is quite high (809 kJ mol−1), and thus B exists as its oxide, which is reported to be reduced by the introduction of carbon.14 Boron oxide is reduced in the ICP while C is oxidized, and thus signal enhancement by co-existing carbon is observed, even though CT is unlikely (owing to the large difference in the ionization energy between B and carbon species).
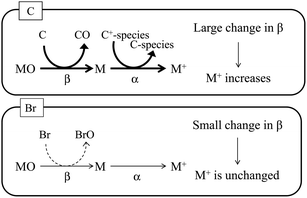 |
| | Fig. 5 Schematic diagram of signal enhancement by co-existing carbon. Positively charged carbon species (C+-species) react with the analyte atom (M), and the degree of ionization (α) of the analyte increases. Carbon is oxidized by the analyte oxide (MO), and the analyte oxide is reduced to the analyte atom. This process increases the atomization ratio (β) of the analyte oxide. In contrast, bromine is not oxidized by the analyte oxide. | |
To determine the quantities of analyte oxides, we analyzed a 1 μg mL−1 multi-element solution by ICP-MS and calculated oxide production ratios using eqn (3):
| | | Oxide production ratio [%] = MO+/M+ | (3) |
where MO
+ is the analyte oxide ion count, and M
+ is the analyte ion count. It was assumed that the ionization energies of MO and M are the same. The bond energies of selected analyte oxides
27 and the theoretical values of their ionization degrees
25 in the ICP are listed in
Table 2, along with the experimentally observed oxide production ratios. The oxide production ratio of B (4.219%) was the highest ratio observed for any of the analytes we tested. When we plotted the oxide production ratios of these nine elements as a function of the bond energies of the corresponding oxides (
Fig. 6), a linear relationship was observed, with tungsten oxide as an outlier. The bond energy of tungsten oxide is 832 kJ mol
−1, which is close to that of boron oxide. However, because almost all W (93.64%) was ionized in the plasma, the oxide production ratio of W was substantially lower than that of B, despite the similar oxide bond energies of the two elements.
Table 2 Oxide production ratios, ionization energies, analyte oxide (MO) bond energies and ionization degrees in the ICP of all measured analytes
|
|
Element |
Oxide production ratio [%] |
Ionization energy [eV] |
Bond energy of MO [kJ mol−1] |
Degree of ionization in ICP [%] |
|
These are not measured.
|
| Enhanced |
P |
0.423 |
10.48 |
589 |
33.11 |
| I |
—a |
10.45 |
240 |
29.85 |
| S |
0.311 |
10.36 |
517 |
14.33 |
| As |
0.042 |
9.81 |
484 |
51.64 |
| Se |
0.047 |
9.75 |
469 |
33.32 |
| B |
4.219 |
8.29 |
809 |
58.06 |
| Not enhanced |
Zn |
—a |
9.39 |
226 |
75.33 |
| Be |
0.068 |
9.32 |
437 |
74.98 |
| Au |
—a |
9.12 |
223 |
50.74 |
| Te |
0.009 |
9.01 |
377 |
66.38 |
| Pt |
—a |
9.00 |
391 |
62.43 |
| Cd |
—a |
8.99 |
236 |
85.03 |
| Sb |
0.023 |
8.46 |
434 |
79.98 |
| W |
0.121 |
7.98 |
832 |
93.64 |
| Cu |
—a |
7.73 |
280 |
89.25 |
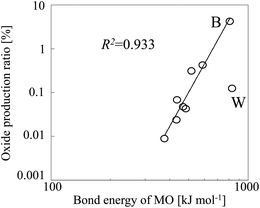 |
| | Fig. 6 Oxide production ratio as a function of analyte oxide (MO) bond energy. | |
3.4 Plasma temperature
We also used a sample solution of carbon or bromine containing RbBr or CsI, respectively, to measure the plasma temperature. The ionization energies of Rb and Cs are 4.18 and 3.89 eV, respectively, and Rb and Cs are completely ionized in the plasma. In contrast, the ionization energies of Br and I are 11.81 and 10.45 eV, respectively; thus only portions of Br and I are ionized in the plasma. Additionally, the second ionization energies of Rb, Br, Cs and I are higher than the ionization energy of Ar (16.7 eV). Therefore, doubly charged Rb, Br, Cs and I ions are produced to a very limited extent. Consequently, the Br+/Rb+ and I+/Cs+ ratios can be substituted for the ionization degree (α) in eqn (2). To measure the plasma temperature, we used a RbBr solution for the sample solution of carbon, because the I signal is enhanced by co-existing carbon.9,28 The signals of 85Rb, 79Br, 133Cs and 127I were used to calculate the plasma temperature from eqn (2). The plasma temperature decreased with increasing carbon and bromine concentrations (Fig. 7); the 4000 μg mL−1 sample solutions of carbon and bromine reduced the plasma temperature from 6860 ± 15 to 6751 ± 4 K and from 6990 ± 10 to 6927 ± 4 K, respectively. The ionization degree can be expected to decrease with decreasing the plasma temperature. For example, the ionization degree of As is influenced from 24% to 21% in the case of carbon and from 18% to 15% in the case of bromine. The decrease of ionization would decrease rather than enhance the signal intensity.
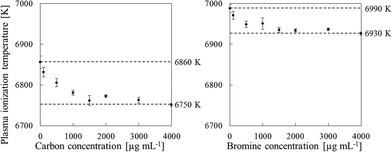 |
| | Fig. 7 Effect of the carbon and bromine concentration on the plasma ionization temperature, as measured by using sample solutions containing RbBr (C) and CsI (Br). Error bars indicate standard deviation (n=3). | |
3.5 Mechanism of the signal enhancement
Table 2 summarizes the ionization energies, analyte oxide bond energies27 and ionization degrees25 of all of the analytes evaluated in this study. The intensities of the P, I, S, As, Se and B signals were enhanced by co-existing carbon, whereas no signal enhancement was observed for Zn, Be, Au, Te, Pt, Cd, Sb, W and Cu. Our results suggest that signal enhancement due to co-existing carbon can be observed for elements whose ionization degrees were less than 60% and whose MO bond energies were higher than 450 kJ mol−1. Iodine was an exception. We suggest that the mechanism of the signal enhancement was reduction of the analyte oxides by carbon. Iodine oxide has a low bond energy (240 kJ mol−1), but the ionization energy of I (10.45 eV) is close to that of CH (10.64 eV) and that of C (11.26 eV). Therefore, we attributed the enhancement of the I signal to a CT reaction with C+-species. The signal enhancement due to co-existing carbon has been reported to increase with increasing nitric acid concentration.6 We also confirmed the signal enhancement increase with decreasing pH as shown in Fig. 8. Therefore, it was found that the signal intensity of I is enhanced more effectively by CH+ than by C+. As the C+-species in CT reactions shown in eqn (1), CH+ involved to enhance the signal more effectively than C+ did. We considered that the effect of CT could not be eliminated, because enhancement of the I signal by co-existing carbon was observed. Consequently, we concluded that both reduction of analyte oxides by carbon and CT were the main causes of signal enhancement due to co-existing carbon.
 |
| | Fig. 8 Signal enhancement ratios of 75As, 82Se and 31P as a function of carbon concentration for different pH values: (□) pH 2; (△) pH 4; (◊) pH 6; and (○) pH 8. Error bars indicate standard deviation (n = 3). Oxalic acid was used for a carbon source and pH adjustment was conducted by adding HNO3 or NH4OH. | |
4 Conclusion
In this study, we compared the signal enhancement effects of co-existing carbon and co-existing bromine. We found that co-existing bromine did not enhance the signals of any of the tested analytes, even though its ionization energy is similar to that of carbon. To explain this finding, we focused on the bond energies of carbon and bromine oxides. Carbon oxide has a high bond energy. Therefore, we suggest that the signal enhancement effects of carbon were due to oxidation of carbon by the analyte oxides, which were in turn reduced to the corresponding analyte atoms; this process resulted in an increase in the atomization ratio (β) of the analyte oxides. However, signal enhancement was observed for I, even though the bond energy of iodine oxide is less than 450 kJ mol−1. We suggest that the reason for this is that the ionization energy of I (10.45 eV) is close to that of CH (10.64 eV) and therefore that CT from CH+ to I occurred readily. Our results indicate that CT cannot be eliminated as an explanation for signal enhancement by co-existing carbon. We suggest that both reduction of analyte oxides and CT contribute to the signal enhancement effects of co-existing carbon. In summary, we found that signal enhancements were observed for analytes that were less than 60% ionized in the ICP and whose analyte oxide bond energies were higher than 450 kJ mol−1.
Acknowledgements
The authors would like to express thanks to Dr Naoki Sugiyama of Agilent Technologies for his instrumental support.
References
- Z. Hu, S. Hu, S. Gao, Y. Liu and S. Lin, Spectrochim. Acta, Part B, 2004, 59, 1463 CrossRef PubMed.
- M. Kovačevič and W. Goessler, Spectrochim. Acta, Part B, 2005, 60, 1357 CrossRef PubMed.
- Z. Hu, S. Gao, S. Hu, Y. Liu and H. Chen, Chin. Chem. Lett., 2007, 18, 1297 CrossRef CAS PubMed.
- G. H. Floor, M. Iglesias and G. Roman-Ross, J. Anal. At. Spectrom., 2009, 24, 944 RSC.
- A. M. Featherstone, A. T. Townsend, G. A. Jacobson and G. M. Peterson, Anal. Chim. Acta, 2004, 512, 319 CrossRef CAS PubMed.
- Z. Hu, S. Gao, S. Hu, H. Yuan, X. Liu and Y. Liu, J. Anal. At. Spectrom., 2005, 20, 1263 RSC.
- B. Gammelgaard and O. Jøns, J. Anal. At. Spectrom., 1999, 14, 867 RSC.
- F. R. Abou-Shakra, M. P. Rayman, N. I. Ward, V. Hotton and G. Bastian, J. Anal. At. Spectrom., 1997, 12, 429 RSC.
- E. H. Larsen and S. Stürup, J. Anal. At. Spectrom., 1994, 9, 1099 RSC.
- M. Kovačevič, W. Goessler, N. Mikac and M. Veber, Anal. Bioanal. Chem., 2005, 383, 145 CrossRef PubMed.
- D. Profrock and A. Prange, J. Chromatogr. A, 2009, 1216, 6706 CrossRef PubMed.
- S. Kakui, N. Shimotsuma, T. Kyotani, K. Sawamura, K. Yamaguchi, S. Ikeda and T. Nakane, Bunseki Kagaku, 2007, 56, 587 CrossRef CAS.
- M. Pettine, B. Casentini, D. Mastroianni and S. Capri, Anal. Chim. Acta, 2007, 599, 191 CrossRef CAS PubMed.
- D. Fliegel, C. Frei, G. Fontaine, Z. Hu, S. Gao and D. Günther, Analyst, 2011, 136, 4925 RSC.
- P. Qiu, C. Ai, L. Lin, J. Wu and F. Ye, Microchem. J., 2007, 87, 1 CrossRef CAS PubMed.
- G. Grindlay, L. Gras, J. Mora and M. T. C. de Loos-Vollebregt, Spectrochim. Acta, Part B, 2008, 63, 234 CrossRef PubMed.
- J. Machat, V. Otruba and V. Kanicky, J. Anal. At. Spectrom., 2002, 17, 1096 RSC.
- J. Machat, V. Kanicky and V. Otruba, Anal. Bioanal. Chem., 2002, 372, 576 CrossRef CAS PubMed.
- E. G. Yanes and N. J. Miller-Ihli, Spectrochim. Acta, Part B, 2005, 60, 555 CrossRef PubMed.
- J. S. de Gois, T. A. Maranhão, F. J. S. Oliveira, V. L. A. Frescura, A. J. Curtius and D. L. G. Borges, Spectrochim. Acta, Part B, 2012, 77, 35 CrossRef CAS PubMed.
- A. W. Boorn, M. S. Cresser and R. F. Browner, Spectrochim. Acta, Part B, 1980, 35, 823 CrossRef.
- J. Q. Xu, D. Balik and G. R. Agnes, J. Anal. At. Spectrom., 2001, 16, 715 RSC.
- D. A. Wilson, G. H. Vickers and G. M. Hieftje, Appl. Spectrosc., 1987, 41, 875 CrossRef CAS.
- L. De Galan, R. Smith and J. D. Winefordner, Spectrochim. Acta, Part B, 1968, 23, 521 CrossRef CAS.
- R. S. Houk, Anal. Chem., 1986, 58, 97A CrossRef CAS.
- J. M. Green and C. E. Webb, J. Phys. B: At. Mol. Phys., 1974, 7, 1698 CrossRef CAS.
-
Y. R. Luo and J. A. Kerr, in CRC Handbook of Chemistry and Physics, ed. D. R. Lide, Taylor & Francis, New York, 86th edn, 2005, ch. 9, pp. 54–59 Search PubMed.
- E. H. Larsen and M. B. Ludwigsen, J. Anal. At. Spectrom., 1997, 12, 435 RSC.
|
| This journal is © The Royal Society of Chemistry 2014 |
Click here to see how this site uses Cookies. View our privacy policy here.  Open Access Article


