 Open Access Article
Creative Commons Attribution 3.0 Unported Licence
Towards the elucidation of the high oxygen electroreduction activity of PtxY: surface science and electrochemical studies of Y/Pt(111)
T. P.
Johansson
,
E. T.
Ulrikkeholm
,
P.
Hernandez-Fernandez
,
M.
Escudero-Escribano
,
P.
Malacrida
,
I. E. L.
Stephens
* and
I.
Chorkendorff
*
Center for Individual Nanoparticle Functionality, Department of Physics, Technical University of Denmark, Building 312, DK-2800 Lyngby, Denmark. E-mail: ifan.stephens@fysik.dtu.dk; ibchork@fysik.dtu.dk
First published on 11th April 2014
Abstract
We have prepared an yttrium modified Pt(111) single crystal under ultra-high vacuum conditions, simulating a bulk alloy. A Pt overlayer is formed upon annealing the crystal above 800 K. The annealed structure binds CO weaker than Pt(111), with a pronounced peak at 295 K in the temperature programmed desorption of CO. When depositing a large amount of yttrium at 1173 K, a (1.88 × 1.88)R30° structure relative to Pt(111) was observed by low energy electron diffraction. Such an electron diffraction pattern could correspond to a (2 × 2)R30° structure under 6% compressive strain. This structure is in agreement with the structure of the vacancies in a Pt Kagomé layer in Pt5Y rotated 30° with respect to the bulk of the Pt(111). The Pt overlayer is relatively stable in air; however, after performing oxygen reduction activity measurements in an electrochemical cell, a thick Pt overlayer was measured by the angle resolved X-ray photoelectron spectroscopy depth profile. The activity of the annealed Y/Pt(111) for the oxygen reduction reaction was similar to that of polycrystalline Pt3Y.
Introduction
Global energy demand is continuously increasing.1 With limited oil and gas supplies it is desirable to establish an energy economy based on renewable energy.2 For energy storage much focus has lately been on storing energy in the form of fuels. This could e.g. be in the form of alcohols produced from reduction of CO2,3,4 ammonia from the reduction of nitrogen5 or hydrogen from the electrolysis of water.6 Much attention has recently been put on hydrogen.7 One of the most promising technologies for utilising the energy stored in hydrogen is the low temperature polymer electrolyte membrane fuel cell (PEMFC). The commercialization of such devices is still hampered by their high cost, which is in part due to the expensive catalysts. In a PEMFC, catalysts are needed for both the hydrogen oxidation (HOR) and the oxygen reduction reactions (ORR). Expensive Pt-based catalysts are typically used for both reactions. However, due to the slow kinetics of oxygen reduction almost ten times more Pt is required on the cathode compared to the anode of the PEMFC.8 In order for PEMFCs to become viable, improvements in the catalytic activity of the ORR catalyst are still needed.9–17The conditions at the cathode in a PEMFC are extremely corrosive and, therefore, stability issues limit the choice of catalyst materials. The ORR is a complex reaction involving the transfer of 4 protons and 4 electrons.18 Although pure Pt nanoparticles are typically used for the ORR, the most active catalysts are those formed by a Pt overlayer on Pt bimetallic alloys.10,19 The oxygen reduction activity of Pt alloys has been studied extensively both on model catalysts (e.g. bulk polycrystalline and single crystal surfaces) and on the industrially more relevant nanoparticles, nanostructured thin films and nanoparticle networks.14,20–24 The increased ORR activity measured on some Pt alloy catalysts is caused by the alloy modifying the Pt overlayer in such a way that ORR intermediates are bound slightly weaker than on pure Pt. The optimal ORR catalyst should bind the ORR intermediates HO* and HOO* ∼0.1 eV weaker than pure Pt.10,25–27 This decrease in binding energy of ORR intermediates can be influenced by two effects, strain effects and ligand effects.26,28–32 Strain effects are related to the lateral strain of the Pt overlayer, e.g. originating from the Pt overlayer being supported on a material with a different lattice parameter. The binding energy of the intermediates on the Pt overlayer is decreased for compressive strain and increased for tensile strain. The ligand effect is related to the modification of the electronic structure of the Pt surface atoms by subsurface atoms of different atomic numbers. Solute atoms must be present in close proximity of the Pt surface atoms in order for the ligand effect to be noticed.10
The surface of Pt3M (M = Ni, Co, Fe, Ti, V) alloys will, under ORR reaction conditions, be terminated by a Pt overlayer.21 When the overlayer is produced by acid leaching the so-called Pt skeleton structure is produced.21 The skeleton surface on Pt3M (M = Ni, Co, Fe, Ti, V) alloys is not very well defined, but is reported to consist of 100% Pt in the first layer and a minimum of 75% Pt in the consecutive layers.21 Markovic and coworkers20,21,33 found that when annealing bulk Pt3M (M = Ni, Co, Fe) alloys under ultra-high vacuum (UHV) conditions, platinum atoms from the second layer exchange place with the solute atoms in the surface layer. This leads to a structure with 100% platinum in the first layer, 50% platinum in the second layer and (roughly) 75% platinum in the following layers. Such a structure is denoted as a Pt skin structure.21
The above mentioned alloys are not particularly stable during oxygen reduction14–16 and we therefore made an investigation to find alloys which have a high heat of formation for alloying while at the same time potentially being active for the ORR. In this manner we recently reported Pt3Y and Pt3Sc as promising ORR catalyst materials, based on measurements performed on acid leached polycrystalline bulk alloys.27 The Pt overlayer was formed by acid leaching and found to be similar to the Pt skeleton surfaces reported by Markovic and coworkers.21,27,34 Notably, on Pt3Y it was much thicker than we originally anticipated, suggesting that the origin of the activity was somewhat different to our original expectations.
In a recent paper we investigated the possible Pt skin formation on a bulk polycrystalline alloy of Pt3Sc when annealing it under UHV.35 An overlayer was demonstrated to be formed, but after testing the ORR activity in an acid electrolyte, a 1–2 monolayer Pt overlayer developed. For both polycrystalline Pt3Y and polycrystalline Pt5Y no overlayer formation was observed when annealing under UHV conditions.36
In the literature, deposition of some rare earth metals under UHV on Pt(111) has been studied, namely La, Ce and Tm.37–43 Tang et al.,37 Baddeley et al.38 and Essen et al.43 all studied the growth of thin Ce films on Pt(111) and found that after heat treatment to 770 K, ordered Ce–Pt compounds were formed. Depending on the initial Ce coverage, the following structures, with respect to Pt(111), were observed: (1.96 × 1.96), (1.94 × 1.94) with small satellites around the main spots and (1.96 × 1.96)R30°. The satellites had a real space periodicity of 10.2 compared to Pt(111). All of these structures were found to be based on the growth of crystalline Pt5Ce, which is a hexagonal layer structure consisting of alternating layers of Pt2Ce and the so called Kagomé nets of Pt atoms. The Kagomé net is formed from corner sharing hexagons of close-packed Pt atoms with a missing atom in the center of each set of six Pt atoms.38,43 Raaen and coworkers measured the desorption temperature of CO for both Ce, La and Tm on Pt(111).39–42 For all these three systems a downshift on the order of 120 K in desorption temperature of CO was observed, in comparison to Pt(111).
In this paper we use a similar approach to the above mentioned for preparing a Pt overlayer on a Pt–Y sample. We study the structure, reactivity and ORR activity of Y deposited on a Pt(111) single crystal. By investigating a single crystal alloy surface, with a well-defined structure and composition, we gain fundamental insight into the reactivity of PtxY.20,26,44–48
Experimental
UHV setup
The main part of the experiments in this paper was performed in a UHV chamber with a base pressure of 1 × 10⁻¹⁰ mbar, as described earlier.35,49 The sample, a Pt(111) single crystal 5 mm in diameter and 3 mm thick, was supplied by MaTecK, GmbH, Germany. The sample is held by a “U shaped” 0.38 mm tungsten wire and the temperature is measured using a type K thermocouple which is placed in a hole of the crystal (parallel to the crystal surface). The sample is heated by applying a DC voltage over the tungsten wire and cooled by either pressurised air or liquid nitrogen.For evaporation of yttrium a thermal yttrium evaporator was constructed and mounted on the chamber. The yttrium evaporator was made by cutting yttrium flakes from a 0.15 mm 99.9% yttrium foil (supplied by Goodfellow) and attaching them to a coil shaped 0.25 mm 99.95% tungsten wire. By applying a voltage on the tungsten wire it was possible to thermally evaporate yttrium. A quartz crystal microbalance (QCM) is mounted in the chamber, enabling deposition rates to be monitored before and after deposition on the sample. The QCM is positioned in the line of sight of the Y evaporator.36
The chamber is equipped with different surface science techniques to investigate the properties of the sample surface. Ion scattering spectroscopy (ISS) is performed using He+ ions, and an acceleration voltage of 1.2 kV. X-ray photoelectron spectroscopy (XPS) utilizes the Al Kα anode (1486.7 eV) of a dual anode X-ray gun. A quadrupole mass spectrometer is used for temperature programmed desorption (TPD) measurements of CO. Saturating the sample is done by dosing 100 Langmuir CO and the heat ramp used is 2 K s−1. The ordering of the surface region can be investigated using low energy electron diffraction (LEED). A high pressure cell (HPC) is attached to the main chamber, enabling high pressure dosing of gases.
Depth profile measurements are performed in a separate UHV chamber by angle resolved X-ray photoelectron spectroscopy (ARXPS). The ARXPS setup is described elsewhere.34,35
Electrochemical setup
The electrochemical experiments were performed using a Bio-Logic Instruments' VMP2 potentiostat, controlled by a computer. A standard three-compartment glass cell equipped with an external jacket attached to a water bath with temperature control was used for the experiments. All glassware was cleaned in 96% H2SO4 and 30% H2O2 (3![[thin space (1/6-em)]](https://www.rsc.org/images/entities/char_2009.gif) :
:![[thin space (1/6-em)]](https://www.rsc.org/images/entities/char_2009.gif) 1 v/v). This was subsequently rinsed several times in hot Millipore water (358 K, >18.2 MΩ cm−1, TOC < 5 ppb). The electrolyte, 0.1 M HClO4 (Merck, Suprapur), was prepared using Millipore water. The counter electrode was a platinum wire and the reference electrode was a Hg/Hg2SO4 electrode separated from the working electrode compartment using a ceramic frit. The measurements were conducted at 333 ± 1 K. All potentials in the manuscript are quoted with respect to the RHE and corrected for Ohmic losses. Following each measurement, 0 V vs. RHE was established by carrying out the hydrogen oxidation and hydrogen evolution reaction in the same electrolyte. The Ohmic resistance was evaluated by performing an impedance spectrum with a peak-to-peak amplitude of 10 mV, at frequencies from 1 kHz to 500 kHz; its value was typically ca. 20 Ω.
1 v/v). This was subsequently rinsed several times in hot Millipore water (358 K, >18.2 MΩ cm−1, TOC < 5 ppb). The electrolyte, 0.1 M HClO4 (Merck, Suprapur), was prepared using Millipore water. The counter electrode was a platinum wire and the reference electrode was a Hg/Hg2SO4 electrode separated from the working electrode compartment using a ceramic frit. The measurements were conducted at 333 ± 1 K. All potentials in the manuscript are quoted with respect to the RHE and corrected for Ohmic losses. Following each measurement, 0 V vs. RHE was established by carrying out the hydrogen oxidation and hydrogen evolution reaction in the same electrolyte. The Ohmic resistance was evaluated by performing an impedance spectrum with a peak-to-peak amplitude of 10 mV, at frequencies from 1 kHz to 500 kHz; its value was typically ca. 20 Ω.
The annealed Y/Pt(111) catalysts prepared under UHV conditions were inserted into the arbor of a rotating ring disk electrode (RRDE) and were immersed into the electrochemical cell under potential control at 0.05 V in a N2 (N5, Air Products) saturated 0.1 M HClO4 electrolyte. The potential was then constantly cycled between 0.05 V and 1.0 V at 50 mV s−1 and 20 mV s−1 until a stable cyclic voltammogram was recorded. Afterwards, the ORR activity was measured by cycling the potential between 0 V and 1 V at 50 and 20 mV s−1 and 1600 rpm in an O2 (N55, AGA) saturated electrolyte. The kinetic current density for the oxygen reduction, jk, has been calculated using the following equation, 1/j = 1/jk + 1/jd, where j is the measured current density and jd is the diffusion limited current density.
Results
We first investigated whether it is at all possible to make a Pt overlayer on a Pt–Y alloy by deposition of Y on Pt(111). 3 Å of yttrium is deposited on the Pt(111) crystal and the surface segregation is studied as a function of temperature.The Pt(111) crystal was sputter cleaned, annealed and then kept at 317 K while evaporating 3 Å of Y on to the crystal. Fig. 1 shows the ISS spectrum before and after Y evaporation. Both an Y and a Pt peak are observed in the ISS spectrum after Y deposition. Table 1 shows the concentrations obtained from XPS. The near surface region mainly consists of Pt and Y, while small amounts of C and O were also observed.
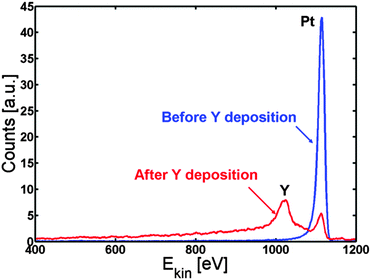 | ||
| Fig. 1 ISS spectrum of Pt(111) before (blue) and after (red) deposition of Y. According to the QCM measurements, around 3 Å of Y was deposited. | ||
| Pt | Y | C | O | |
|---|---|---|---|---|
| After Y dep. | 81 | 11 | 4 | 4 |
| After Y dep. and annealing | 92 | 6 | 1 | 1 |
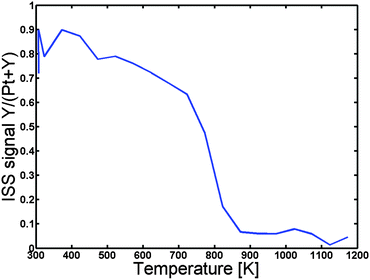
In order to establish at what temperature we can achieve inter-diffusion the sample was then heated under UHV at a rate of 2 K s−1 in steps of 50 K, and ISS spectra were acquired for each 50 K. Fig. 2 depicts the Y to “Pt + Y” ratio as a function of the temperature. Evidently, the Y to “Pt + Y” ratio exhibits a rapid decrease, corresponding to the formation of a Pt overlayer, at a temperature of around 800 K. The sample was annealed to a maximum temperature of 1173 K and then cooled down to 673 K, where detailed XPS spectra were obtained. The near surface concentration as measured by XPS is given in Table 1.
We have now established that a Pt overlayer is formed upon annealing Y/Pt(111) above 800 K. However, in order to simulate a bulk PtxY alloy, we will prepare a much thicker alloy layer.
The Pt(111) sample was cleaned by argon sputtering and annealed to 1273 K. The temperature of the sample was then kept at 1173 K while 90 ± 10 Å (measured on the QCM) of Y was deposited on top of the sample. Evaporating at this elevated temperature ensures that the Y immediately goes to the subsurface and is protected from oxidation by the Pt overlayer. Fig. 3 shows the ISS spectrum before (blue line) and after (red line) Y evaporation. Only Pt was observed in both spectra.
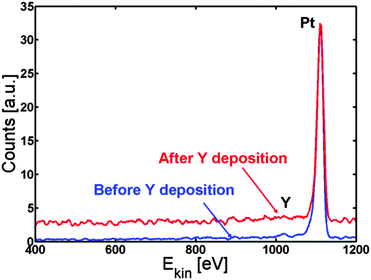 | ||
| Fig. 3 ISS spectrum before (blue) and after (red) Y deposition. Only Pt is observed, indicating the formation of a Pt skin. | ||
Table 2 shows the relative concentrations obtained by XPS after Y evaporation. A Pt![[thin space (1/6-em)]](https://www.rsc.org/images/entities/char_2009.gif) :
:![[thin space (1/6-em)]](https://www.rsc.org/images/entities/char_2009.gif) Y ratio of 4.8 was found, proving that Y is present in the near surface region. Furthermore, the relative concentration of C and O was at the limit of detection. Therefore, the deposition at a higher temperature hinders the formation of yttrium oxide. Combining the results from ISS and XPS gives that the sample consists of a Pt overlayer on top of some Pt–Y system. Assuming the structure to be a single monolayer of Pt on top of a PtxY alloy, x was calculated to be 3.7.36,50
Y ratio of 4.8 was found, proving that Y is present in the near surface region. Furthermore, the relative concentration of C and O was at the limit of detection. Therefore, the deposition at a higher temperature hinders the formation of yttrium oxide. Combining the results from ISS and XPS gives that the sample consists of a Pt overlayer on top of some Pt–Y system. Assuming the structure to be a single monolayer of Pt on top of a PtxY alloy, x was calculated to be 3.7.36,50
| Annealed at 1173 K | Annealed at 1348 K | |
|---|---|---|
| Pt | 81% | 87% |
| Y | 17% | 12% |
| C | 1% | 0% |
| O | 1% | 1% |
Pt![[thin space (1/6-em)]](https://www.rsc.org/images/entities/char_2009.gif) : :![[thin space (1/6-em)]](https://www.rsc.org/images/entities/char_2009.gif) Y ratio Y ratio |
4.8 | 7.3 |
| X assuming Pt/PtxY | 3.7 | 5.7 |
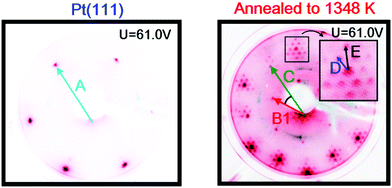
Images of the LEED patterns obtained before (left image) and after (right image) Y deposition and annealing are shown in Fig. 4. The LEED pattern after deposition at 1173 K consists of a large hexagon together with a smaller one. Some of the LEED images displayed weak superspots, too low in intensity to enable the analysis of them. The ratio B1/C was measured to be 1.72 ± 0.02, which is close to √3, and the angle between B1 and C was 30°. Combining vectors B1 and B2 therefore gives vector C, meaning that the larger hexagon can be constructed from the smaller hexagon. The ratio A/B1 was 1.88 ± 0.02 and the angle between A and B1 was 30°. Therefore, the annealed Y/Pt(111) showed a (1.88 × 1.88)R30° structure relative to pure Pt(111). Such a structure could correspond to a (2 × 2)R30° structure where the lattice is under 6% compressive strain, or a (√3 × √3)R30° structure where the lattice is under 9% tensile strain. These possibilities will be considered further in the Discussion section.
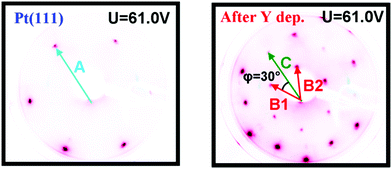 | ||
| Fig. 4 Images of the LEED patterns of Pt(111) (left, T = 316 K) and of Y/Pt(111) annealed to 1173 K (right, T = 373 K). | ||
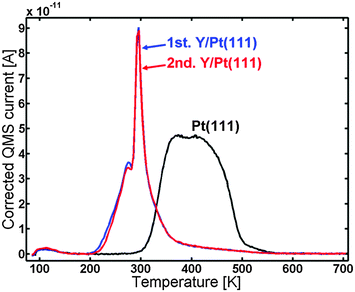
100 Langmuir CO was now dosed in order to saturate the surface of the annealed Y/Pt(111). The blue line in Fig. 5 shows the CO TPD spectrum of the sample. It is observed that the CO is bound weaker than for Pt(111), with a pronounced sharp peak at around 295 K and a smaller peak at around 275 K. The red line corresponds to the second (repeated) CO TPD of the same sample which was made in order to check the reproducibility. The first and the second TPDs are almost identical.
After the CO TPD experiments, XPS measurements were again carried out, showing the same relative concentrations of Pt, Y, C and O as before, indicating that the surface was stable to the CO TPD.
Since the samples will later be exposed to air it is interesting to evaluate their performance in an oxygen atmosphere. This was tested by dosing 200 mbar O2 in the HPC for 10 min at 300 K. After oxygen exposure, XPS showed 11% of oxygen on the surface; however, the yttrium 3d peak did not show any oxide feature. A TPD was consequently performed to test if the oxygen would preferably desorb or form yttrium oxide. The temperature was ramped linearly at 2 K s−1 from 304 K to 1173 K. Hardly any oxygen was observed in the TPD, which could indicate the formation of yttrium oxide during the temperature ramp. XPS measurements (not shown here) were performed at 1173 K after the CO TPD and showed 5% oxygen. Furthermore, the yttrium 3d region displayed some oxidised feature indicating that yttrium oxide was formed. A CO TPD was also performed and it showed roughly the same features as before oxygen exposure; however, the area under the TPD was 35% smaller. Thus the exposure to air did not cause any oxidation of the yttrium unless it is heated to high temperatures.
The sample was then slightly sputtered in order to remove the formed yttrium oxide, and then annealed to 1348 K. The higher annealing temperature was used in order to obtain a higher degree of ordering on the surface and possibly intensify the weak superspots in the LEED pattern. Fig. 6 shows the LEED image after annealing to 1348 K. The higher annealing temperature enlightened two sets of hexagonal superspots, corresponding to long range ordered structures. The distances B and C, indicated in the LEED pattern, were measured to be the same as in Fig. 4. The ratios A/D and A/E in the two superspot patterns were 10.4 ± 0.5 and 6.4 ± 0.3, respectively. The angle between A and D was 0° and the angle between A and E was 30°. Therefore, the superspots correspond to (6.4 × 6.4)R30° and (10.4 × 10.4) structures, referring to the original Pt(111) spots. Since 6.4·√3 ≈ 11.1, combining vectors from the smaller superspots roughly gives the larger superspots, meaning that the E hexagon could be interpreted as a higher order diffraction of D.
The blue line in Fig. 7 shows the CO TPD of the sample after annealing to 1348 K. The TPD displayed the same features as the one annealed to 1173 K; however, the very distinct peak at 295 K was lower in intensity and possessed a bit broader shoulder to the right of it. The CO TPD was repeated two times and showed very good reproducibility.
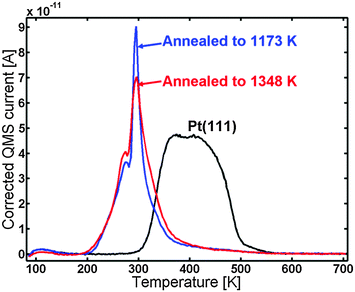 | ||
| Fig. 7 CO TPD of the Y/Pt(111) after annealing to 1348 K (red) compared to the sample annealed to 1173 K (blue) and to pure Pt(111) (black). | ||
Table 2 lists the concentrations of Pt, Y, C and O obtained by XPS after annealing to 1348 K. The higher annealing temperature caused an increase in the Pt![[thin space (1/6-em)]](https://www.rsc.org/images/entities/char_2009.gif) :
:![[thin space (1/6-em)]](https://www.rsc.org/images/entities/char_2009.gif) Y ratio. Assuming a Pt overlayer on a PtxY structure gives x = 5.7.
Y ratio. Assuming a Pt overlayer on a PtxY structure gives x = 5.7.
Afterwards, the sample was taken out of the chamber to measure its oxygen reduction activity. Angle resolved X-ray photoelectron spectroscopy (ARXPS) experiments were carried out ex situ in order to produce non-destructive depth profiles of the crystal and follow any changes in the surface composition (the same procedure as we previously used for different Pt alloys26,34,35,51,52).
Fig. 8 displays the ARXPS depth profile before electrochemical measurements. Apart from the formation of a small amount of Y oxide on the surface, the presence of a Pt overlayer on top of a Pt5Y bulk alloy can be observed. This ratio of Pt![[thin space (1/6-em)]](https://www.rsc.org/images/entities/char_2009.gif) :
:![[thin space (1/6-em)]](https://www.rsc.org/images/entities/char_2009.gif) Y was chosen on the basis of the XPS measurements shown in Table 2, together with the fact that Pt5Y is the stable Pt–Y phase with the highest Pt content.53
Y was chosen on the basis of the XPS measurements shown in Table 2, together with the fact that Pt5Y is the stable Pt–Y phase with the highest Pt content.53
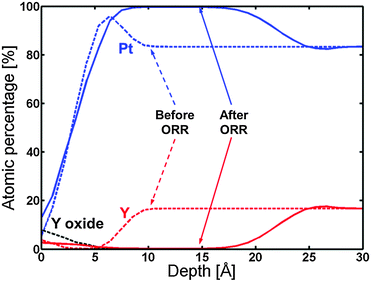 | ||
| Fig. 8 ARXPS depth profile of the 1348 K UHV annealed Y/Pt(111) before (dashed lines) and after (solid lines) ORR activity measurements. The C and O traces have been omitted for clarity. | ||
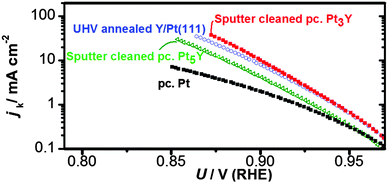
Afterwards, the oxygen reduction activity was measured. Fig. 9 shows the measured activity on a Tafel plot. The activity of the annealed Y/Pt(111) sample is significantly higher than polycrystalline platinum and close to that of the clean sputtered Pt3Y. Fig. 8 also shows the ARXPS depth profile after ORR activity measurements. The platinum overlayer has substantially grown in thickness. This evidence, together with the disappearance of any Y oxide phase, suggests that yttrium leached out from the surface layers. Therefore, the Pt skin structure prepared under UHV results in a Pt skeleton structure upon ORR activity measurements in an acid electrolyte. This also means that the surface studied under UHV conditions is different from the one relevant for the electrochemical experiments. In order to directly correlate measurements done under UHV with electrochemical experiments it would be necessary to have a surface which is stable under reaction conditions.20,26,54
Discussion
The ISS data showed that the annealed Y/Pt(111) only has Pt atoms in the surface layer. XPS indicated that Y is present in the near surface region and, if the near surface region is assumed to be composed of a Pt overlayer covering a PtxY bulk alloy, x would be roughly 4−6 depending on the annealing temperature.Fig. 5 shows the CO TPD for the annealed Y/Pt(111) compared to Pt(111). The desorption temperature was clearly shifted down on the annealed Y/Pt(111) compared to Pt(111). The CO TPD of the annealed Y/Pt(111) consisted of a pronounced peak at around 295 K and a smaller peak at around 275 K. The origin of the sharp peak at around 295 K could be due to strong CO–CO interactions on an ordered CO layer on the surface.55 At around 295 K some of the CO from this ordered structure desorbs, which causes the ordered CO structure to collapse and immediately desorb from the surface.
Since XPS and ISS data indicated the presence of an overlayer consisting of pure Pt on top of a PtxY alloy, the decrease in CO desorption temperature can be either related to ligand or strain effects.
In our recent article about UHV annealed polycrystalline Pt3Sc, the change in desorption temperature of CO was correlated with a change in binding energy of the ORR intermediates, O*, HO* and HOO*.35 The optimal ORR catalyst should bind HO* ∼0.1 eV weaker than pure Pt, which would correspond to a decrease in CO desorption temperature of ∼85 K.56 For the annealed Y/Pt(111) sample, the onset of the CO desorption was shifted down ∼100 K compared to Pt(111). The sharp desorption feature at ∼295 K is also ∼100 K lower than the center of the peak for Pt(111). This places the expected ORR activity for the annealed Y/Pt(111) close to optimal.
The LEED pattern from Fig. 4 indicates that the annealed Y/Pt(111) has a (1.88 × 1.88)R30° structure relative to Pt(111), which corresponds to a strained surface. The structure could correspond to a (2 × 2)R30° structure where the lattice is under 6% compressive strain, or a (√3 × √3)R30° structure where the lattice is under 9% tensile strain.
Presumably a surface under 6% strain would be more stable than a surface under 9% strain. Furthermore, a surface under tensile strain would increase the binding of intermediates. The weaker binding of CO in the TPD of Fig. 5 is consistent with a surface under compressive, rather than tensile strain. Consequently, it appears that the structure under compressive strain is more likely.
The observed LEED pattern and CO TPD for annealed Y/Pt(111) bare many similarities to those reported in the literature for the deposition of rare earth metals on Pt(111).37–43 The superspots on Fig. 6 correspond to a long range ordering on the crystal. The appearance of the superspots could be induced by the higher annealing temperature leading to a more ordered surface. However, since the sample was also slightly sputtered between experiments, the superspots could also originate from the border between the bulk Pt(111) and the Pt–Y alloy layer. Tang et al. observed similar superspots and attributed this superstructure to the lattice mismatch between the alloy and the Pt(111) substrate.37
Considering all of the experiments performed on the annealed Y/Pt(111) under UHV, the most probable structure seems to be a Pt overlayer on top of a Pt5Y alloy. X-ray diffraction measurements performed by Stephens et al.34 on a bulk polycrystalline Pt5Y sample show that the bulk structure is not a closely packed structure. The Pt5Y alloy consists of alternating layers of Pt2Y and Kagomé nets of Pt atoms, similar to the structure reported for Pt5Ce.38,43 However, the structure of the annealed Y/Pt(111) after electrochemical testing is different.
The ARXPS depth profile in Fig. 8 shows that the thickness of the Pt overlayer changed from a few angstroms to around 15 angstroms after electrochemistry. Due to both uncertainties in the sensitivity factor for Y and general uncertainty in the ARXPS measurements, the absolute value for the thickness of the Pt overlayer is indicative. However, the ARXPS clearly showed a dramatic change in the overlayer thickness by a factor of around 5. The Pt overlayer does therefore not provide sufficient protection against dissolution of the yttrium atoms from the subsurface layers. This was also observed for the Pt overlayer on polycrystalline Pt3Sc, although in that case the post-ORR Pt overlayer thickness was much lower.35 This indicates that Pt-skin structures do not seem to be stable for alloys of Pt and early transition metals. As a consequence of the observed thick Pt overlayer on the annealed Y/Pt(111) after ORR testing, the measured increase in the ORR activity cannot be explained by the ligand effect and could be attributed to the strain effect.
The fact that yttrium is not stable in the second layer could be due to different effects. One is the high driving force for Y dissolution due to the very negative standard reduction potential of Y (E0 = −2.372 V for Y ⇒ Y3+).57 Another is the high affinity of yttrium for oxygen (ΔH = −1905 kJ mol−1 or corresponding to a gain of 9.9 eV per yttrium atom for 2Y + 1.5O2 = Y2O3),58 which could favour the formation of subsurface oxygen or segregation of Y, leading to a depletion of yttrium.59–61
It is interesting to compare the UHV annealed Y/Pt(111) crystal with the UHV annealed Pt3Sc polycrystalline sample from our earlier work. For scandium the standard reduction potential (E0 = −2.077 V for Sc ⇒ Sc3+)57 and affinity for oxygen (ΔH = −1908 kJ mol−1 for 2Sc + 1.5O2 = Sc2O3)58 are approximately as high as for yttrium. The heat of formation of Pt3Sc, Pt3Y and Pt5Y is also about the same.27,62 Nevertheless, UHV annealed Pt3Sc showed little change in the Pt overlayer thickness after ORR measurements, whereas for UHV annealed Y/Pt(111) a thick Pt overlayer was formed. The most striking difference between UHV annealed Pt3Sc and UHV annealed Y/Pt(111) is the degree of strain. Pt3Sc is under 0.9% tensile strain whereas UHV annealed Y/Pt(111) is under 3.8% tensile strain, assuming a Pt3Y structure, or 5% compressive strain, assuming a Pt5Y structure. We hypothesise that this difference in the degree of strain is the reason for the difference in stability of the Pt overlayer.
It seems to be quite plausible that the high activity of polycrystalline Pt3Y could also be due to the formation of a compressed Pt overlayer. Although the bulk Pt–Pt interatomic distance would be greater than that of pure Pt, presumably upon dealloying the surface would more closely resemble Pt5Y. Our present work shows that a Pt overlayer covering Pt5Y would likely be under compression. Evidently, this thick, compressed Pt overlayer differs significantly from our original assumptions.
Conclusion
We have studied the structure and activity of annealed Y/Pt(111). Under UHV conditions the structure was a Pt overlayer on top of what appears to be a Pt5Y alloy. The structure exhibited a clear decrease in the desorption temperature of CO. This structure is, however, not preserved under electrochemical conditions as a thick Pt overlayer is formed. The Pt overlayer does not supply sufficient kinetic stability against yttrium dissolution from the first few atomic layers under ORR conditions. Even so, we anticipate that the strong interaction between Pt and Y would hinder continued dissolution from deeper layers. It seems likely that the Pt overlayer formed is under compressive strain, similar to other alloys of Pt and rare earths.10,34,51,52 Our future investigations will focus on the elucidation of the Pt overlayer formed under ORR conditions.Acknowledgements
Funding by the Danish Council for Technology and Innovations FTP program and by the Danish Strategic Research Councils HyCycle program is gratefully acknowledged. P.H.F. acknowledges funding from the Danish Council for Strategic Research in Sustainable Energy and Environment-project “MEDLYS”. M.E.E. gratefully acknowledges funding from the EU PF7's initiative Fuel Cell and Hydrogen Joint Undertaking's project CathCat (GA 303492). The Danish National Research Foundation's Center for Individual Nanoparticle Functionality is supported by the Danish National Research Foundation (DNRF54).Notes and references
- BP Statistical Review of World Energy June 2013. http://www.bp.com.
- N. Armaroli and V. Balzani, Angew. Chem., Int. Ed., 2007, 46, 52–66 CrossRef CAS PubMed.
- E. E. Benson, C. P. Kubiak, A. J. Sathrum and J. M. Smieja, Chem. Soc. Rev., 2008, 38, 89–99 RSC.
- Y. Hori, K. Kikuchi and S. Suzuki, Chem. Lett., 1985, 1695–1698 CrossRef CAS.
- B. Hinnemann and J. K. Nørskov, Top. Catal., 2006, 37, 55–70 CrossRef CAS PubMed.
- J. Rossmeisl, Z.-W. Qu, H. Zhu, G.-J. Kroes and J. K. Norskov, J. Electroanal. Chem., 2007, 607, 83–89 CrossRef CAS PubMed.
- G. W. Crabtree, M. S. Dresselhaus and M. V. Buchanan, Phys. Today, 2004, 57, 39–44 CrossRef CAS PubMed.
- H. A. Gasteiger, D. R. Baker and R. N. Carter, Hydrogen Fuel Cells: Fundamentals and Applications., Wiley-CPH, 2010 Search PubMed.
- H. A. Gasteiger, S. S. Kocha, B. Sompalli and F. T. Wagner, Appl. Catal., B, 2005, 56, 9–35 CrossRef CAS PubMed.
- I. E. L. Stephens, A. S. Bondarenko, U. Grønbjerg, J. Rossmeisl and I. Chorkendorff, Energy Environ. Sci., 2012, 5, 6744–6762 CAS.
- A. Rabis, P. Rodriguez and T. J. Schmidt, ACS Catal., 2012, 2, 864–890 CrossRef CAS.
- F. T. Wagner, B. Lakshmanan and M. F. Mathias, J. Phys. Chem. Lett., 2010, 1, 2204–2219 CrossRef CAS.
- T. Toda, H. Igarashi, H. Uchida and M. Watanabe, J. Electrochem. Soc., 1999, 146, 3750–3756 CrossRef CAS PubMed.
- L. Dubau, J. Durst, F. Maillard, L. Guétaz, M. Chatenet, J. André and E. Rossinot, Electrochim. Acta, 2011, 56, 10658–10667 CrossRef CAS PubMed.
- L. Dubau, F. Maillard, M. Chatenet, J. André and E. Rossinot, Electrochim. Acta, 2010, 56, 776–783 CrossRef CAS PubMed.
- F. Maillard, L. Dubau, J. Durst, M. Chatenet, J. Andre and E. Rossinot, Electrochem. Commun., 2010, 12, 1161–1164 CrossRef CAS PubMed.
- S. Chen, H. A. Gasteiger, K. Hayakawa, T. Tada and Y. Shao-Horn, J. Electrochem. Soc., 2010, 157, A82–A97 CrossRef CAS PubMed.
- J. Rossmeisl, G. S. Karlberg, T. Jaramillo and J. K. Nørskov, Faraday Discuss., 2008, 140, 337–346 RSC.
- I. Katsounaros, S. Cherevko, A. R. Zeradjanin and K. J. J. Mayrhofer, Angew. Chem., Int. Ed., 2014, 53, 102–121 CrossRef CAS PubMed.
- V. R. Stamenkovic, B. Fowler, B. S. Mun, G. F. Wang, P. N. Ross, C. A. Lucas and N. M. Markovic, Science, 2007, 315, 493–497 CrossRef CAS PubMed.
- V. R. Stamenkovic, B. S. Mun, M. Arenz, K. J. J. Mayrhofer, C. A. Lucas, G. F. Wang, P. N. Ross and N. M. Markovic, Nat. Mater., 2007, 6, 241–247 CrossRef CAS PubMed.
- A. Bonakdarpour, K. Stevens, G. D. Vernstrom, R. Atanasoski, A. K. Schmoeckel, M. K. Debe and J. R. Dahn, Electrochim. Acta, 2007, 53, 688–694 CrossRef CAS PubMed.
- Y. Xu, S. Hou, Y. Liu, Y. Zhang, H. Wang and B. Zhang, Chem. Commun., 2012, 48, 2665–2667 RSC.
- Y. Xu and B. Zhang, Chem. Soc. Rev., 2014, 43, 2439–2450 RSC.
- J. K. Nørskov, J. Rossmeisl, A. Logadottir, L. Lindqvist, J. R. Kitchin, T. Bligaard and H. Jónsson, J. Phys. Chem. B, 2004, 108, 17886–17892 CrossRef.
- I. E. L. Stephens, A. S. Bondarenko, F. J. Perez-Alonso, F. Calle-Vallejo, L. Bech, T. P. Johansson, A. K. Jepsen, R. Frydendal, B. P. Knudsen, J. Rossmeisl and I. Chorkendorff, J. Am. Chem. Soc., 2011, 133, 5485–5491 CrossRef CAS PubMed.
- J. Greeley, I. E. L. Stephens, A. S. Bondarenko, T. P. Johansson, H. A. Hansen, T. F. Jaramillo, J. Rossmeisl, I. Chorkendorff and J. K. Nørskov, Nat. Chem., 2009, 1, 552–556 CrossRef CAS PubMed.
- M. Mavrikakis, B. Hammer and J. K. Nørskov, Phys. Rev. Lett., 1998, 81, 2819–2822 CrossRef.
- J. R. Kitchin, J. K. Nørskov, M. A. Barteau and J. G. Chen, J. Chem. Phys., 2004, 120, 10240–10246 CrossRef CAS PubMed.
- P. Strasser, S. Koh, T. Anniyev, J. Greeley, K. More, C. F. Yu, Z. C. Liu, S. Kaya, D. Nordlund, H. Ogasawara, M. F. Toney and A. Nilsson, Nat. Chem., 2010, 2, 454–460 CrossRef CAS PubMed.
- F. Calle-Vallejo, J. I. Martínez, J. M. García-Lastra, J. Rossmeisl and M. T. M. Koper, Phys. Rev. Lett., 2012, 108, 116103 CrossRef CAS.
- H. E. Hoster, O. B. Alves and M. T. M. Koper, ChemPhysChem, 2010, 11, 1518–1524 CrossRef CAS PubMed.
- B. S. Mun, M. Watanabe, M. Rossi, V. Stamenkovic, N. M. Markovic and P. N. Ross, J. Chem. Phys., 2005, 123, 204717 CrossRef PubMed.
- I. E. L. Stephens, A. S. Bondarenko, L. Bech and I. Chorkendorff, ChemCatChem, 2012, 4, 341–349 CrossRef CAS.
- T. P. Johansson, E. T. Ulrikkeholm, P. Hernandez-Fernandez, P. Malacrida, H. A. Hansen, A. S. Bandarenka, J. K. Nørskov, J. Rossmeisl, I. E. L. Stephens and I. Chorkendorff, Top. Catal., 2014, 57, 245–254 CrossRef CAS.
- T. P. Johansson, New Materials for Oxygen Reduction Electrodes, PhD thesis, DTU, 2012 Search PubMed.
- J. Tang, J. M. Lawrence and J. C. Hemminger, Phys. Rev. B: Condens. Matter Mater. Phys., 1993, 48, 15342–15352 CrossRef CAS.
- C. J. Baddeley, A. W. Stephenson, C. Hardacre, M. Tikhov and R. M. Lambert, Phys. Rev. B: Condens. Matter Mater. Phys., 1997, 56, 12589–12598 CrossRef CAS.
- B. Vermang, M. Juel and S. Raaen, Phys. Rev. B: Condens. Matter Mater. Phys., 2006, 73, 033407 CrossRef.
- A. Kildemo, A. Juel and S. Raaen, Surf. Sci., 2005, 581, 133–141 CrossRef PubMed.
- A. Ramstad and S. Raaen, Phys. Rev. B: Condens. Matter Mater. Phys., 1999, 59, 15935–15941 CrossRef CAS.
- A. Ramstad, S. Raaen and N. Barrett, Surf. Sci., 2000, 448, 179–186 CrossRef CAS.
- J. M. Essen, C. Becker and K. Wandelt, e–J. Surf. Sci. Nanotechnol., 2009, 7, 421–428 CrossRef CAS.
- W.-P. Zhou, X. Yang, M. B. Vukmirovic, B. E. Koel, J. Jiao, G. Peng, M. Mavrikakis and R. R. Adzic, J. Am. Chem. Soc., 2009, 131, 12755–12762 CrossRef CAS PubMed.
- A. S. Bandarenka, A. S. Varela, M. Karamad, F. Calle-Vallejo, L. Bech, F. J. Perez-Alonso, J. Rossmeisl, I. E. L. Stephens and I. Chorkendorff, Angew. Chem., Int. Ed., 2012, 51, 11845–11848 CrossRef CAS PubMed.
- N. Todoroki, Y. Iijima, R. Takahashi, Y. Asakimori and T. Wadayama, J. Electrochem. Soc., 2013, 160, F591–F596 CrossRef CAS PubMed.
- S. Brimaud, A. K. Engstfeld, O. B. Alves and R. J. Behm, J. Electroanal. Chem., 2014, 716, 71–79 CrossRef CAS PubMed.
- R. Yang, P. Strasser and M. F. Toney, J. Phys. Chem. C, 2011, 115, 9074–9080 CAS.
- K. J. Andersson, F. Calle-Vallejo, J. Rossmeisl and I. Chorkendorff, J. Am. Chem. Soc., 2009, 131, 2404–2407 CrossRef CAS PubMed.
- D. Briggs and M. P. Seah, Practical Surface Analysis, John Wiley & Sons Ltd., 1992, vol. 1 Auger and X-ray Photoelectron Spectroscopy Search PubMed.
- M. Escudero-Escribano, A. Verdaguer-Casadevall, P. Malacrida, U. Grønbjerg, B. P. Knudsen, A. K. Jepsen, J. Rossmeisl, I. E. L. Stephens and I. Chorkendorff, J. Am. Chem. Soc., 2012, 134, 16476–16479 CrossRef CAS PubMed.
- P. Malacrida, M. Escudero-Escribano, A. Verdaguer-Casadevall, I. E. L. Stephens and I. Chorkendorff, J. Mater. Chem. A, 2014, 2, 4234–4243 CAS.
- B. Predel, Pt-Y (Platinum-Yttrium), in SpringerMaterials - The Landolt-Börnstein Database, ed. O. Madelung, 1998, vol. 5I, DOI:10.1007/10542753_2539.
- V. R. Stamenkovic, B. S. Mun, K. J. J. Mayrhofer, P. N. Ross and N. M. Markovic, J. Am. Chem. Soc., 2006, 128, 8813–8819 CrossRef CAS PubMed.
- S. Raaen and A. Ramstad, Energy, 2005, 30, 821–830 CrossRef CAS PubMed.
- M. Ruff, N. Takehiro, P. Liu, J. K. Nørskov and R. J. Behm, ChemPhysChem, 2007, 8, 2068–2071 CrossRef CAS PubMed.
- M. Pourbaix, Atlas of Electrochemical Equilibria in Aqueous Solutions, National Association of Corrosion Engineers, Houston, Texas, 1974 Search PubMed.
- Standard thermodynamic properties of chemical substances, in CRC Handbook of Chemistry and Physics, ed. W. M. Haynes, CRC Press, Boca Raton, FL, 94th edn, 2013, section 5, pp. 5–17 Search PubMed.
- C. A. Menning and J. G. Chen, J. Power Sources, 2010, 195, 3140–3144 CrossRef CAS PubMed.
- C. A. Menning and J. G. Chen, Top. Catal., 2010, 53, 338–347 CrossRef CAS.
- C. A. Menning and J. G. Chen, J. Chem. Phys., 2008, 128, 164703 CrossRef PubMed.
- A. Palenzona and S. Cirafici, J. Phase Equilib., 1990, 11, 493–497 CAS.
| This journal is © the Owner Societies 2014 |

