DOI:
10.1039/D4CE00947A
(Paper)
CrystEngComm, 2025,
27, 559-568
Growth and properties of Pr-doped PMNT single crystals
Received
16th September 2024
, Accepted 26th November 2024
First published on 3rd January 2025
Abstract
Pr-doped 0.70Pb(Mg1/3Nb2/3)O3–0.30PbTiO3 (PMNT:Pr) single crystals are grown with the seed-guided Bridgman method. The PMNT:Pr crystal remains a pure perovskite structure with Pr3+ ion doping. The maximum d33 of the morphotropic phase boundary is 2636 pC N−1 at 10 Hz, 20 cycles and 14 kV cm−1. The dielectric constant is higher than 4300 at room temperature and 0.1 kHz. The coercivity field Ec and remaining polarization Pr decrease with increasing temperature at 10 kV cm−1 and 10 Hz, respectively. The ferroelectric domains become periodically dense and regular, and the domain size is uniform under the AC polarization. In the wavelength range of 200–2000 nm, the transmittance of the crystal under the non-polar mode, DC-polar mode and AC-polar mode is 29–37%, 33–51% and 53–61%, respectively. The crystal excitation at 451 nm yielded the strongest red light emission at 651 nm, and the luminescence intensity decreased with increasing temperature. PMNT:Pr single crystals have been proved to be rare-earth doped ferroelectric single crystal materials with high piezoelectric properties.
1. Introduction
The perovskite relaxer ferroelectric Pb(Mg1/3Nb2/3)O3–PbTiO3 (PMNT) has excellent ferroelectric, piezoelectric, dielectric, and electromechanical properties near the morphotropic phase boundary (MPB).1–3 The PMNT has a solid solution composition near the MPB, a piezoelectric coefficient d33 of 1400–2000 pC N−1, a dielectric constant εr of 4000–6000 and a coercive field of 2.3–2.8 kV cm−1.4–6 Further studies showed that the piezoelectric coefficient of PMNT crystals under AC polarization reached 2000 pC N−1, and the dielectric constant is as high as 8500.7 Its excellent performance has been widely used in industrial and military fields.8–12 However, a lower piezoelectric coefficient and lower coercive field limit the application in high-power sensors. Some studies have shown that doping rare earth ions can effectively improve the performance of these relaxor-based ferroelectrics.13–19 To investigate the effect of ion doping on the crystal properties of PMNT crystals, in 2018, Li et al. synthesized Sm-doped PMN-PT ceramics, with a high piezoelectric coefficient d33 of 1500 pC N−1, a dielectric constant ε33/ε0 higher than 13![[thin space (1/6-em)]](https://www.rsc.org/images/entities/char_2009.gif) 000, and a Curie temperature of 89 °C.20 Later, Li et al. proposed a Sm-doped PMNT single crystal with a maximum d33 of 4100 pC N−1, which was considered a technological breakthrough in the field of ferroelectric materials.21 The doping of Sm3+ increased the local structural heterogeneity in PMNT single crystals, thus enhancing the piezoelectricity of relaxor ferroelectric crystals. In 2021, Zhang et al. prepared an Er3+/Sc3+ co-doped 0.68Pb(Mg1/3Nb2/3)O3–0.32PbTiO3 ferroelectric single crystal with a high temperature flux method. The residual polarization Pr was 27.97 μC cm−2 and the coercive field Ec was 8.26 kV cm−1.22 In 2021, Zhang et al. designed Ho3+/Yb3+ co-doped PMNT crystals with excellent ferroelectric and spectral properties.23 Their coercive field Ec is up to 11.86 kV cm−1 and they produce an upconversion luminous emission band at 980 nm excitation. Previous experiments have shown that rare earth ion-doped PMNT crystals can increase the piezoelectric constant and coercive field.24–27 While the rare earth ion Pr3+ has the characteristics of a relatively simple energy level and excellent luminescence performance, we suspect that Pr3+ doped PMNT can also improve the ferroelectric properties and optical properties, and verify it experimentally.
000, and a Curie temperature of 89 °C.20 Later, Li et al. proposed a Sm-doped PMNT single crystal with a maximum d33 of 4100 pC N−1, which was considered a technological breakthrough in the field of ferroelectric materials.21 The doping of Sm3+ increased the local structural heterogeneity in PMNT single crystals, thus enhancing the piezoelectricity of relaxor ferroelectric crystals. In 2021, Zhang et al. prepared an Er3+/Sc3+ co-doped 0.68Pb(Mg1/3Nb2/3)O3–0.32PbTiO3 ferroelectric single crystal with a high temperature flux method. The residual polarization Pr was 27.97 μC cm−2 and the coercive field Ec was 8.26 kV cm−1.22 In 2021, Zhang et al. designed Ho3+/Yb3+ co-doped PMNT crystals with excellent ferroelectric and spectral properties.23 Their coercive field Ec is up to 11.86 kV cm−1 and they produce an upconversion luminous emission band at 980 nm excitation. Previous experiments have shown that rare earth ion-doped PMNT crystals can increase the piezoelectric constant and coercive field.24–27 While the rare earth ion Pr3+ has the characteristics of a relatively simple energy level and excellent luminescence performance, we suspect that Pr3+ doped PMNT can also improve the ferroelectric properties and optical properties, and verify it experimentally.
To test the conjecture that Pr3+ ion doping of PMNT can enhance the piezoelectricity of ferroelectric single crystals, we grow large-size 1% Pr-doped PMNT (0.01Pr2O3–0.69Pb(Mg1/3Nb2/3)O3–0.30PbTiO3, PMNT:Pr) single crystals with a vertical Bridgman method. The structure and piezoelectric, dielectric and optical properties of the crystal are characterized. The results show that the crystal has a high piezoelectric constant and excellent luminous performance, which has potential in piezoelectric equipment applications based on the relaxation of the ferroelectric single crystal.
2. Experiment
2.1 Polycrystal preparation
MgO (4N), PbO (4N), Nb2O5 (4N), TiO2 (4N) and Pr2O3 (4N) were used as raw materials. MgO and Nb2O5 were mixed according to stoichiometric ratios, and sintered in a muffle furnace at 1100 °C for 6 h to synthesize the MgNb2O6 compound. After mixing the raw material (PbO is in excess by 1.0 mol%) according to the chemical formula of PMNT:Pr, the polycrystal material was synthesized by sintering at 850 °C for 4 h. The chemical reaction equations involved are as follows:
| TiO2 + PbO + Pr2O3 + MgNb2O6 → PMNT : Pr |
2.2 Crystal growth
PMNT:Pr crystals were grown using the vertical Bridgman method. The platinum crucible used in the crystal growth had dimensions of Ø 30 × 230 mm and a cylinder at the bottom of the cone. The (110) oriented PMNT seed crystal was installed in the bottom cylinder and the PMNT:Pr polycrystalline material was then filled into the cylindrical chamber. The crucible filled with polycrystalline material was sealed by welding to avoid volatilization of the raw material during growth. The crucible was placed in the furnace chamber after being loaded into the ceramic tube, and the high temperature zone of the furnace chamber was heated to 1370–1390 °C. The upper portion of the seed crystal can be fused to the crucible polycrystalline material melt by positioning the crucible at an appropriate height in the furnace. The crystal growth was completed by using an automatic control device with a drop rate of 0.4–0.6 mm h−1. The melt in the crucible solidified and crystallized from the bottom up. After the crystal growth, the crystal in the furnace tube was annealed at 1150 °C for 12 h to relieve residual thermal stress, and then the furnace temperature was reduced to room temperature at a rate of 60–70 °C h−1. The PMNT:Pr single crystal was obtained from the stripped crucible.
2.3 Characterization methods
To confirm the crystalline phase of the grown single crystals, the collected powder samples were analyzed using an X-ray powder diffractometer (XRD; Model D8 Focus; Bruker; Germany) with a Cu Kα radiation source. The grown crystals were measured using an X-ray orientator (YX-2H8A embedded X-ray crystal orientator) to determine the crystal planes. Four (100) -oriented samples were cut from the PMNT:Pr crystal, labeled (A), (B), (C) and (D). The crystal wafers were treated with DC polarization (DCP) or AC polarization (ACP) after gold films were coated on both sides with an ion sputtering equipment (JS1600, SAINTINS). For ACP, an asymmetric triangular wave was first generated by a signal generator (Agilent 33220A). This was amplified by a high voltage amplifier (Trek Model 10/40A) and the AC voltage was applied to the crystal wafer. Crystal samples were polarized for 20 cycles at an AC voltage with a frequency of 10 Hz and an electric field of 14 kV cm−1. For comparison, another set of the same samples were polarized at room temperature and an electric field of 14 kV cm−1 for 10 minutes. The dielectric properties, piezoelectric coefficient, and ferroelectric properties of the samples were systematically characterized. The temperature dependence of the dielectric constant ε33/ε0 and the dielectric loss (tanδ) were measured using an Agilent 4294A impedance Analyzer and a PTC10 temperature controller in the temperature range 30–250 °C at 0.1 kHz, 1 kHz, 5 kHz and 10 kHz. The piezoelectric coefficient was measured using a quasi-static piezometer (ZJ-4AN, Institute of Acoustics, Chinese Academy of Sciences). The polarization and electric field (P–E) hysteresis lines were measured using a ferroelectric analyser (TF Analyzer 2000E, aixACCT) at 10 kV cm−1, 10 Hz at 30–150 °C. PFM tests were carried out using an Asylum Research AFM (Asylum Research Atomic Force Microscope, Oxford, USA) to observe the electric domain structure of the crystal wafers. A PerkinElmer Lambda 95 spectrophotometer was used to measure the optical transmittance of the samples in the wavelength range of 200–2500 nm. Steady-state fluorescence and quantum efficiency were measured using a quantum efficiency measurement system (QE-2100, Otsuka, Japan). The variable temperature fluorescence spectra was detected using a fluorescence spectrometer equipped with a Linkam HFS600E-PB 2 temperature control unit (FS5, Edinburgh, UK).
3. Results and discussion
3.1 Crystal structure
PMNT:Pr crystals are successfully grown using the vertical Bridgman method. The crystals are brown-yellow, translucent and the maximum size is Ø 30 × 70 mm. A ceramic layer of thickness 10 mm at the top of the crystal has been removed due to composition segregation during crystal growth. After cutting and polishing, the PMNT:Pr crystal is shown in Fig. 1(a). Four (100) oriented wafers with dimensions Ø 10 × 0.8 mm are obtained at equal distance and labelled (A), (B), (C) and (D), respectively.
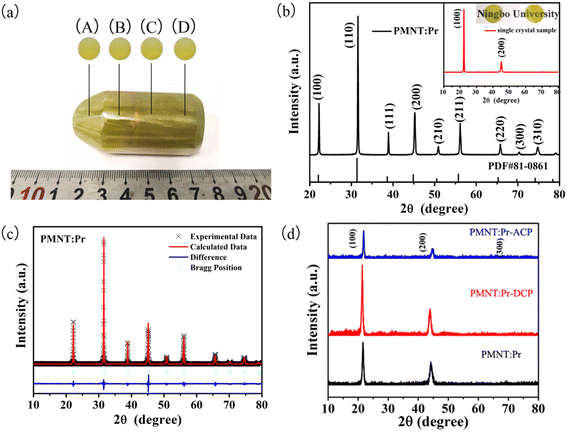 |
| | Fig. 1 (a) Photograph of the PMNT:Pr crystal. (b) XRD patterns of the PMNT:Pr polycrystalline material (inset is the XRD pattern of the (100) oriented wafers). (c) XRD refinement of the PMNT:Pr polycrystalline material. (d) XRD patterns of the (100) oriented wafers under unpolarized and DCP/ACP. | |
Fig. 1(b) shows the X-ray powder diffraction pattern of the PMNT:Pr compound. It can be seen that the diffraction peak of PMNT:Pr is consistent with the Pb(Mg1/3Nb2/3)O3 crystal (PDF #81-0861). They are both pure perovskite structures (ABO3) with no other phases, indicating that the Pr3+ ions have been doped into the crystal lattice of PMNT. Fig. 1(b) inset shows the XRD pattern of a directionally cut PMNT:Pr wafer, confirming the (100) orientation of the wafer. Fig. 1(c) shows the XRD pattern after refinement and the correction parameters χ2, Rwp and Rp are 2.06%, 3.29% and 1.93%, respectively. The error values are very small, which indicate the higher purity of compounds. Fig. 1(d) shows the XRD pattern of the crystal wafers after ACP and DCP. Only the (100), (200) and (300) diffraction peaks of the rhombohedral phase are shown, confirming that the ACP and DCP cannot change the crystal phase structure.
3.2 Piezoelectric coefficient
The curve of the piezoelectric coefficient of the samples with the applied field strength is shown in Fig. 2(a). The d33 increases to stabilization with increasing applied electric field. When the electric field strength E ≥ 14 kV cm−1, the d33 of samples A–D are maintained around 1173 pC N−1, 1568 pC N−1, 2061 pC N−1 and 1205 pC N−1, respectively. Fig. 2(b) shows the stable d33 after DC polarization. Samples A–D d33 show a pattern of first increasing and then decreasing. This is because the position of sample C is located in the MPB region, where there is a transition from the rhombohedral phase to the tetragonal phase. The heterogeneity of the crystal structure and heterogeneity of the microstructure lead to a large piezoelectric coefficient.28
 |
| | Fig. 2 (a) Variation of the d33 with electric field strength of samples A–D under DC polarization. (b) The stable d33 of samples A–D after DC polarization. | |
We explored the effect of AC polarization on the crystal piezoelectric coefficients using the C sample. As shown in Fig. 3(a), when the electric field increases to 14 kV cm−1, the maximum d33 under the conditions of 1 Hz and 1 cycle reaches 2300 pC N−1. The cycling number and electric field strength are unchanged, and the relationship diagram of d33versus frequency is shown in Fig. 3(b). As the frequency increases to 10 Hz, the d33 gradually increases to remain around 2520 pC N−1. The d33 under different cycles at 14 kV cm−1 and 10 Hz are obtained as shown in Fig. 3(c). When the cycles number reaches 20 times, the d33 reaches a maximum of about 2630 pC/N. It is clear that the sample has the largest d33 under 14 kV cm−1, 10 Hz and 20 cycles condition. Fig. 3(d) is the comparison of d33 under ACP and DCP conditions. The average d33 obtained under ACP conditions is 2636 pC N−1, which is about 30% higher than that of 2061 pC N−1 under DCP conditions.
 |
| | Fig. 3 (a) The d33 of sample C under different electric field polarizations in AC and DC. (b) The d33versus polarization frequency for sample C obtained by ACP at 14 kV cm−1, 1 cycle. (c) The d33versus cycle numbers for sample C obtained by ACP at 14 kV cm−1, 10 Hz. (d) Comparison of d33 of sample C under ACP/DCP. | |
3.3 Dielectric properties
The dielectric temperature spectra of samples A–D in PMNT:Pr crystals are shown in Fig. 4. There are three dielectric peaks in samples A and B, corresponding to the rhombohedral phase to the monoclinic phase transition temperature TR–M, the monoclinic phase to the tetragonal phase transition temperature TM–T, and the Curie temperature TC. The transition temperatures of each phase of sample A are 65 °C, 74 °C and 109 °C, and those of sample B are 55 °C, 76 °C and 118 °C, respectively. In samples C and D, the corresponding TR–T are 67 °C and 91 °C, and TC were 118 °C and 124 °C, respectively. The TC of samples gradually increased because of the PbTiO3 upward enrichment during crystal growth.29 From the figure, the dielectric constant ε of the samples at 100 Hz are 5400, 4360, 7060 and 2460, respectively. The dielectric loss tanδ values are 0.0678, 0.0288, 0.0466, and 0.0477, respectively. The phase change dispersion widens the dielectric peak, and the dielectric peak moves to the high-temperature region with increasing frequency. The dielectric loss at low temperature is mainly caused by the reversal of the electric dipole moment. With increasing temperature and frequency, the gradually increasing electric dipole moment leads to an increase in the dielectric loss.30 When the temperature exceeds Tc, the crystal becomes paraelectric. The positive and negative charge centers coincide and the electric dipole moment disappears, the loss caused by the electric dipole moment reversal also disappears, and the dielectric loss decreases.
 |
| | Fig. 4 (a)–(d) Temperature dependence of relative permittivity and loss factor for crystal samples A, B, C, and D, respectively. | |
3.4 Ferroelectric properties
The ferroelectric hysteresis loops of the PMNT:Pr samples are shown in Fig. 5(a). The coercivity field Ec of samples A–D are 3.5 kV cm−1, 3.9 kV cm−1, 4.20 kV cm−1, 5.2 kV cm−1 at 10 kV cm−1 and 10 Hz, respectively. The remaining polarization Pr values are 23.43 μC cm−2, 24.10 μC cm−2, 28.50 μC cm−2 and 29.50 μC cm−2. Both Ec and Pr are increasing, related to phase transitions from the rhombohedral phase to the tetragonal phase. Due to the different spontaneous polarization orientations of the PMNT:Pr crystal domains in different phase states, there are a lot of 90° domains in the tetragonal phase. The energy required for domain inversion is very high, resulting in a high coercive field. The hysteresis loops of sample C obtained by changing the electric field intensity are shown in Fig. 5(b). Ec and Pr reached their maximum values of 4.15 kV cm−1 and 28.87 μC cm−2 at 30 kV, respectively. This is because as the electric field increases, more domains begin to flip, making the saturation of the hysteresis loop gradually increase, and the coercive field and residual polarization increase.
 |
| | Fig. 5 (a) Ferroelectric hysteresis loops of samples A–D. Ferroelectric hysteresis loops of sample C under different (b) electric fields and (c) temperatures. (d) Ec and Pr of sample C at different temperatures. | |
In order to investigate the effect of temperature on the ferroelectric properties of the crystal, we tested the ferroelectric hysteresis loop of PMNT:Pr at different temperatures as shown in Fig. 5(c). The figure shows that the hysteresis loop gradually becomes narrow as the temperature increases. The lattice vibration of PMNT:Pr is enhanced and the electric domain reversal is accelerated under the influence of thermal disturbance driven on by a rise in temperature, which causes the domain to gradually depolarize and both Ec and Pr to decrease. Fig. 5(d) shows Ec and Pr changing with temperature. The sudden increase in Pr at 50 °C is because sample C is taken from the MPB region, where the crystal undergoes a tripartite to tetragonal phase transition. However, the electric domains within the tetragonal phase are more difficult to overturn, causing a sudden increase in Pr around the phase transition temperature for crystals in the MPB. As the temperature increases to above the Curie temperature, Pr rapidly decreases to the ferroelectric disappearance. Due to the internal resistance and defect carriers of the single crystal sample, Ec and Pr will not be completely reduced to zero.
3.5 Domain morphology
The relaxor ferroelectric single crystal can reduce the domain size and increase the domain wall density under polarization conditions, which is beneficial to enhance the piezoelectric properties of the crystal. Fig. 6 shows the surface morphology, piezoelectric response amplitude and phase of sample C, all scanned at a scale of 5 × 5 μm2. For the unpolarized (NOP) mode, as can be seen in Fig. 6(a)–(c), the surface of the samples is relatively smooth, and the polishing roughness is about 10 nm. The 180° and non-180° light–dark domains can be observed in the phase diagram as shown in Fig. 6(c). Under DCP mode, the piezoelectric response amplitude of the sample is obtained. As shown in Fig. 6(e), the domain increases in the transverse direction, and the domain size is uneven and non-directional. The reversal of the non-180° domain is observed in the phase diagram as shown in Fig. 6(f). The amplitude diagram as shown in Fig. 6(h) and the phase diagram as shown in Fig. 6(i) obtained under ACP show an orderly and uniformly spaced folded band domain with a reduced domain size of about 30 nm. In the ACP process, with the change of the AC electric field, the nucleation of new domains is continuously produced, the domains begin to grow forward, and the process of the transverse motion of the domain wall in the crystal phase is produced, resulting in the decrease of the domain size and the increase of the domain wall density, which effectively increases the d33. In the DCP process, the DC electric field deflects the domain, but the domain size does not decrease, which means that the domain density does not increase.31–37 This again demonstrates that the periodic density increase of crystal domains after ACP is associated with the improved crystal piezoelectric performance.
 |
| | Fig. 6 Topography, piezoelectric response, and phase image of sample C (a–c) unpolarized, (d–f) under DCP, and (g–i) under ACP. | |
3.6 Transmittance
Relaxed ferroelectric single crystals have many domain walls and nano-regions with different orientations to the optical axis, which cause more scattering and losses at the domain boundaries, making the crystal less transmissive. The elimination of this scattering enhances the light transmission of the crystal to expand its application in the optics field.38 We tested the crystal after polarization to obtain the transmission spectrum shown in Fig. 7. The absorption edge of the PMNT:Pr crystal is 400 nm. In the 400–2000 nm wavelength range, three main absorption peaks are clearly observed at 1432 nm, 1550 nm and 1948 nm, corresponding to the characteristic transitions of Pr3+ from the ground state 3H4 to the excited states 3F4, 3F3 and 3F2, respectively. The transmittance of unpolarized (NOP) crystals is approximately 29–37%, that of DC polarized crystals is 33–51% and that of AC polarized crystals is 53–61%. The crystal transmittance increases after polarization because the single crystal in the DCP mode changes from the multi-domain state to the single-domain state in the (001) direction. The loss of the domain walls is greatly reduced and thus has a higher transmittance. Meanwhile, ACP can make the ferroelectric domains more periodic than DCP, thus further reducing the light scattering caused by the domain walls and improving the transmittance.30
 |
| | Fig. 7 The transmission spectra of crystals under NOP, ACP and DCP. Inset: The photograph of the corresponding PMNT:Pr crystal wafers. | |
3.7 Fluorescence properties
The fluorescence excitation emission spectrum of the PMNT:Pr crystal at room temperature is shown in Fig. 8(a). Four distinctive characteristic emission peaks of Pr3+ in the wavelength range of 520–700 nm are obtained at 451 nm excitation light, which are green emission at 530 nm, yellow emission at 549 nm, and red emissions at 620 nm and 651 nm, respectively. These peaks correspond to the 3P1 → 3H5, 3P0 → 3H5, 3P0 → 3H6 and 3P0 → 3F2 electronic energy level jumps of the Pr3+ ion, respectively. The 3P0 → 3F2 jump shows the strongest red emission at 651 nm. Correspondingly the energy level jumps of Pr3+ ions at 3H4 → 3P2 (448 nm), 3H4 → 3P1 (473 nm) and 3H4 → 3P0 (487 nm) are obtained under 651 nm light monitoring. The inset in Fig. 8(a) shows the PMNT:Pr crystal under 451 nm excitation light irradiation, and the crystal as a whole exhibit a uniform red light, indicating that Pr3+ is effectively incorporated into the PMNT lattice. The doped rare earth ions are in an asymmetric environment in the crystal. To investigate whether polarization can regulate the electric field inside the crystal and thus its photoluminescence, we compared the photoluminescence of the sample before and after AC/DC polarization. As can be seen from the excitation emission pattern of Fig. 8(b), the excitation emission peaks in the pre- and post-polarization samples do not change in peak position and shape, indicating that no phase transition occurs after polarization. However, the intensity of the luminescence peak is reduced after polarization because the internal domain boundary scattering of the crystal is reduced after polarization and the transmittance is enhanced, thus reducing the intensity of the fluorescence emission.
 |
| | Fig. 8 (a) Excitation emission spectrum of the PMNT:Pr crystal (inset is a photograph of the fluorescence emission from the PMNT:Pr crystal); (b) excitation emission spectra of PMNT:Pr crystals under no polarization, ACP and DCP; (c) emission spectra of PMNT:Pr crystals at different temperatures; (d) sketch of energy levels of Pr3+ ions and possible luminescence mechanisms in PMNT crystals. | |
In order to investigate the stability of the fluorescence emission of the PMNT:Pr crystal at different temperatures, we obtain the fluorescence emission at ambient temperatures from 143 K to 403 K as shown in Fig. 8(c). The intensity of the emission peak decreases significantly with the increase of temperature. This is because the increase of temperature has a certain thermal quenching effect on luminescence. Note that the red emission of 3P0 at 651 nm shows a uniform decrease with increasing temperature, and this temperature-sensitive luminescence change makes the PMNT:Pr crystal useful in temperature sensing. Fig. 8(d) shows the luminescence of Pr3+ in the PMNT crystal exhibiting the corresponding energy level jumping diagram. The electrons on the ground state 3H4 jump to 3P2 under the excitation of light, and then correspondingly jump from 3P2 to 3P1 and 3P0 without radiative relaxation, and finally from the P energy level down to different energy levels to obtain different emission peaks.
3.8 Quantum efficiency
In order to further analyze the luminescence properties of PMNT:Pr and explore the effect of polarization on the luminescence properties, we measure the internal quantum efficiency (IQE) of the same sample before and after polarization. Fig. 9(a–c) are the fluorescence excitation emission diagrams of PMNT:Pr before and after polarization under 451 nm excitation light, compared with the reference sample. According to the detected emission peaks, the following expression is used to estimate the IQE.39| |  | (1) |
where η, LS, ER, and ES are the internal quantum efficiency, the number of emitted photons of the sample, the number of excited photons of the sample and the number of excited photons of the reference sample, respectively. One can see that the values of ηNOP, ηDCP and ηACP under 451 nm excitation wavelength are 31%, 25% and 23%, respectively. Fig. 9(d) shows that the IQE decreases in the crystal after the polarization, which is related to the change in domain size and morphology in the crystal caused by the doping of Pr3+. After DC and AC polarization, the degree of domain ordering in the crystal increases and the electric domain size decreases, thus the internal quantum efficiency decreases.
 |
| | Fig. 9 Internal quantum efficiency spectra of the PMNT:Pr crystal under (a) unpolarized, (b) DC polarized and (c) AC polarized conditions. (d) Comparison of IQE under unpolarized and AC/DC polarization conditions. | |
4. Conclusion
A PMNT:Pr ferroelectric single crystal has been successfully grown by the seed-guided Bridgman method. By Pr3+ ion modification, the piezoelectric coefficient of the PMNT crystal after ACP is increased from 2000 pC N−1 to 2636 pC N−1. The influence of temperature on the dielectric performance shows that there are multiple phase transition dielectric peaks with the increase of temperature, and the dielectric constant and dielectric loss increase first and then decrease. The coercive field and remaining polarization of the polarized PMNT:Pr crystal increase to 4.15 kV cm−1 and 28.87 μC cm−2 at 30 kV, respectively. Further analysis of the electrical domain structure shows that the crystal domain with ordered period and uniform dimensions after AC polarization is beneficial to increase the piezoelectric coefficient. Meanwhile, the AC polarization increases the transmittance of the crystal. The fluorescence spectrum shows that the crystal can achieve down-conversion luminescence, and the red light emission of 3P0 at 651 nm shows uniform decreasing characteristics with the increase of temperature. This kind of temperature sensitivity makes the crystal have potential in temperature sensing, and the crystal is expected to become a new type of multifunctional crystal.
Data availability
Data available on request from the authors.
Conflicts of interest
The authors declare that they have no known competing financial interests or personal relationships that could have appeared to influence the work reported in this paper.
Acknowledgements
This paper is partially sponsored by the Yongjiang talent project (2021A-048-C). This work is also sponsored by the K. C. Wong Magna Foundation in Ningbo University.
References
- J. Zhang, W. Ren, X. Jing, P. Shi and X. Wu, Ceram. Int., 2015, 41, S656–S661 CrossRef CAS.
- R. Zhu, X. Li, Z. Fu, J. Chen, H. Xu and H. Luo, Ceram. Int., 2019, 45, 13354–13361 CrossRef CAS.
- T. F. Zhang, X. G. Tang, Q. X. Liu, Y. P. Jiang, X. X. Huang and Q. F. Zhou, J. Phys. D: Appl. Phys., 2016, 49, 095302 CrossRef.
- X. Li and H. Luo, J. Am. Ceram. Soc., 2010, 93, 2915–2928 CrossRef CAS.
- Y. Kaiden, M. Iwata, Y. Umeda, Y. Takikawa and Y. Tachi, Jpn. J. Appl. Phys., 2018, 57, 11UC01 CrossRef.
- J. Xu, H. Deng, Z. Zeng, Z. Zhang, K. Zhao, J. Chen, N. Nakamori, F. Wang, J. Ma, X. Li and H. Luo, Appl. Phys. Lett., 2018, 112, 182901 CrossRef.
- W.-Y. Chang, C.-C. Chung, C. Luo, T. Kim, Y. Yamashita, J. L. Jones and X. Jiang, Mater. Res. Lett., 2018, 6, 537–544 CrossRef CAS.
- R. Chen, Z. Chen, F. Hu, J. Jiao, W. Di, L. Lu and H. Luo, J. Magn. Magn. Mater., 2020, 512, 166976 CrossRef CAS.
- P. Ci, G. Liu, Z. Chen, S. Zhang and S. Dong, Appl. Phys. Lett., 2014, 104, 242911 CrossRef.
- Q. Zhou, K. H. Lam, H. Zheng, W. Qiu and K. K. Shung, Prog. Mater. Sci., 2014, 66, 87–111 CrossRef CAS PubMed.
- Q. Wang, C. Ma, F. Wang, B. Liu, J. Chen, H. Luo, T. Wang and W. Shi, Rev. Sci. Instrum., 2016, 87, 036105 CrossRef PubMed.
- M. Liu, S. Zhao, J. Liu, X. Han, X. Gao and F. Li, Appl. Phys. Lett., 2023, 122, 143903 CrossRef CAS.
- Z. Xi, A. He, P. Fang, X. Li and W. Long, J. Alloys Compd., 2017, 722, 375–380 CrossRef CAS.
- L. Xu, B. Su, Y. Hu, C. He, Z. Wang, X. Yang, X. Long and J. Fu, Cryst. Growth Des., 2019, 19, 4902–4907 CrossRef CAS.
- C. Cai, D. Zhang, W. Liu, J. Wang, S. Zhou, Y. Su, X. Sun and D. Lin, Materials, 2018, 11, 2392 CrossRef CAS.
- K. Li, S. Cong, H. Zheng, T. Wang, Z. Zhao, X. Qi and W. Gong, Mater. Lett., 2022, 317, 132127 CrossRef CAS.
- Y. Yao, L. Luo, W. Li, J. Zhou and F. Wang, Appl. Phys. Lett., 2015, 106, 082906 CrossRef.
- Y. Liu, Q. Li, L. Qiao, Z. Xu and F. Li, Adv. Sci., 2022, 9, 2204631 CrossRef CAS PubMed.
- Y. Dong, C. Zhuang, X. Ouyang, W. Lin, M. Yao, J. Lin and X. Yao, J. Eur. Ceram. Soc., 2023, 43, 6012–6020 CrossRef CAS.
- F. Li, D. Lin, Z. Chen, Z. Cheng, J. Wang, C. Li, Z. Xu, Q. Huang, X. Liao, L.-Q. Chen, T. R. Shrout and S. Zhang, Nat. Mater., 2018, 17, 349–354 CrossRef CAS.
- F. Li, M. J. Cabral, B. Xu, Z. Cheng, E. C. Dickey, J. M. LeBeau, J. Wang, J. Luo, S. Taylor, W. Hackenberger, L. Bellaiche, Z. Xu, L.-Q. Chen, T. R. Shrout and S. Zhang, Science, 2019, 364, 264–268 CrossRef CAS PubMed.
- J. Zhang, Z. Xi, X. Wang, H. Feng, W. Long and A. He, Crystals, 2021, 11, 1155 CrossRef CAS.
- J. Zhang, Z. Xi, X. Wang, S. Gao, X. Long and F. Guo, Crystals, 2022, 12, 225 CrossRef CAS.
- J. Liu, C. Qiu, L. Qiao, K. Song, H. Guo, Z. Xu and F. Li, J. Appl. Phys., 2020, 128, 094104 CrossRef CAS.
- H. Wan, C. Luo, C.-C. Chung, Y. Yamashita and X. Jiang, Appl. Phys. Lett., 2021, 118, 102904 CrossRef CAS.
- X. Zhu, C. He, Y. Wen, C. Deng, Q. Li, Z. Chen, H. Chen, Y. Lu and Y. Liu, J. Lumin., 2022, 252, 119419 Search PubMed.
- Y. Zhou, K. Zhao, W. Ruan, J. Zeng, L. Zheng, G. Li and S. Zhang, J. Am. Ceram. Soc., 2016, 99, 3993–3999 Search PubMed.
- Q. Li, Y. Liu, J. Liu, K. Song, H. Guo, F. Li and Z. Xu, Adv. Funct. Mater., 2022, 32 Search PubMed.
- J. Chen, X. Li, X. Zhao, X. A. Wang, C. Chen, H. Deng, B. Ren, J. Jiao and H. Luo, J. Mater. Sci.: Mater. Electron., 2015, 26, 9316–9328 Search PubMed.
- F. Liao, Y. Zhao, Z. Chen, Y. Zheng and H. Chen, Crystals, 2021, 11, 402 CrossRef CAS.
- H. Hang, X. Jiang, D. Lin, F. Wang, X. A. Wang and H. Luo, Curr. Appl. Phys., 2023, 47, 1–8 CrossRef.
- Y. Qin, J. Zhang, W. Yao, C. Lu and S. Zhang, ACS Appl. Mater. Interfaces, 2016, 8, 7257–7265 CrossRef CAS.
- R. Chen, Y. Wang, W. Di, H. Luo, L. Lu and J. Jiao, Sens. Actuators, A, 2021, 331, 112905 CrossRef CAS.
- F. Han, Y. Qin, Y. Zhang, P. Yan, Y. Wang, P. Guo and F. Li, Ceram. Int., 2022, 48, 23061–23071 CrossRef CAS.
- J. Xu, H. Deng, Z. Zeng, Z. Zhang, K. Zhao, J. Chen, N. Nakamori, F. Wang, J. Ma, X. Li and H. Luo, Appl. Phys. Lett., 2018, 112, 182901 CrossRef.
- H. Wan, C. Luo, C.-C. Chung, Y. Yamashita and X. Jiang, Appl. Phys. Lett., 2021, 118, 102904 CrossRef CAS.
- Z. Zhang, J. Xu, L. Yang, S. Liu, J. Xiao, R. Zhu, X. Li, X. A. Wang and H. Luo, J. Appl. Phys., 2019, 125, 034104 CrossRef.
- S. Yan, Z. Sun, X. Chen, H. Qian, T. Zhao, H. Chen and L. Jiang, J. Phys. Chem. Solids, 2023, 173, 111103 CrossRef CAS.
- L. Zhou, P. Du, W. Li and L. Luo, New J. Chem., 2019, 43, 16445–16453 RSC.
|
| This journal is © The Royal Society of Chemistry 2025 |
Click here to see how this site uses Cookies. View our privacy policy here. 
 *a
*a


