 Open Access Article
 This Open Access Article is licensed under a Creative Commons Attribution-Non Commercial 3.0 Unported Licence
Effect of alkali ions on optical properties of flavins: vibronic spectra of cryogenic M+lumiflavin complexes (M = Li–Cs)†
David
Müller
a,
Pablo
Nieto
a,
Mitsuhiko
Miyazaki
 ab and
Otto
Dopfer
*ac
ab and
Otto
Dopfer
*ac
aInstitut für Optik und Atomare Physik, Technische Universität Berlin, Hardenbergstr. 36, 10623 Berlin, Germany. E-mail: dopfer@physik.tu-berlin.de; Fax: +49 30 314 23018
bLaboratory for Chemistry and Life Science, Institute of Innovation Research, Tokyo Institute of Technology, 4259, Nagatsuta-cho, Midori-ku, Yokohama, Japan
cTokyo Tech World Research Hub Initiative (WRHI), Institute of Innovation Research, Tokyo Institute of Technology, 4259, Nagatsuta-cho, Midori-ku, Yokohama, Japan
First published on 7th January 2019
Abstract
Flavin compounds are frequently used by nature in photochemical processes because of their unique optical properties which can be strongly modulated by the surrounding environment such as solvation or coordination with metal ions. Herein, we employ vibronic photodissociation spectroscopy of cryogenic M+LF complexes composed of lumiflavin (LF, C13H12N4O2), the parent molecule of the flavin family, and alkali ions (M = Li–Cs) to characterize the strong impact of metalation on the electronic properties of the LF chromophore. With the aid of time-dependent density functional theory calculations (PBE0/cc-pVDZ) coupled to multidimensional Franck–Condon simulations, the visible photodissociation (VISPD) spectra of M+LF ions recorded in the 500–570 nm range are assigned to the S1 ← S0 (ππ*) transitions into the first optically bright S1 state of the lowest-energy M+LF(O4+) isomers. In this O4+ structure, M+ binds in a bent chelate to the lone pairs of both the O4 and the N5 atom of LF. Charge reorganization induced by S1 excitation strongly enhances the interaction between M+ and LF at this binding site, leading to substantial red shifts in the S1 absorption of the order of 10–20% (e.g., from 465 nm in LF to 567 nm in Li+LF). This strong change in M+⋯LF interaction strength in M+LF(O4+) upon ππ* excitation can be rationalized by the orbitals involved in the S1 ← S0 transition and causes strong vibrational activity. In particular, progressions in the intermolecular bending and stretching modes provide an accurate measure of the strength of the M+⋯LF bond. In contrast to the experimentally identified O4+ ions, the predicted S1 origins of other low-energy M+LF isomers, O2+ and O2, are slightly blue-shifted from the S1 of LF, demonstrating that the electronic properties of metalated LF not only drastically change with the size of the metal ion but also with its binding site.
Introduction
In addition to amino acids, DNA bases, and carbohydrates, flavins are an important class of biomolecules. Flavins are yellow dye molecules (“flavus” means yellow in Latin) derived from the tricyclic heteroaromatic 7,8-dimethyl-10-alkyl-isoalloxazine chromophore and differ by the alkyl substituent R at the N10 position (Fig. 1). The most important members of the flavin family are lumiflavin (LF, R = CH3, C13H12N4O2, 7,8-dimethyl-10-methyl-isoalloxazine), riboflavin (RF, R = ribityl) also known as vitamin B2, the cofactor flavin mononucleotide (FMN, R = ribophosphate), and the co-enzyme flavin adenine dinucleotide (FAD, R = ribophosphate + adenine). The parent molecule, iso-lumichrome (iso-LC, R = H) is a metastable tautomer and occurs in the most stable structure as lumichrome (LC), in which the H atom of N10 is transferred to N1. For this reason, LF is often considered as the most simple stable flavin.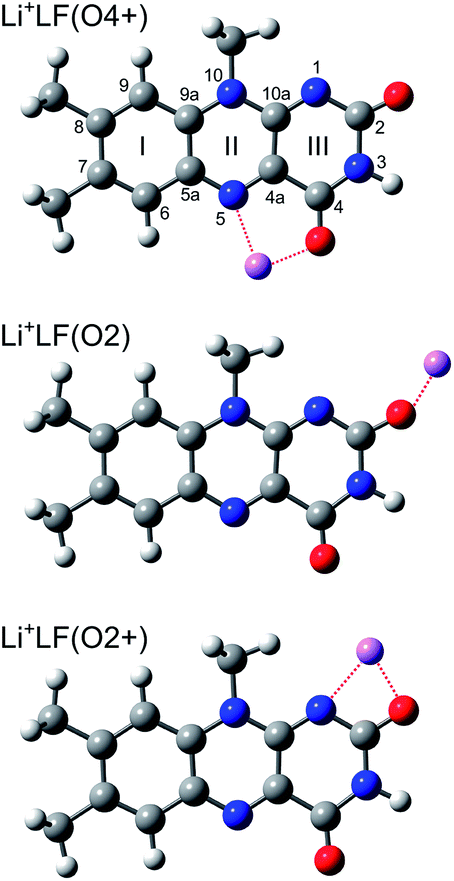 | ||
| Fig. 1 Structures of relevant M+LF isomers calculated at the PBE0/cc-pVDZ level of theory illustrated for M = Li, along with atom and ring numbering. N/O atoms are indicated in blue/red colour. | ||
The isoalloxazine chromophore absorbs in a wide optical range, and the details of the optical spectrum and resulting photochemistry strongly depend on many intrinsic and environmental factors, including (1) the oxidation, protonation, and metalation states, (2) the substituent R, (3) solvation, and (4) coordination with counter ions. This strong modulation in the optical properties of flavins and flavoproteins is used by nature in various fundamental photochemical processes, in biocatalysis, and in redox reactions.1–5 For instance, they are involved in blue-light receptors (BLUF), in light-oxygen-voltage (LOV) sensing, in processes of the respiratory chain, in the enzymatic oxidation of glucose, and in the repair process of DNA. Two Nobel prizes in chemistry are strongly related to flavins. The first one was awarded in 1937 to Karrer for the synthesis and structural analysis of flavin compounds. The second one was awarded in 2015 to Lindahl, Modrich, and Sancar for unravelling the mechanism of DNA repair, which involves the fully reduced flavoprotein FADH−. A number of biochemical processes of flavins are based on their strong interactions with coordinating metal ions.6–15
Due to their importance, numerous studies have characterized the absorption properties of flavins by a variety of spectroscopies in the condensed phase (absorption, emission, time-resolved spectroscopy)16–19 and quantum chemical calculations.16,20–25 These studies reveal that the excited-state photochemistry and absorption of flavins from the ground electronic state (S0) are controlled by optically bright ππ* excitations of the aromatic π electron system and essentially dark nπ* states involving the excitation of electrons from in-plane lone pairs of the various O and N heteroatoms. Some of these transitions are strongly affected by solvation and protonation. Concerning LF, the S1 state observed near 450 nm is assigned to the first allowed ππ* state, and calculations predict a large geometry change upon electronic excitation. As a result, there is a large difference between the vertical and adiabatic transition energies (of around 50 nm or 0.3 eV), implying that vibronic excitation and temperature have a substantial impact on the position, shape, and width of the S1 absorption band.25 Indeed, the absorption spectra observed in the condensed phase at room temperature are broad and unresolved, and thus do not provide reliable and precise information and understanding of the effects of the environment on the optical properties of flavins at the molecular level. Significantly, optical spectra of LF derivatives recorded at 4 K in an n-decane matrix (single crystals, Shpolskii method) show that low temperatures are required to obtain vibrationally resolved optical spectra with sharp rovibronic transitions.26
Because of the strong dependence of the optical spectra on the environment, the intrinsic properties of the active flavin chromophore must be determined by the spectroscopy of molecules isolated in the gas phase. However, such studies are scarce, mainly because of the difficulties involved in generating cold flavin molecules and their ions and complexes in the gas phase. To this end, we recently started a research program to systematically characterize the geometric and electronic properties of flavin ions in their protonated, metalated, and microsolvated states by infrared and optical photodissociation spectroscopy coupled to electrospray ionization (ESI) techniques for ion generation in the gas phase.27–32 Apart from our contributions to flavin spectroscopy summarized below, a few other studies on isolated flavins have appeared recently. The pioneering fluorescence spectrum of LF embedded in He droplets (T = 0.4 K) exhibits vibrational resolution and was assigned to the S1 ← S0 (ππ*) transition by comparison to quantum chemical calculations coupled to multidimensional Franck–Condon (FC) simulations.33 The authors estimate that the S1 origin observed at 21![[thin space (1/6-em)]](https://www.rsc.org/images/entities/char_2009.gif) 511 cm−1 (464.88 nm) is shifted by less than 1% upon the weak interaction with the He droplet. Optical spectra of room temperature cations and anions have recently been reported for FAD mono- and dianions,34–36 alloxazine and LC anions,37 protonated alloxazine,38 and a flavin derivative with a protonated amino side chain.39 Significantly, all these latter studies report only optical spectra with very broad absorption bands because vibronic resolution cannot be obtained at elevated temperature (T = 300 K).32 As a consequence, the spectral information about shifts and (de-)protonation sites, etc. is quite limited, and the interpretation relies heavily on quantum chemical calculations which may not always produce reliable quantitative predictions.
511 cm−1 (464.88 nm) is shifted by less than 1% upon the weak interaction with the He droplet. Optical spectra of room temperature cations and anions have recently been reported for FAD mono- and dianions,34–36 alloxazine and LC anions,37 protonated alloxazine,38 and a flavin derivative with a protonated amino side chain.39 Significantly, all these latter studies report only optical spectra with very broad absorption bands because vibronic resolution cannot be obtained at elevated temperature (T = 300 K).32 As a consequence, the spectral information about shifts and (de-)protonation sites, etc. is quite limited, and the interpretation relies heavily on quantum chemical calculations which may not always produce reliable quantitative predictions.
In the past few years, our group has applied infrared and optical photodissociation spectroscopy to mass-selected flavin ions, with the aim of characterizing the geometric, vibrational, and electronic structure of a number of protonated and metalated flavins ranging from LC to FMN in the electronic ground and first excited singlet states (S0, S1).27–32 The flavin ions are generated by ESI in the gas phase and subsequently studied by (1) infrared multiple-photon dissociation (IRMPD) in an Fourier-transform ion cyclotron resonance mass spectrometer27–29 and (2) by electronic photodissociation in the visible range (VISPD) in a cryogenic ion trap coupled to a quadrupole/time-of-flight tandem mass spectrometer (BerlinTrap).30–32 Significantly, these studies report the first (and to date only) vibrationally-resolved spectra of flavins isolated in the gas phase, and thus provide for the first time reliable experimental information about protonation and metalation sites as well as their impact on the electronic properties. The IRMPD spectra recorded at room temperature display sufficient vibrational resolution to determine the preferred protonation and metalation sites of the flavins in the S0 state by comparison to quantum chemical density functional theory (DFT) calculations.27–29 In contrast, vibronic resolution in electronic VISPD spectra of such ions can only be achieved at temperatures well below 100 K because only then can extensive spectral congestion from hot bands be avoided.30–32,40,41 In general, these studies reveal that the preferred protonation and metalation sites strongly depend on the substituent R of the flavin as well as the size and type of the metal ion, as illustrated for the alkali and coinage metal ions, M = Li–Cs and Cu–Au.30–32 The most thoroughly studied so far are cations derived from LC and LF. IRMPD spectra demonstrate that protonation preferentially occurs at N5 in H+LC and at O2 in H+LF, in line with computational predictions at the B3LYP/cc-pVDZ level.27 The two major metalation sites observed for M+LC and M+LF with alkali atoms M = Li–Cs are the two CO groups, leading to the O4+ and O2(+) isomers shown in Fig. 1 for the case of Li+LF.27–29 Their relative energies and bonding characteristics depend sensitively on the size of the alkali ion. The optical VISPD spectra of H+LC and M+LC with M = Li–Cs observed in the 400–500 nm range are attributed to the lowest ππ* excitation (S1) of the N5 protomer of LC, H+LC(N5), and the O4+ isomer of M+LC, M+LC(O4+).30–32 Significantly, massive red shifts ranging from ∼2400 (Cs+) to around ∼6000 cm−1 (H+) observed for the adiabatic S1 origins of the O4+ and N5 ions indicate the strong impact of metalation and protonation on the electronic structure of this prototypical flavin. On the other hand, calculations demonstrate that metalation/protonation at the O2(+) binding site has only a minor impact on the S1 origin energies, illustrating that the binding site of M+/H+ is also an important parameter in tuning the electronic properties. Time-dependent DFT (TD-DFT) calculations at the PBE0/cc-pVDZ level provide accurate predictions for both the S1 origin positions (to within 0.1 eV) and the vibrational analysis using FC simulations.30–32 As a result, the changes in the proton affinity of LC and the M+⋯LC interaction strength are accurately probed by the corresponding electronic energy shifts and vibrational frequencies, demonstrating the high and reliable information content of the vibronic excitation spectra.
Herein, we continue our series of studies to VISPD spectroscopy of M+LF ions to probe the impact of the alkali ions Li–Cs on the electronic structure of LF using the same experimental and computational approach as used for H+/M+LC.30–32 In contrast to the previous IRMPD data on M+LF,29 their VISPD spectra are highly isomer-selective, because the locations of the electronic transitions in the optical spectrum strongly depend on the M+ binding site. The analysis by TD-DFT calculations reveals similarities and differences between M+LF and M+LC.
Experimental and computational details
Vibronic VISPD spectra of mass-selected M+LF ions are obtained in a cryogenic ion trap tandem mass spectrometer (BerlinTrap) described in detail elsewhere.30 The major components of this setup include (1) an ESI source for ion production, (2) a mini-quadrupole for ion accumulation, (3) a quadrupole mass spectrometer for filtering the M+LF ions under investigation, (4) a cryogenic 22-pole ion trap for storing and cooling the ions employing He buffer gas, and (5) a reflectron time-of-flight mass spectrometer for the analysis of the fragment ions generated by photodissociation of parent ions. M+LF ions (M = Li–Cs) are produced in the ESI source by spraying a suitable mixture at a constant flow rate of 2 ml h−1. The solution is prepared by dissolving 1 mg LF (Sigma Aldrich, >99%) and 2–4 mg alkali metal chloride salt (MCl, Sigma Aldrich, >99%) in 20 ml methanol and 1 ml water. The resulting ions are accumulated for 90 ms in a short mini-quadrupole located after the skimmer. After passing through a hexapole, the desired M+LF ions are selected by a tuneable quadrupole mass spectrometer and guided through an octupole into the cryogenic 22-pole trap mounted onto the coldhead of a cryostat held at 6 K. Here, the M+LF ions are trapped for 90 ms and cooled down to a (ro)vibrational temperature of around 20 K by He buffer gas introduced into the trap by a pulsed piezo valve.30 After extraction out of the 22-pole trap, the cold M+LF ions are guided by a series of einzel lenses into the extraction region of an orthogonal reflectron time-of-light mass spectrometer, where they are irradiated by visible photons emitted from a pulsed optical parametric oscillator (OPO) laser. The OPO laser (GWU, Versa-Scan) is pumped by the third harmonic of a nanosecond Q-switched Nd:YAG laser (Innolas, Spitlight 1000, 180 mJ per pulse at 355 nm) and delivers visible light pulses (beam diameter of 5 mm) with a bandwidth of around 4 cm−1 and an energy of up to 3 mJ in the spectral range 500–570 nm. The repetition rates of both the laser and BerlinTrap mass spectrometer are 10 Hz. Photodissociation occurs just before the extraction zone of the reflectron (ca. 10 μs before the ion extraction pulse). Hence, both parent and fragment ions can be detected with high transmission using a microchannel plate detector. The VISPD action signal is obtained by linearly normalizing the fragment ion signal by the parent ion signal and the laser intensity monitored simultaneously with the ion signals. Scans are taken in wavelength steps of 0.02 nm (corresponding to 0.8 cm−1 at 500 nm), and 50 mass spectra are averaged at each wavelength which is calibrated by a wavemeter. For all M+LF ions, the only fragmentation process observed upon VISPD is dissociation into M+ + LF (Fig. S1 in ESI†). The photodissociation efficiency is of the order of a few % for strong transitions. The typical width of the transitions observed is in the range 5–10 cm−1, and arises from the bandwidth of the laser (∼4 cm−1), unresolved rotational substructure, overlapping vibronic transitions, and possibly lifetime broadening.The experimental VISPD spectra of M+LF are interpreted with the aid of quantum chemical calculations.42 To this end, DFT calculations at the PBE0/cc-pVDZ level of theory are employed to optimize the electronic ground state (S0) of LF and M+LF. Subsequently, the vertical excitation energies of the first four excited singlet states (S1–S4) are determined using TD-DFT at the same level of theory to roughly estimate their relative energies. Finally, the S1 excited states are optimized using the corresponding S0 structures as starting geometries. The efficient but reliable PBE0/cc-pVDZ level was previously employed for corresponding calculations of the related H+LC and M+LC ions and resulted in good agreement with experimental data for both vibrational and electronic energies.31,32 Test calculations with the larger cc-pVTZ basis set yield essentially the same results. Relativistic corrections for the heavier alkali metals (K-Cs) are included using the Stuttgart effective core potentials.43 Harmonic frequency analysis is employed to ensure that the stationary points located on the potential are indeed minima. All reported binding energies (D0) and relative energies (E0) are corrected for the harmonic zero-point vibrational energy. Vibronic absorption stick spectra are obtained by multidimensional FC simulations (T = 0 K) using PGOPHER.44 The orbitals contributing the most to each respective electronic excitation are determined using the natural transition orbital (NTO) approach.45 The atomic charge distribution in the ground and excited electronic states is evaluated by employing natural bond orbital (NBO) analysis.46 In both experiment and computation, only the monoisotopic species are considered.
Results and discussion
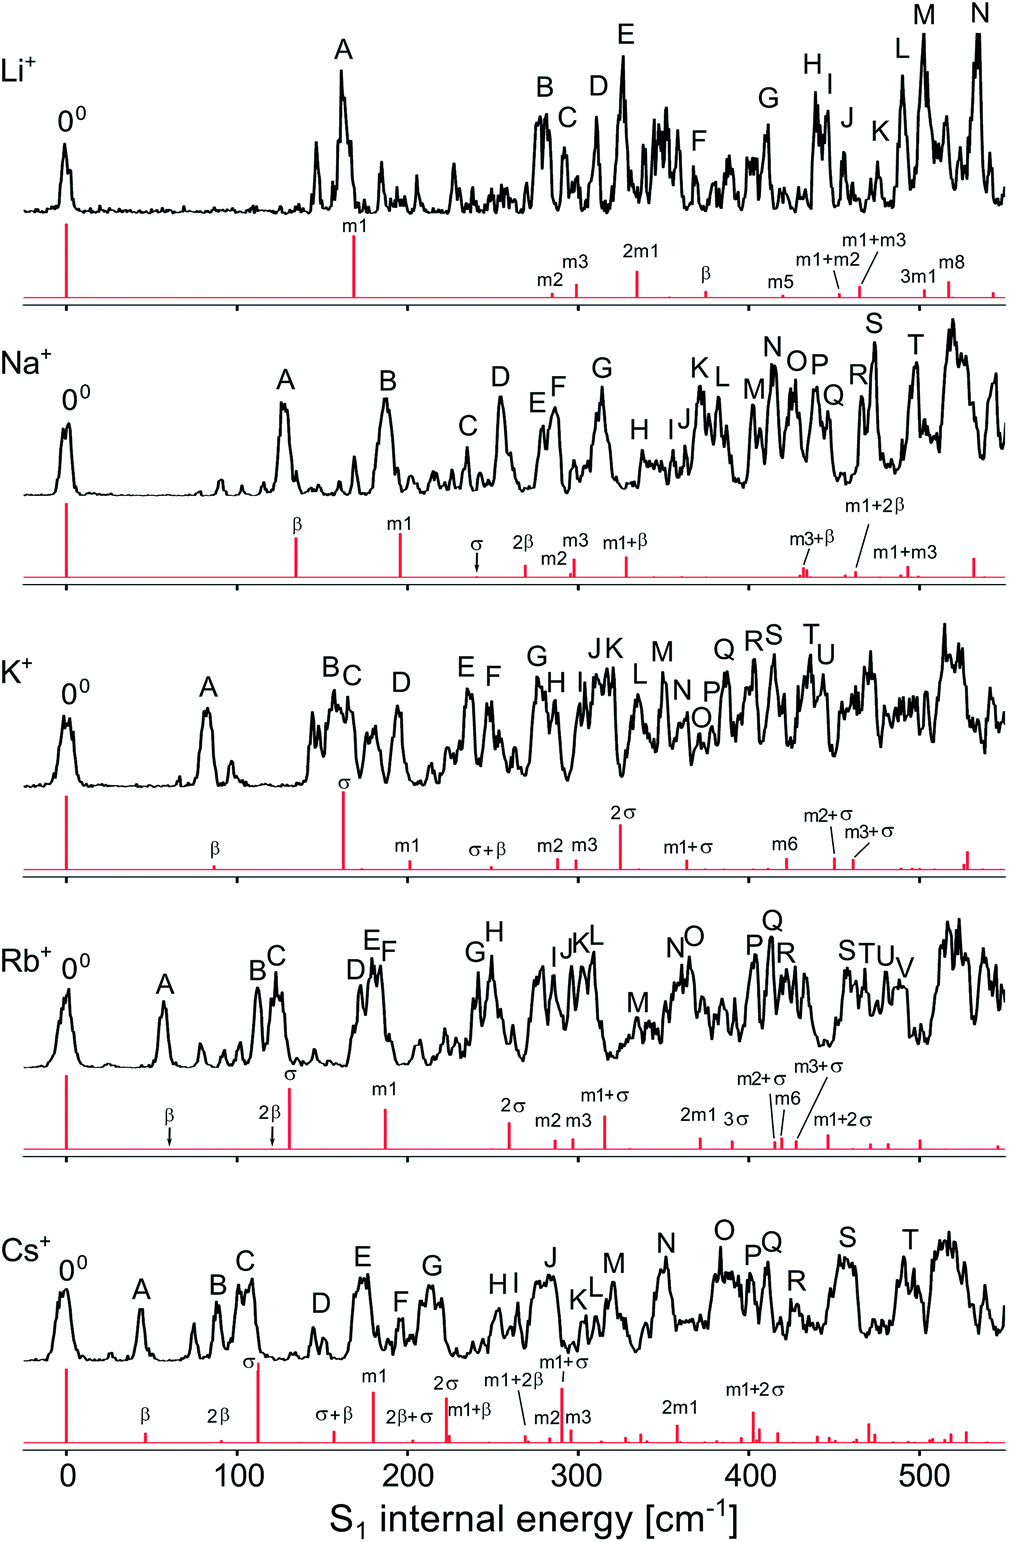
Overview VISPD spectra of the S1 ← S0 transition for all investigated M+LF ions recorded in the M+ fragment channel in the range 17500–20000 cm−1 (570–500 nm, 2.2–2.5 eV) are shown in Fig. 2. As can be seen, cooling the ions in the trap down to below 20 K is sufficient to efficiently suppress the appearance of hot bands and to achieve vibrational resolution even for such large biomolecules. The S1 ← S0 transitions exhibit sharp and intense S1 origins (00) accompanied by long and intense vibrational progressions, indicative of substantial changes in the geometries upon electronic ππ* excitation. The S1 origin transitions of M+LF observed at 17645, 18310, 18778, 18914, and 19031 cm−1 for M = Li–Cs, respectively (Table 1) exhibit a strong dependence on the M+ ion. In Fig. 3, these S1 origins are plotted versus the inverse ionic radius of M+ (1/RM),29,47 and a nearly linear dependence is observed. This result is expected because the attractive interaction between M+ and LF mainly arises from electrostatic forces, thus explaining the linear dependence of the S1 origins on 1/RM according to the Coulomb law.32 Unfortunately, the corresponding S1 ← S0 transition of bare LF has not been measured yet due to the difficulties involved in the production of cold LF molecules in the gas phase. However, the fluorescence spectrum of LF embedded in He droplets has been reported and its S1 origin occurs at 21511 cm−1.33 This value should be close to the S1 origin of free LF because the interaction of a neutral molecule with the surrounding He droplet is small, leading to estimated shifts of less than 1% (<250 cm−1).33 Indeed, the extrapolation of the measured S1 origins of M+LF to 1/RM = 0 (i.e., RM → ∞, no metal) in Fig. 3 is consistent with this view. Hence, we use in the following the He droplet value for LF as the reference point for S1 of bare LF to evaluate ΔS1 shifts upon complexation with M+. Following this strategy, the ΔS1 origin shifts amount to −2480 (Cs), −2597 (Rb), −2733 (K), −3201 (Na), and −3866 (Li) cm−1, i.e. they strongly increase with the M+⋯LF interaction. These large red shifts are quite substantial (11.5, 12.1, 12.7, 14.9, 18.0%) and indicate that electronic excitation has a drastic impact on the strength of the M+⋯LF interaction, in line with the large FC activity in the S1 ← S0 transitions.
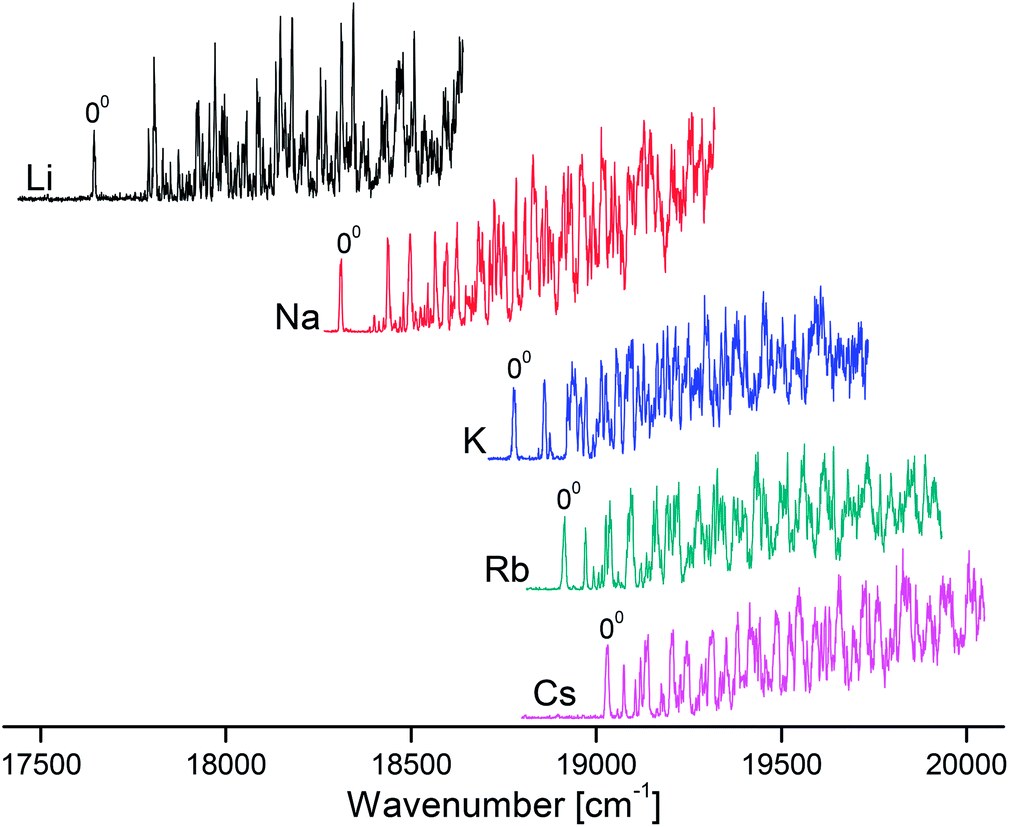 | ||
| Fig. 2 Overview VISPD spectra recorded for M+LF (M = Li–Cs) in the M+ fragment channel at a trap temperature of T = 6 K. The origins (00) of the S1 ← S0 (ππ*) transitions assigned to the O4+ isomer are indicated. | ||
| Isomer | S1 ← S0 | ΔS1 | Isomer | S1 ← S0 | ΔS1 |
|---|---|---|---|---|---|
| a Value of LF in He droplet (ref. 33). | |||||
| LF(exp) |
21![[thin space (1/6-em)]](https://www.rsc.org/images/entities/b_char_2009.gif) 511 511
|
0 | K + LF(exp) |
18778
|
−2733 |
| LF | 22450 |
0 | K+LF(O4+) | 19279 |
−3171 |
| Li + LF(exp) |
17645
|
−3866 | K+LF(O2+) | 23482 |
1032 |
| Li+LF(O4+) | 18022 |
−4428 | K+LF(O2) | 23208 |
758 |
| Li+LF(O2+) | 23341 |
891 | Rb + LF(exp) |
18914
|
−2597 |
| Li+LF(O2) | 23137 |
687 | Rb+LF(O4+) | 19451 |
−2999 |
| Na + LF(exp) |
18310
|
−3201 | Rb+LF(O2) | 23176 |
726 |
| Na+LF(O4+) | 18784 |
−3666 | Cs + LF(exp) |
19031
|
−2480 |
| Na+LF(O2+) | 23498 |
1048 | Cs+LF(O4+) | 19658 |
−2792 |
| Na+LF(O2) | 23208 |
758 | Cs+LF(O2) | 23160 |
710 |
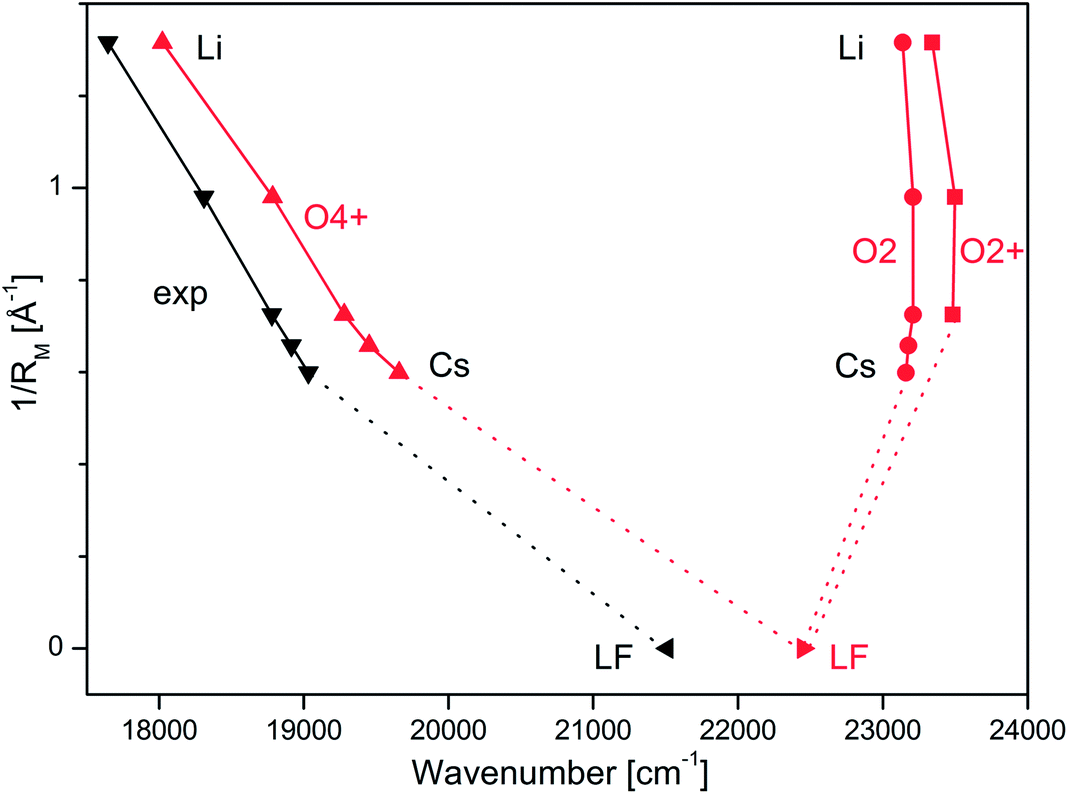 | ||
| Fig. 3 Experimental S1 origins extracted from the VISPD spectra of M+LF compared to adiabatic S1 origin energies of the O4+ and O2(+) isomers of M+LF calculated at the PBE0/cc-pVDZ level plotted as a function of the inverse ionic radius of the metal ion (1/RM). The M+LF ions with M = Rb and Cs do not have a stable O2+ structure. The experimental value for LF is taken from the He droplet spectrum.33 | ||
To identify the M+LF isomers responsible for the VISPD spectra in Fig. 2, we first calculate the ground state geometries and adiabatic S1 origins of low-energy M+LF structures. LF offers a variety of attractive binding sites for M+ cations, namely the lone pairs of the O and N atoms, as well as the aromatic π-electron system. In our previous IRMPD and computational study on M+LF ions,29 the most stable structures calculated at the B3LYP/cc-pVDZ level are the O4+, O2+, and O2 isomers shown in Fig. 1. In the O4+ and O2+ ions, M+ forms strongly bent N–M–O chelates (N5–M–O4, N1–M–O2), which benefit from the interaction of M+ with the lone pairs of both N and O. In contrast, in the O2 ions, the M+ ions form a nearly linear bond to the C–O2 carbonyl group. In Table 2, the binding and relative energies of these isomers obtained at the B3LYP/cc-pVDZ level29 are compared to those derived here at the PBE0/cc-pVDZ level, and good agreement is observed. As expected, the binding energies strongly decrease with the size of the M+ ion (e.g., from 300 to 144 kJ mol−1 for the O4+ isomer of Li and Cs, respectively). For M+LF with M = Li and Na, the O4+ isomer is the global minimum and the O2+ and O2 isomers are clearly less stable local minima with relative energies of E0 = 5–20 kJ mol−1. In contrast, for M = K–Cs, the energy spread of all the considered isomers is smaller (<3 kJ mol−1), and the O2 isomer is either slightly more stable than, or isoenergetic with, the O4+ isomer. For the larger alkali ions Cs+ and Rb+, the O2+ isomer is not stable, probably because of the repulsive interaction of the bulky M+ ion with the CH3 group at N10. This steric interaction between M+ and the CH3 groups implies that the O2+ isomers for the smaller alkali ions do not have Cs symmetry because the CH3 group rotates out of the plane. In contrast, the geometries of the O4+ and O2 isomers have Cs symmetry. Details of the computed structures and vibrational frequencies in the S0 state are discussed elsewhere.29 Experimentally, the IRMPD spectra of M+LF produced by ESI provide clear evidence for the presence of the O4+ and O2(+) isomers for M = Li–K, while for M = Cs only the O2 isomer is clearly identified at room temperature.29 No experimental information is available for Rb+LF.
| Isomer | PBE0/cc-pVDZ | B3LYP/cc-pVDZa | ||
|---|---|---|---|---|
| D 0 | E 0 | D 0 | E 0 | |
| a Ref. 29. | ||||
| Li+LF(O4+) | 300.1 | 0.0 | 308.6 | 0.0 |
| Li+LF(O2+) | 289.5 | 10.6 | 296.7 | 11.9 |
| Li+LF(O2) | 279.7 | 20.4 | 288.6 | 20.0 |
| Na+LF(O4+) | 219.7 | 0.0 | 226.1 | 0.0 |
| Na+LF(O2+) | 214.2 | 5.5 | 218.9 | 7.2 |
| Na+LF(O2) | 209.5 | 10.2 | 214.7 | 11.4 |
| K+LF(O4+) | 176.0 | 0.0 | 180.2 | 0.5 |
| K+LF(O2+) | 175.5 | 0.5 | 179.0 | 1.7 |
| K+LF(O2) | 175.9 | 0.1 | 180.7 | 0.0 |
| Rb+LF(O4+) | 157.9 | 1.0 | 159.4 | 2.1 |
| Rb+LF(O2) | 158.9 | 0.0 | 161.5 | 0.0 |
| Cs+LF(O4+) | 143.9 | 2.9 | 145.8 | 2.4 |
| Cs+LF(O2) | 146.8 | 0.0 | 148.2 | 0.0 |
The first excited S1 state of LF and M+LF involved in the S1 ← S0 transition corresponds to an optically bright ππ* excitation of a π electron from the HOMO to the LUMO. The adiabatic S1 origins predicted for LF and the O4+ and O2(+) isomers of M+LF are compared in Table 1 and Fig. 3 to the experimental values extracted from the He droplet spectrum (LF)33 and the VISPD spectra (M+LF). Clearly, the S1 origins computed for the O4+ isomers fit the experimental values very well, with respect to both the absolute values and the dependence on 1/RM. The computed S1 energies of M+LF are systematically larger than the experimental ones by only 377–627 cm−1 for Li–Cs, which corresponds to 2.1–3.3% of the transition energy. The maximum deviation of 0.08 eV is small for excited state transition energies, indicating that the employed computational level describes the electronic properties of LF well. Similar good performance of this functional has previously been observed for the electronic states of the related H+LC and M+LC ions.31,32 The difference for bare LF is somewhat larger (939 cm−1), which may be due to the effect of the surrounding He droplet. In contrast to the O4+ ions, the S1 energies calculated for the O2(+) isomers are much higher than the experimental ones (up to 5696 cm−1, 0.71 eV, 32%) and do not depend much on 1/RM (23137–23498 cm−1). In addition, they are blue-shifted from the value for LF (by 687–1048 cm−1). Hence, from comparison of the experimental and computational S1 origin energies, the assignment of the experimental VISPD spectra in Fig. 2 can only be to the O4+ isomers. We can safely exclude the other low-energy O2(+) isomers, which are predicted to absorb near 23000 cm−1 (435 nm), i.e. at much higher energy than the O4+ isomers (17600–20000 cm−1, 570–500 nm). Overall, the data in Fig. 3 demonstrate that the electronic properties of M+LF depend drastically on the site of metalation and on the size of M+.
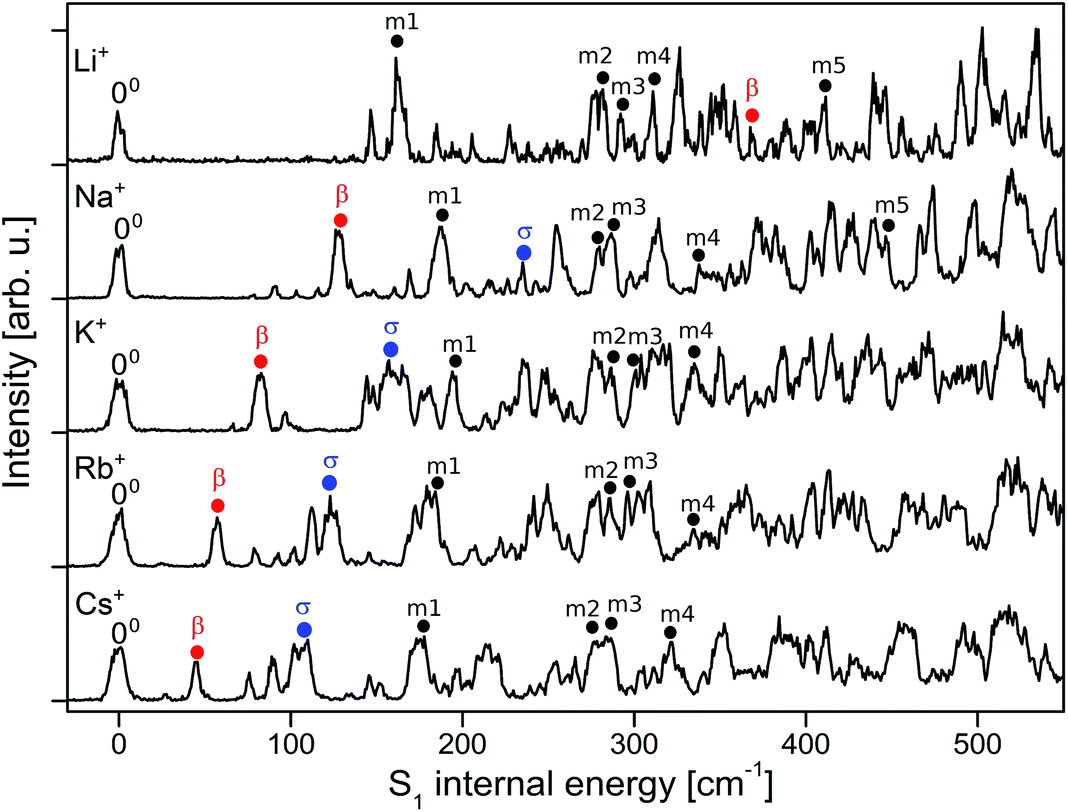
To analyse the vibrational structure in the S1 ← S0 transitions attributed to M+LF(O4+), they are plotted in Fig. 4 as a function of the S1 internal energy. Similar to the corresponding spectra of M+LC(O4+),32 the spectra are dominated by progressions in low-frequency intermolecular M+⋯LF in-plane bend and stretch modes (β and σ), which strongly vary with M+, and higher-frequency intramolecular in-plane skeleton modes of the LF chromophore (denoted m1, m2, …), which are relatively independent of M+. In an effort to assign the vibronic bands observed in the S1 ← S0 transitions attributed to M+LF(O4+), we carried out FC simulations, with the major goal of extracting the informative β and σ frequencies. These FC simulations are compared in Fig. 5 to the VISPD spectra for the assigned O4+ isomers. The positions of major peaks observed in the VISPD spectra are listed in Table S1 in the ESI,† along with the assignment suggested by the FC simulations. Corresponding simulations for the O2(+) isomers are available in Fig. S2 in the ESI.† Clearly, the FC calculations strongly support the assignment of the VISPD spectra to the O4+ isomers. The FC simulations for O2(+) fit much worse, providing further evidence – in addition to the S1 origin positions – that these isomers cannot be responsible for the measured VISPD spectra.
 | ||
| Fig. 4 Expanded view of the experimental VISPD spectra of M+LF (M = Li–Cs) in the vicinity of the S1 origin as a function of the S1 internal energy, along with selected vibrational assignments of the O4+ isomers (Table S1 in ESI†). | ||
 | ||
| Fig. 5 Experimental VISPD spectra of M+LF (M = Li–Cs) compared to FC simulations for the M+LF(O4+) isomers as a function of the S1 internal energy (Table S1 in ESI†). | ||
As expected from the Cs symmetry of the M+LF(O4+) ions with the planar tricyclic aromatic ring, the FC simulations contain only progressions and combination bands of in-plane modes with a′ symmetry. Overtones and even combination bands of out-of-plane a′′ fundamentals have essentially no FC activity. Closer inspection of Fig. 5 and Table S1† reveals that indeed nearly all low-frequency a′ modes have significant FC intensity and are assigned. In the following, we concentrate on the β and σ modes, because they probe the M+⋯LF interaction (Table 3). Similar to M+LC(O4+), the progressions in σ are well reproduced by the FC calculations, while the intensities predicted for the progressions in β are substantially smaller than the observed ones (in particular for the heavy alkali ions, M = K–Cs). On the other hand, the computed (experimental) frequencies of β = 45 (44), 60 (57), 86 (82), 134 (128), and 375 (368) cm−1 and σ = 111 (108), 130 (124), 162 (157), 240 (234), and 626 (610) cm−1 for M = Cs–Li match very well for all M+LF(O4+) ions (Table 3). Similar to M+LC,32 the stretch frequencies are roughly twice the bend frequencies (i.e., σ ∼ 2β). The frequency increase for both types of modes along the series Cs → Li results from the increasing binding energy and angular anisotropy (i.e., effective force constant) of the potential and the decreasing reduced mass. Applying a pseudodiatomic model, the measured σ frequencies yield force constants of k = 149, 68, 49, 58, and 60 N m−1 for the M+⋯LF bonds with M = Li–Cs. This rough approach works qualitatively for reproducing the drop in binding energy for Li–K. However, it fails for the larger alkali ions because the σ mode is not a bare pseudodiatomic stretch but also involves a large LF in-plane bending component. Thus, the pseudodiatomic force constant k of σ is not necessarily correlated to D0. As expected, the β and σ values computed for the S1 excited state are systematically larger than those in the S0 state, because the M+⋯LF interaction becomes stronger upon ππ* excitation (Table 3). In fact, the ΔS1 red shift upon metalation directly reflects the increase in the binding energy upon S1 excitation. Thus, S1 excitation increases the binding energies of M+⋯LF by 29.7, 31.1, 32.7, 38.2, and 46.2 kJ mol−1 for Cs–Li, which corresponds to 20.6, 19.7, 18.6, 17.4, and 15.4%, respectively, assuming the computed PBE0 binding energies for S0 listed in Table 2.
| Li | Na | K | Rb | Cs | |||||||||||
|---|---|---|---|---|---|---|---|---|---|---|---|---|---|---|---|
| S0 | S1 | Exp. | S0 | S1 | Exp. | S0 | S1 | Exp. | S0 | S1 | Exp. | S0 | S1 | Exp. | |
| β | 320 | 375 | 368 | 121 | 134 | 128 | 71 | 86 | 82 | 48 | 60 | 57 | 36 | 45 | 44 |
| σ | 618 | 626 | 610 | 240 | 240 | 234 | 155 | 162 | 157 | 124 | 130 | 124 | 107 | 111 | 108 |
As already observed for M+LC,32 the low-frequency intramolecular LF modes of M+LF do not change much with M. This result is consistent with the view that the ππ* excitation is located on the LF chromophore, with essentially no amplitude of the orbital wavefunctions on the M+ ion. Computed frequencies are listed in Table S2 in the ESI† along with the suggested experimental assignments. The corresponding normal modes are quite similar to those of the related M+LC ions discussed in detail elsewhere.32 A full set of the computed frequencies of LF and M+LF in S0 and S1 is available in Table S3 in the ESI.† As expected from the similar orbitals, the intramolecular S1 vibronic excitation of M+LF(O4+) is similar to the one observed for neutral LF in He droplets.33 The latter spectrum is dominated by progressions in the lowest frequency mode of up to 3 quanta (m1 = 164 cm−1), which also occurs in combination with other low-frequency intramolecular origins. Other low-frequency fundamentals are observed at 274, 403, 440, 513, and 593 cm−1. These correspond well to our frequencies calculated for LF in the S1 state of 165 (m1), 276 (m2), 409 (m5), 444 (m6), 521 (m8), and 603 (m10) cm−1. The lowest-frequency modes observed for Cs+LF in S1 (i.e., the M+LF complex with the weakest perturbation of LF by M+) are quite similar, with 175 (m1), 276 (m2), 401 (m5), and 410 (m6) cm−1. These similarities in the vibronic activity in the excitation spectra of LF and M+LF(O4+) confirm that the same electronic state is excited and that the M+ ion has only a weak impact on the electronic structure.
Interestingly, not all transitions observed in the VISPD spectra of M+LF can be assigned by the FC simulations. For example, in the spectrum of Na+LF, four weaker reproducible transitions appear at 78, 91, 103, and 116 cm−1 below the first FC active in-plane fundamental (β = 128 cm−1, band A). The origin of these transitions is presently less certain. (1) We may safely exclude an assignment to isomers other than M+LF(O4+), because they are predicted to absorb in a very different spectral range (Fig. 3). Hence, the transitions are linked to M+LF(O4+). (2) Thus, one option might be an assignment to S1 ← S0 transitions of tagged complexes of M+LF(O4+).32 Indeed, at low trap temperatures of T = 6 K, M+LF(O4+)–He clusters are formed for the small alkali ions Li+ and Na+, because they have large He binding affinities. M+LF(O4+)–He absorptions will also be detected in the M+ fragment channel. To test this hypothesis, VISPD spectra of M+LF(O4+) are recorded at a higher trap temperature (T = 13 K), at which no He-tagged clusters are formed (as verified by mass spectra, Fig. S3 in the ESI†). Significantly, the appearances of the VISPD spectra at 6 and 13 K are similar (Fig. S4 in the ESI†). In particular, the relative intensities of the transitions do not change. Hence, we may safely exclude contaminating signals from tagged ions. (3) Additional transitions may also arise from slightly higher-energy singlet states of M+LF(O4+). However, the next allowed and forbidden singlet states are predicted to be much higher in energy, as shown by the vertical transitions for the S1–S4 states listed in Table 4. In particular, the S2 and S3 states are optically dark nπ* states with zero oscillator strength. The next optically bright ππ* state (S4) has a similar oscillator strength to S1 but is predicted to be far away (Δν = 7000–7300 cm−1). Low-energy triplet states could be a further option but should be spin-forbidden and are not observed in the spectra of LF embedded in He droplets and the condensed phase. (4) Finally, the additional vibronic bands may arise from S1 ← S0 transitions of M+LF(O4+) not included in the FC simulations. For example, FC forbidden transitions, such as out-of-plane LF fundamentals and combination bands of a′′ symmetry, could gain intensity by vibronic coupling to other electronic states. Furthermore, the coupling of vibrational excitation to internal rotation of the CH3 groups may also produce additional transitions (and could explain the observed unresolved doublets/multiplets of the S1 origins).48 Such transitions should not depend strongly on the M+ ion, and indeed several of the low-frequency additional bands are visible in several of the M+LF spectra at very similar frequencies. For example, most of the spectra have peaks at roughly 75, 93, 102, and 145 cm−1. In addition, these transitions have a smaller width than the main bands, indicating an assignment to modes with different vibrational symmetry. Unfortunately, comparison of the predicted frequencies with the observed unexplained transitions does not yield a conclusive assignment because of the lack of reliable calculated intensities. Thus, a detailed assignment of these transitions has to await a more sophisticated theoretical treatment, which is beyond the scope of this work.
| S1 (ππ*) | S2 (nπ*) | S3 (nπ*) | S4 (ππ*) | |||||||||
|---|---|---|---|---|---|---|---|---|---|---|---|---|
| ν | λ | f | ν | λ | f | ν | λ | f | ν | λ | f | |
| a Corresponding data for the O2(+) isomers are available in Table S5 in ESI. | ||||||||||||
| Li | 20595 |
485.56 | 0.141 | 25463 |
392.72 | 0.0 | 27581 |
362.57 | 0.0 | 27622 |
362.03 | 0.187 |
| Na | 21429 |
466.66 | 0.154 | 25772 |
388.02 | 0.0 | 27728 |
360.65 | 0.0 | 28687 |
348.59 | 0.178 |
| K | 21946 |
455.66 | 0.162 | 26197 |
381.73 | 0.0 | 27680 |
361.27 | 0.0 | 29208 |
342.37 | 0.174 |
| Rb | 22142 |
451.63 | 0.164 | 26328 |
379.83 | 0.0 | 27672 |
361.38 | 0.0 | 29417 |
339.94 | 0.171 |
| Cs | 22306 |
448.30 | 0.167 | 26506 |
377.28 | 0.0 | 27630 |
361.92 | 0.0 | 29530 |
338.64 | 0.169 |
| LF | 25236 |
396.26 | 0.213 | 26121 |
382.84 | 0.0 | 27585 |
362.51 | 0.0 | 32250 |
310.08 | 0.136 |
In Fig. 6 the geometry changes upon electronic excitation are visualized for the example of Li+LF. Corresponding data for the other alkali metals Na–Cs are available in Fig. S5 in the ESI.† The strongest changes take place in rings I and II, because the HOMO and LUMO orbitals involved in the S1 ← S0 ππ* transition are mostly located on these rings (Fig. 7). Ring I expands along the C5a–C8 axis (by 5.6 pm) accompanied by a moderate contraction of the C7–C9a and the C6–C9 axes (−2.3 and −2.0 pm, respectively). In ring II the maximum change is an elongation along the N5–N10 axis (5.3 pm). Only smaller geometry changes occur in ring III. Both CO bonds slightly elongate by 0.7 pm for all M+LF complexes. The relative structural changes of the LF chromophore upon electronic S1 excitation are relatively independent of the metal ion, because the HOMO/LUMO orbitals are completely localized on the LF chromophore. As a result, the calculated oscillator strength is relatively independent of M (Table 4). However, charge reorganization upon S1 excitation of LF has a substantial impact on the strength of the M+⋯LF interaction. Fig. 8 details the NBO partial charges in both the S0 and S1 states of the LF chromophore. Significantly, the negative partial charge on N5 increases substantially from −0.376 to −0.454e (by 0.078e), while the corresponding increase in negative charge on O4 is smaller (from −0.577 to −0.592e, ΔqO4 = 0.015e). As a result, the interaction of M+ with N5 becomes much stronger in S1, while that of M+ with O4 hardly changes. This view is consistent with the result that S1 excitation leads to a drastic contraction of the M–N5 bond (by 5.9–16 pm for Li–Cs), while the M–O4 bond contraction is negligible (≤1.1 pm). The stronger M+⋯LF interaction in the S1 excited state is compatible with the observed ΔS1 red shifts. Finally, the strength of the M+⋯LF interaction scales with the magnitude of the small but noticeable charge transfer from M+ to LF. While the positive partial charges on M+ are 0.881, 0.922, 0.922, 0.928, and 0.917e for Li+–Cs+ in the S0 state, they are systematically smaller in the corresponding S1 state (0.860, 0.908, 0.909, 0.915, and 0.906e). Clearly, the charge transfer in S0 is largest from Li+ to LF (Δq = 0.12e), because Li+⋯LF has the by far strongest bond. In addition, the enhancement of the charge transfer upon electronic excitation is also largest for this complex (Δq = 0.021e), because the increase in binding energy upon ππ* excitation is most pronounced (Table S4 in the ESI†). In contrast to O4/N5, the negative charge density decreases at N1/O2 upon S1 excitation which reduces the M+⋯LF interaction in the O2(+) isomers and explains their blue shifts in ΔS1.
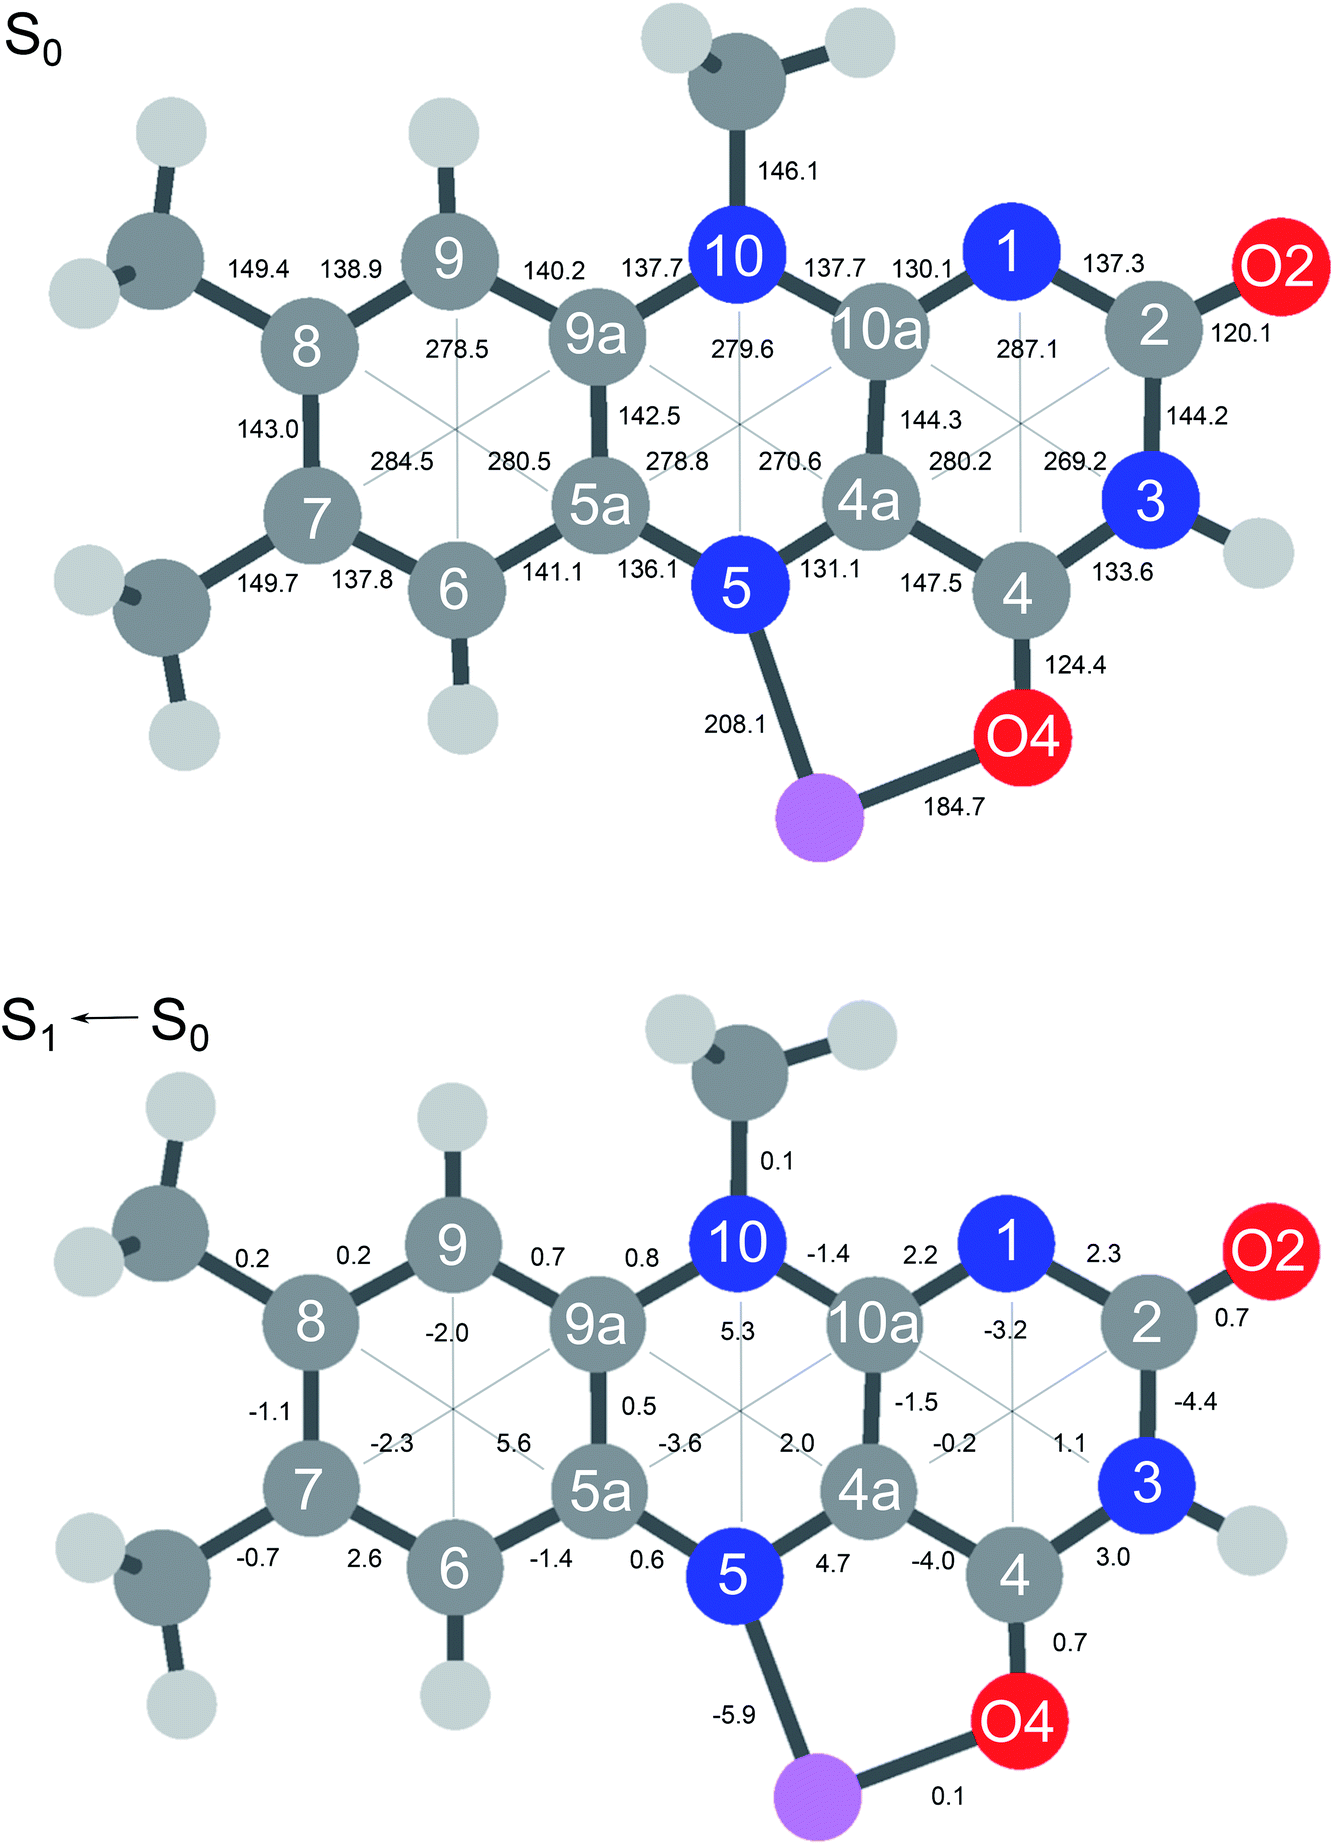 | ||
| Fig. 6 (Top) Absolute distances (in pm) of Li+LF in its electronic ground state (S0) calculated at the PBE0/cc-pVDZ level. (Bottom) Relative changes in bond distances upon electronic S1 excitation. Positive (negative) values indicate elongations (contractions). Corresponding data for LF and M+LF with M = Na–Cs are available in Fig. S5 in ESI.† | ||
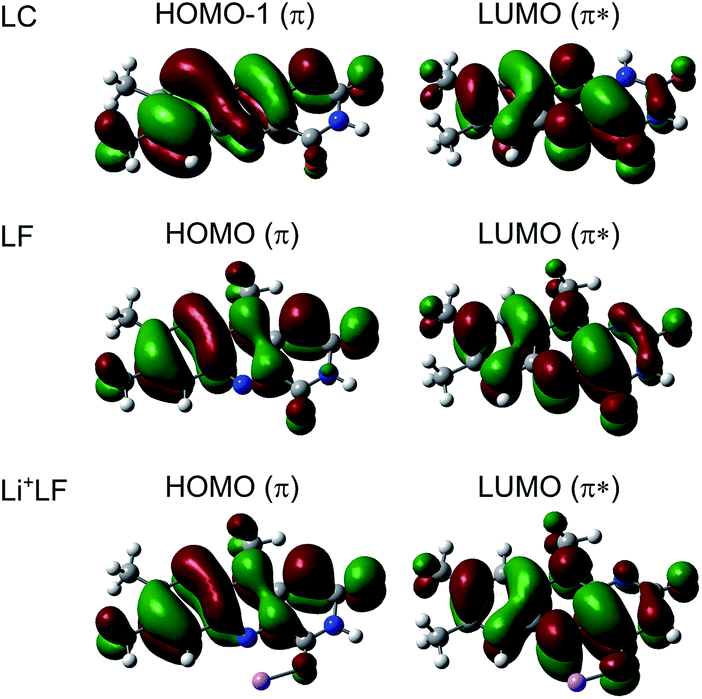 | ||
| Fig. 7 Natural transition orbitals involved in the electronic S1 ← S0 (ππ*) transition (LUMO ← HOMO) of LF and Li+LF computed at the PBE0/cc-pVDZ level. For comparison, the corresponding orbitals for LC are shown as well (for LC the ππ* transition is S2 and corresponds to LUMO ← HOMO−1).31,32 | ||
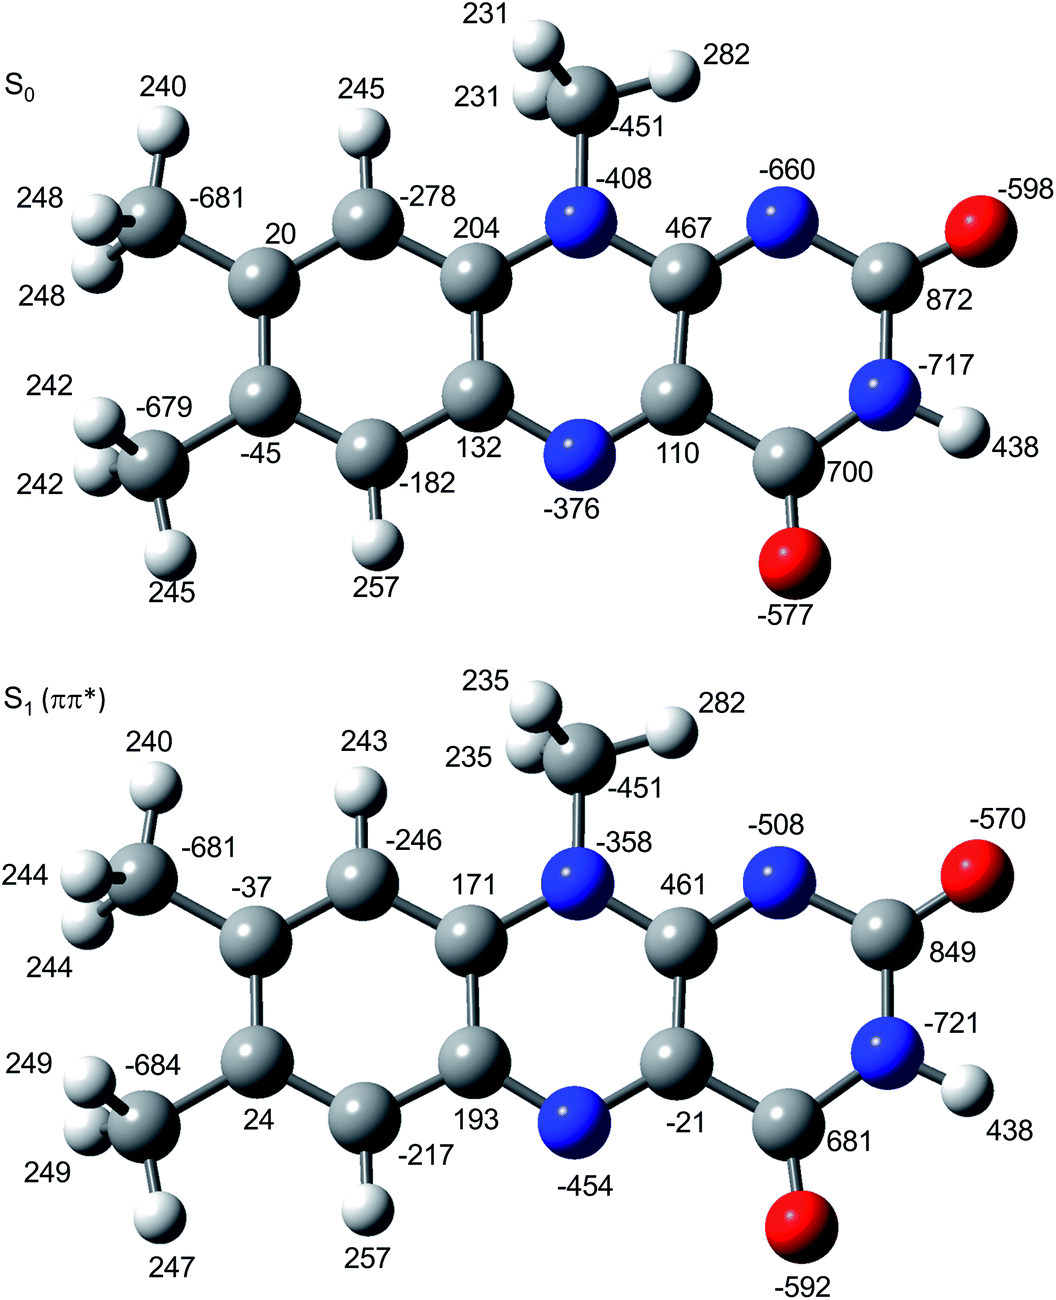 | ||
| Fig. 8 Atomic charge distribution of LF (in 10−3e) in the S0 and S1 states using natural bond orbital analysis. | ||
To unravel more details about the VISPD process of M+LF(O4+), the dependence of the M+ fragment yield on the laser pulse energy is considered for excitation of the S1 origin. For the heavy alkali ions Na–Cs, a linear dependence of the M+ fragment ion yield is observed over a wide range (0–2.5 mJ), while for Li the dependence is nonlinear, indicating the VISPD process requires the absorption of a single photon for Na–Cs and two photons for Li (Fig. S6 in the ESI†). This result is consistent with the binding energies calculated for the S0 state (D0 ∼ 12030, 13200, 14710, 18370, 25090 cm−1 for Cs–Li), which are substantially lower than the measured S1 origins for M+LF with M = Cs–K (S1 = 19031, 18914, 18778 cm−1), roughly the same for M = Na (S1 = 18310 cm−1), and much larger for M = Li (S1 = 17645 cm−1). Thus, according to these data, single-photon absorption should be sufficient for dissociation of M+LF with M = Cs–Na, while at least two photons are required to dissociate Li+LF. Although the photodissociation mechanism is not clear, we assume that the VISPD process occurs by internal conversion from the excited electronic state (S1 for Na–Cs, Sn>1 for Li) to the S0 state followed by statistical dissociation on the ground state.
It is instructive to compare the optical properties of M+LF with those determined recently for the related M+LC complexes using the same experimental and computational approach.32 LF differs from LC such that LF has a CH3 group at N10, while LC has a H atom at N1. The S1 state of both flavins arises from ππ* excitation and the involved orbitals are quite similar for both molecules (Fig. 7) and closely resemble those reported for 10-methyl-isoalloxazine.23 As the LF orbitals are slightly more delocalized than those of LC, with a modest contribution on the additional CH3 group at N10, the orbital energies and corresponding ππ* transition energies are lower for LF. For example, the computed adiabatic S1 origin of LF at 22450 cm−1 is strongly red shifted compared to the corresponding S2 state of LC at 25899 cm−1 (by 3449 cm−1), in agreement with experimental observations. We note that in LC, the first ππ* state (S2) lies slightly above the first nπ* state (S1), while the situation is reversed for LF. For both metalated flavins, the observed VISPD spectra are assigned to the O4+ isomers, forming N5–M–O4 chelates with similar binding energies of 139–296 and 144–300 kJ mol−1 for M+LC and M+FL with M = Cs–Li, respectively. Since the M+ binding site is far away from the position of the relevant CH3/H groups, and ππ* excitation involves essentially the same orbitals, the large red shifts upon electronic excitation are similar for the O4+ isomers of both metalated flavins. For example, the −ΔS1 values computed for M+LF (2792–4428 cm−1) are comparable to those of M+LC (3182–5142 cm−1), again in good agreement with the experimental observations. Because of the similar bonding in M+LC(O4+) and M+LF(O4+) and the comparable mass of LC and LF (m/z 242 versus 256), the intermolecular M+⋯flavin frequencies β and σ are nearly the same, too. For example, β = 45–350 versus 45–368 cm−1 and σ = 108–595 versus 108–610 cm−1 are measured in the S1 excited state. The main differences between LC and LF occur at the O2(+) binding site, because in the LC tautomer the H atom is bonded to N1, while in LF the free lone pair of N1 is available for bonding with M+ (and H+).28,31,32 Hence, M+LC can only form O2 but not O2+ isomers for steric reasons. In addition, while H+LC prefers protonation at N5, for H+LF the O2+ tautomer was observed.27
Concluding remarks
In summary, the VISPD spectra of M+LF with M = Li–Cs presented herein correspond to the first optical spectra of metalated LF complexes in the gas phase and provide a first impression of the effects of alkali metalation on the absorption properties of this simple flavin molecule. Significantly, cryogenic cooling of the ions is mandatory for achieving vibronic resolution in the excitation spectra and thus provides detailed experimental information about the changes in geometric, vibrational, and electronic structure upon electronic excitation, which cannot be obtained with room-temperature spectra. The analysis of the VISPD spectra with the aid of TD-DFT calculations coupled to multidimensional FC simulations allows for an unambiguous assignment of the spectra observed in the 500–570 nm range to transitions of the O4+ isomer into the optically bright first excited singlet state (S1 ← S0) which has ππ* character. The good agreement between the observed adiabatic S1 origins and those predicted at the PBE0/cc-pVDZ level (<0.1 eV) indicates that this economic DFT level reliably describes the electronic structure of flavin molecules. Because the other low-energy O2(+) isomers absorb in a rather different optical range, the recorded VISPD spectra of the O4+ ions are highly isomer-selective. This is in contrast to previous IRMPD spectra, in which absorptions of these isomers occur in the same spectral range and strongly overlap.29 The intramolecular vibronic structure observed for M+LF is relatively independent of M+ and similar to that of LF, because the molecular orbitals involved in the S1 ← S0 transition do not cover the M+ ion. As a result, the large ΔS1 red shifts upon M+ complexation (up to ∼4000 cm−1 or ∼100 nm) can be traced back to the increase in the intermolecular M+⋯LF interaction upon S1 excitation (up to ∼20%). This effect is specific to the O4+ metal binding site and can be explained by the significant electron transfer to the N5 and O4 atoms upon ππ* excitation, which increases the local electrostatic interaction of LF with the M+ cation. Although the major vibronic structure in the VISPD spectra of M+LF(O4+) could be reproduced by simple FC simulations, the reliable explanation of minor absorptions tentatively attributed to vibronic coupling and/or internal CH3 rotation requires a more sophisticated computational treatment. In many aspects, the photochemical properties of the O4+ isomers of M+LF are similar to those of M+LC,32 because the molecular orbitals involved in the S1 ← S0 transition are only slightly affected by the structural differences of these two flavins.In future work, this VISPD study on M+LF can be extended along several directions. First, VISPD spectra recorded at shorter wavelengths are to be recorded to find and characterize higher excited singlet states of the O4+ isomers predicted in the 300–400 nm range (Table 4) and to search for the S1 absorption of the O2(+) isomers, which were previously identified in the population of ESI-generated ions by IRMPD and have predicted S1 origins in the 23000–24000 cm−1 (415–435 nm) range (Table 1). Second, M+LF complexes with transition metal ions (e.g., Cu+–Au+) and multiply charged ions (e.g., Fe2+, Mg2+) are interesting targets29 because of their biological relevance. Third, the optical spectrum of H+LF is particularly interesting because the preferred protonation site of LF (O2+) is different from the metalation site observed here for M+LF (O4+). Initial VISPD spectra for H+LF reveal indeed absorptions near 23100 cm−1 consistent with O2+ protonation. Forth, microhydrated clusters of M+LF/H+LF could provide detailed insight into the effects of stepwise solvation on the photochemical properties of these flavins, which according to solution experiments strongly depend on the considered excited state.
As a general conclusion, the combined approach of cryogenic ion spectroscopy coupled to TD-DFT calculations and FC simulations is a powerful tool to expand our knowledge of the photochemical and photophysical properties of flavins. Our initial promising studies on the smaller flavins LC and LF pave the way to larger and biologically more relevant flavins, such as RF, FMN, and FAD. Because these more complex molecules have flexible side chains, the detailed determination of their conformation-dependent photochemical properties is more challenging and requires the application of multiple-resonance laser schemes such as VIS/VIS or IR/VIS approaches.
Conflicts of interest
There are no conflicts to declare.Acknowledgements
This work was supported by Deutsche Forschungsgemeinschaft (DFG, DO 729/6). M. M. is grateful for a senior research fellowship from the Alexander von Humboldt Foundation (2017-2019). O. D. acknowledges travel support from the World Research Hub Initiative (WRHI) of Tokyo Institute of Technology (Japan). Part of the computations was performed at the Research Center for Computational Science in Okazaki (Japan).References
- K. H. Dudley, P. Hemmerich, F. Müller and A. Ehrenberg, Helv. Chim. Acta, 1964, 47, 1354–1383 CrossRef CAS.
- P. F. Heelis, Chem. Soc. Rev., 1982, 11, 15–39 RSC.
- V. Massey, Biochem. Soc. Trans., 2000, 28, 283–296 CrossRef CAS PubMed.
- E. Silva and A. Edwards, Flavins, Photochemistry, and Photobiology, RSC Publishing, Cambridge, 2006 Search PubMed.
- W. Buckel and R. K. Thauer, Chem. Rev., 2018, 118, 3862–3886 CrossRef CAS PubMed.
- W. J. Rutter, Acta Chem. Scand., 1958, 12, 438–446 CrossRef CAS.
- I. F. Baarda and D. E. Metzler, Biochim. Biophys. Acta, 1961, 50, 463–471 CrossRef CAS.
- P. Bamberg and P. Hemmerich, Helv. Chim. Acta, 1961, 44, 1001–1011 CrossRef CAS.
- F. Müller, P. Hemmerich and A. Ehrenberg, Eur. J. Biochem., 1968, 5, 158–164 CrossRef.
- A. W. Varnes, E. L. Wehry and R. B. Dodson, J. Am. Chem. Soc., 1972, 94, 946–950 CrossRef CAS PubMed.
- J. Lauterwein, P. Hemmerich and J. M. Lhoste, Inorg. Chem., 1975, 14, 2152–2161 CrossRef CAS.
- J. Lauterwein, P. Hemmerich and J. M. Lhoste, Inorg. Chem., 1975, 14, 2161–2168 CrossRef CAS.
- M. Benecky, T. Y. Yu, K. L. Watters and J. T. McFarland, Biochim. Biophys. Acta, 1980, 626, 197–207 CrossRef CAS.
- S. Fukuzumi and T. Kojima, J. Biol. Inorg Chem., 2008, 13, 321–333 CrossRef CAS PubMed.
- I. Ahmad, Z. Anwar, S. Ahmed, M. A. Sheraz and S. Khattak, J. Photochem. Photobiol., B, 2017, 173, 231–239 CrossRef CAS PubMed.
- E. Sikorska, I. V. Khmelinskii, W. Prukała, S. L. Williams, M. Patel, D. R. Worrall, J. L. Bourdelande, J. Koput and M. Sikorski, J. Phys. Chem. A, 2004, 108, 1501–1508 CrossRef CAS.
- W. Holzer, J. Shirdel, P. Zirak, A. Penzkofer, P. Hegemann, R. Deutzmann and E. Hochmuth, Chem. Phys., 2005, 308, 69–78 CrossRef CAS.
- A. Tyagi and A. Penzkofer, J. Photochem. Photobiol., A, 2010, 215, 108–117 CrossRef CAS.
- A. Penzkofer, A. Tyagi and J. Kiermaier, J. Photochem. Photobiol., A, 2011, 217, 369–375 CrossRef CAS.
- C. Neiss, P. Saalfrank, M. Parac and S. Grimme, J. Phys. Chem. A, 2003, 107, 140–147 CrossRef CAS.
- J. Hasegawa, S. Bureekaew and H. Nakatsuji, J. Photochem. Photobiol., A, 2007, 189, 205–210 CrossRef CAS.
- S. Salzmann and C. M. Marian, Chem. Phys. Lett., 2008, 463, 400–404 CrossRef CAS.
- S. Salzmann, J. Tatchen and C. M. Marian, J. Photochem. Photobiol., A, 2008, 198, 221–231 CrossRef CAS.
- S. Salzmann and C. M. Marian, Photochem. Photobiol. Sci., 2009, 8, 1655–1666 RSC.
- B. Klaumünzer, D. Kröner and P. Saalfrank, J. Phys. Chem. B, 2010, 114, 10826–10834 CrossRef PubMed.
- R. J. Platenkamp, H. D. Van Osnabrugge and A. J. W. G. Visser, Chem. Phys. Lett., 1980, 72, 104–111 CrossRef CAS.
- J. Langer, A. Günther, S. Seidenbecher, G. Berden, J. Oomens and O. Dopfer, ChemPhysChem, 2014, 15, 2550–2562 CrossRef CAS.
- A. Günther, P. Nieto, G. Berden, J. Oomens and O. Dopfer, Phys. Chem. Chem. Phys., 2014, 16, 14161–14171 RSC.
- P. Nieto, A. Günther, G. Berden, J. Oomens and O. Dopfer, J. Phys. Chem. A, 2016, 120, 8297–8308 CrossRef CAS PubMed.
- A. Günther, P. Nieto, D. Müller, A. Sheldrick, D. Gerlich and O. Dopfer, J. Mol. Spectrosc., 2017, 332, 8–15 CrossRef.
- A. Sheldrick, D. Müller, A. Günther, P. Nieto and O. Dopfer, Phys. Chem. Chem. Phys., 2018, 20, 7407–7414 RSC.
- P. Nieto, D. Müller, A. Sheldrick, A. Günther, M. Miyazaki and O. Dopfer, Phys. Chem. Chem. Phys., 2018, 20, 22148–22158 RSC.
- A. Vdovin, A. Slenczka and B. Dick, Chem. Phys., 2013, 422, 195–203 CrossRef CAS.
- M. H. Stockett, Phys. Chem. Chem. Phys., 2017, 19, 25829–25833 RSC.
- L. Giacomozzi, C. Kjær, J. Langeland Knudsen, L. H. Andersen, S. Brøndsted Nielsen and M. H. Stockett, J. Chem. Phys., 2018, 148, 214309 CrossRef CAS PubMed.
- J. N. Bull, E. Carrascosa, L. Giacomozzi, E. J. Bieske and M. H. Stockett, Phys. Chem. Chem. Phys., 2018, 20, 19672–19681 RSC.
- E. Matthews and C. E. H. Dessent, J. Phys. Chem. Lett., 2018, 9, 6124–6130 CrossRef CAS PubMed.
- E. Matthews, R. Cercola and C. E. H. Dessent, Molecules, 2018, 23, 2036 CrossRef PubMed.
- K. Lincke, J. L. Knudsen, A. Ø. Madsen, H. V. V. Kiefer, L. Skov, E. Gruber, K. V. Mikkelsen, L. H. H. Andersen and M. B. Nielsen, Phys. Chem. Chem. Phys., 2018, 20, 28678–28684 RSC.
- T. R. Rizzo, J. A. Stearns and O. V. Boyarkin, Int. Rev. Phys. Chem., 2009, 28, 481–515 Search PubMed.
- N. S. Nagornova, T. R. Rizzo and O. V. Boyarkin, Science, 2012, 336, 320–323 CrossRef CAS PubMed.
- M. J. Frisch, et al., GAUSSIAN09, Rev. D.01, Gaussian, Inc., Wallingford CT, 2009 Search PubMed.
- I. S. Lim, P. Schwerdtfeger, B. Metz and H. Stoll, J. Chem. Phys., 2005, 122, 104103 CrossRef PubMed.
- C. M. Western, J. Quant. Spectrosc. Radiat. Transfer, 2017, 186, 221–242 CrossRef CAS.
- R. L. Martin, J. Chem. Phys., 2003, 118, 4775–4777 CrossRef CAS.
- E. D. Glendening, J. K. Badenhoop, A. E. Reed, J. E. Carpenter, J. A. Bohmann, C. M. Morales, C. R. Landis and F. Weinhold, NBO 6.0, Theoretical Chemistry, University of Wisconsin, Madison, 2013 Search PubMed.
- R. D. Shannon, Acta Crystallogr., Sect. A: Cryst. Phys., Diffr., Theor. Gen. Crystallogr., 1976, 32, 751–767 CrossRef.
- P. J. Breen, J. A. Warren, E. R. Bernstein and J. I. Seeman, J. Chem. Phys., 1987, 87, 1917–1926 CrossRef CAS.
Footnote |
| † Electronic supplementary information (ESI) available. See DOI: 10.1039/c8fd00203g |
| This journal is © The Royal Society of Chemistry 2019 |