 Open Access Article
A graphene oxide-based sequential nanocatalyst for efficient tumor combination therapy
Zhenlu
Yang
 a,
Ying
Zhao
 c,
Zi
Xu
 a,
Rongpin
Wang
 *a and
Qing
Wang
 *b
*b
aDepartment of Radiology, Guizhou Provincial People's Hospital, Guiyang, Guizhou 550000, China. E-mail: wangrongpin@126.com; yangzhenlu0105@163.com; xuzdoc@126.com
bDepartment of Urology, Guizhou Provincial People's Hospital, Guiyang, Guizhou 550000, China. E-mail: wangqing1@gz5055.com
cDepartment of Radiology, Nanjing First Hospital, Nanjing Medical University, Nanjing, 210006, China. E-mail: zhaoyingmed@163.com
First published on 16th May 2024
Abstract
Graphene oxide (GO) is a versatile and promising nanomaterial, and it can mimic peroxidase-like activity to generate hydroxyl radicals to kill tumor cells. However, the low biocompatibility and catalytic efficiency limit its application in tumor treatment. Here, we constructed a sequential catalytic nanocatalyst based on GO to overcome its drawbacks and improve the therapeutic effect. GO nanosheets were coated onto periodic mesoporous organosilica (PMOs) and then glucose oxidase (GOD) was modified on the surface to create PMO@GO-GOD. The GO-wrapping of the PMOs could reduce the damage of the two-dimensional GO nanosheets in the cell membrane. The loaded GOD decomposed glucose into H2O2 to continually supply the catalytic substrate for GO and thus enhanced its catalytic performance. Meanwhile, effective photothermal therapy could be achieved by GO shells. The administration of PMO@GO-GOD resulted in a remarkable antitumor effect with no obvious systemic toxicity.
1. Introduction
Enzymes hold a remarkable catalytic efficiency and substrate specificity and are vital in ensuring the function and metabolism of living cells.1 Most natural enzymes are proteins or RNA, which are unstable, high-cost and complicated.1 With the advances of nanotechnology, some nanomaterials with enzyme-like activity have been found, called “nanozymes”.2 Compared with natural enzymes, nanozymes are more stable, low-cost and mass-produced.3,4 Nanozymes can mimic the catalase-like activity, peroxidase-like activity, oxidase-like activity and superoxide dismutase-like activity, etc.1,5Nanozymes can initiate catalytic reactions with the tumor microenvironment to generate toxic molecules for efficient tumor therapy,6–9 such as reactive oxygen species (ROSs), including hydroxyl radicals (˙OH), superoxide anions (˙O2−), and singlet oxygen (1O2), etc.8,10 Recently, chemodynamic therapy (CDT) has become a novel and potential anticancer strategy. CDT induces cancer cell apoptosis by cytotoxic hydroxyl radicals produced via a Fenton or Fenton-like reaction.8 There are several advantages of CDT, including low side effects, no external field stimulation and low cost.11 Many catalytic nanomaterials have been designed for CDT or CDT-based combination treatment, such as PtSn bimetallic nanoclusters, manganese doped VSe2 nanosheets, a vanadium-based MXene nanoplatform and Ti-based MXene nanocomposites, etc.12–15
Graphene oxide (GO) is a two-dimensional carbon nanosheet and shows an excellent chemical/mechanical stability, high surface area, strong absorbance in the near-infrared (NIR) region and superb thermal properties.16,17 It has been widely investigated in nanoelectronics, biosensors, drugs delivery, photothermal therapy (PTT) and biological imaging.16–20 Furthermore, GO exhibits peroxidase-like catalytic characteristics and can catalyze H2O2 to generate hydroxyl radicals.21,22 Thus, GO has been investigated for CDT and photothermal therapy of cancers.23,24 However, insufficient endogenous H2O2 limits its anticancer efficiency. What's more, several studies reported that GO had a concentration-dependent cytotoxicity against human cells, which was believed to be caused by direct physical damage to the cell membrane due to the extremely sharp edges of the GO nanosheets.25–27 The low biocompatibility undoubtedly obstructs the biomedical applications of GO.
Periodic mesoporous organosilica (PMO) contain uniform organic and inorganic components and show potential in biomedicine applications. They have a large specific surface area, ordered mesoporous and easily functionalized surfaces, and good biocompatibility and biodegradability. Multiple studies have constructed PMO-based multifunctional nanoplatforms for drugs delivery, biological imaging, and combined therapy.28–32 The shape and size of the PMOs can be easily modulated by optimizing the amount of structural-directing agents, the ratio of ethanol and water, and the concentration of organosilicon precursors and ammonia, etc.33–35 Therefore, spherical, yolk–shell, double-shell, deformable hollow and ultra-small PMOs can be synthesized.28,29,34,36 According to previous studies, GOs can wrap on spherical mesoporous silica nanoparticles to obtain multifunctional and morphology-defined nanoplatforms for tumor treatment with a satisfactory biocompatibility.37–39
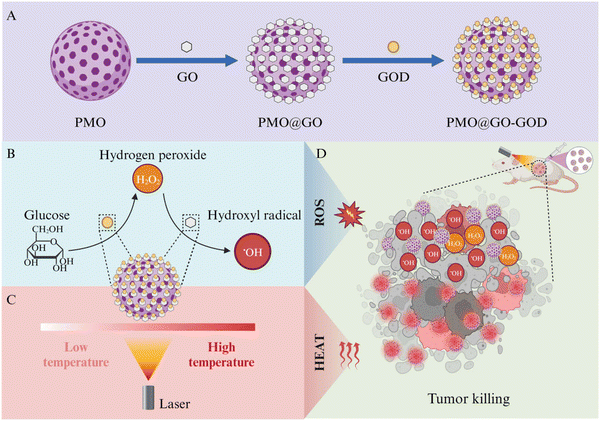
In this study, we coat the two-dimensional GO nanosheets onto well-defined spherical PMOs and then link glucose oxidase (GOD) in the surface to construct a simple, biocompatible and sequential catalytic nanoplatform PMO@GO-GOD for CDT and photothermal therapy for breast cancers (Fig. 1). The GO-wrapped PMOs can reduce the damage of two-dimensional GO nanosheets in the cell membrane and provide a morphology-defined nanocarrier. The loaded GOD decomposes the glucose in the tumor microenvironment into H2O2 to enhance the catalytic performance of GO. Subsequently, GO shells effectively catalyze H2O2 into hydroxyl radicals to kill tumor cells. Meanwhile, owing to the high photo-thermal efficiency of GO shells, effective photothermal therapy can be achieved upon laser radiation. The results from cell and animal experiments indicate the sequential nanocatalyst PMO@GO-GOD can obviously elevate the cytotoxic hydroxyl radical and effectively combat breast cancers by combining CDT and photothermal therapy. Besides, we also confirm the good biocompatibility of PMO@GO-GOD in vivo. Our study focuses on the peroxidase-like catalytic activity of GO and constructs a simple, biocompatible and sequential nanocatalyst for tumor combination therapy.
2. Materials and methods
2.1 Materials and reagents
Hexadecyltrimethyl ammonium bromide (CTAB, 25 wt%), concentrated ammonia aqueous solution, anhydrous ethanol and concentrated hydrochloric acid were acquired from Sinopharm Chemical Reagent Co., Ltd. (Shanghai, China). Bis[3-(triethoxysilyl)propyl]tetrasulfide (TESPTS), tetraethyl orthosilicate (TEOS), (3-aminopropyl)triethoxysilane (APTES), graphene oxide (GO) and 2′,7′-dichlorofluorescin diacetate (DCFH-DA) were bought from Sigma-Aldrich (St. Louis, MO, USA). Glucose oxidase, N-(3-dimethylaminopropyl)-N′-ethylcarbodiimide hydrochloride (EDC), N-hydroxysulfosuccinimide sodium salt (NHS), hydrogen peroxide (30 wt%) and 3,3′,5,5′-tetramethylbenzidine (TMB) were bought from Aladdin Biochemical Technology Co., Ltd (Shanghai, China). A Reactive Oxygen Species Assay Kit was obtained from Beyotime Biotech. Inc. (Shanghai, China). Tissue Reactive Oxygen Species Assay Kits were bought from Shanghai BestBio Biotechnology Co., Ltd (Shanghai, China). β-D-glucose was obtained from Macklin Biochemical Technology Co., Ltd (Shanghai, China). The glucose oxidase activity assay kit and live/dead stain kit were acquired from Solarbio Science & Technology Co., Ltd (Beijing, China). Trypsin–EDTA and the L-15 medium were purchased from Biosharp Life Sciences Co., Ltd (Hefei, China). The cell counting kit-8 (CCK-8) was bought from Invitrogen Corporation (USA). Fetal bovine serum (FBS) was bought from Shanghai XP Biomed Ltd (Shanghai, China). OriCell®MDA-MB-231 cells were acquired from Cyagen Biosciences Inc (Guangzhou, China).2.2 Synthesis and modifications
The PMO nanoparticles were synthesized according to a reported strategy with a small change.40 CTAB (0.1 g), ethanol (37.5 mL), deionized water (162.5 mL) and concentrated ammonia aqueous solution (1.25 mL) were mixed and stirred at 35 °C for 2 h. Then, TEOS (0.225 mL) and TESPTS (0.025 mL) were mixed and added into the above solution. Fifteen minutes later, 12.5 of μL APTES was added and the mixed solution was stirred at 35 °C for 24 h. The products were obtained by centrifugation and washing using ethanol. The products were dissolved in ethanol and concentrated HCl (37%) was added (ethanol![[thin space (1/6-em)]](https://www.rsc.org/images/entities/char_2009.gif) :
:![[thin space (1/6-em)]](https://www.rsc.org/images/entities/char_2009.gif) HCl = 500
HCl = 500![[thin space (1/6-em)]](https://www.rsc.org/images/entities/char_2009.gif) :
:![[thin space (1/6-em)]](https://www.rsc.org/images/entities/char_2009.gif) 1, volume ratio). The mixed solution was stirred at 60 °C for 3 h three times to remove CTAB. Then, positively charged PMOs were obtained by washing thrice using ethanol. The positively charged PMOs were coated by the negatively charged GO nanosheets via electrostatic adsorption. Briefly, 5 mg of PMOs and 2.5 mg of GOs were mixed and stirred at 25 °C for 24 h. PMO@GO was acquired after washing thrice using water. To conjugate GOD, the carboxyl group-containing PMO@GO (1 mg) was firstly activated by 1.2 mL of EDC (1 mg mL−1) and 1.4 mL of NHS (1 mg mL−1) under shaking at room temperature for 2 h, and then 2 mg of GODs were added for 24 h. Lastly, PMO@GO-GOD was acquired after centrifugation and washing thrice using water.
1, volume ratio). The mixed solution was stirred at 60 °C for 3 h three times to remove CTAB. Then, positively charged PMOs were obtained by washing thrice using ethanol. The positively charged PMOs were coated by the negatively charged GO nanosheets via electrostatic adsorption. Briefly, 5 mg of PMOs and 2.5 mg of GOs were mixed and stirred at 25 °C for 24 h. PMO@GO was acquired after washing thrice using water. To conjugate GOD, the carboxyl group-containing PMO@GO (1 mg) was firstly activated by 1.2 mL of EDC (1 mg mL−1) and 1.4 mL of NHS (1 mg mL−1) under shaking at room temperature for 2 h, and then 2 mg of GODs were added for 24 h. Lastly, PMO@GO-GOD was acquired after centrifugation and washing thrice using water.
2.3 Characterization
The transmission electron microscopy (TEM) images of the nanoparticles were captured using a JEM 2100F microscope (JEOL, Japan). A Zetasizer Nano ZS90 (Malvern Panalytical, UK) was used to measure the zeta potential and hydrodynamic sizes of the nanoparticles. Fourier transform infrared (FT-IR) spectra were recorded using Nicolet 6700 FT-IR spectrometers (Thermo Scientific, USA). A Model680 microplate reader (Bio-Rad, USA) was used to obtain the UV-vis spectra. The Micromeritics ASAP 2460 analyzer (Micromeritics Instruments Corporation, USA) was applied to acquire the nitrogen sorption isotherm. The corresponding pore size, pore volume and specific surface areas were analyzed according to previous methods.412.4 Evaluating glucose oxidase activity and peroxidase-like activity of the nanocatalyst
The activity of GOD anchored on PMO@GO was tested by a glucose oxidase activity assay kit. According to the instructions of the assay kit, 900 μL of the working solution and 100 μL of PMO@GO-GOD with different concentrations (0, 31.25, 62.5, 125 and 250 μg mL−1, PMO equiv.) were mixed and the absorbance at 500 nm was recorded at 20 s (as A1) and 2 h (as A2) by a Model680 microplate reader. PMO@GOs at different concentrations (0, 31.25, 62.5, 125 and 250 μg mL−1, PMO equiv.) were tested as the controls. Three parallel experiments were performed for each. The following equation was used to calculate the glucose oxidase activity: GOD (U μg−1) = 666.67 × (A2 − A1)/W, where W is the mass of sample.TMB was used as a chromogenic substrate to detect the peroxidase-like characteristics of PMO@GO and PMO@GO-GOD. TMB can be oxidized to its oxidation state with a distinct color changing (blue color). There were six groups: PMO, PMO+H2O2, PMO@GO, PMO@GO+H2O2, PMO@GO-GOD, and PMO@GO-GOD+H2O2. The concentration gradients of PMO, PMO@GO or PMO@GO-GOD were 0, 31.25, 62.5, 125 and 250 μg mL−1 (PMO equiv.). The final concentrations of H2O2 and TMB were 50 mM and 800 nM, respectively. The final reaction volume was 1 mL. The reactive solution was shaken at room temperature for 30 min. Then, the centrifuge tube of each group was photographed and the absorbance at 652 nm was measured by a Model680 microplate reader. The peroxidase-like activity of PMO@GO (250 μg mL−1, PMO equiv.) was also evaluated in the presence of H2O2 with different concentrations (0, 0.5, 1, 5, 25, 50 mM) by using a similar strategy. In order to verify that the anchored GOD can promote the generation of hydroxyl radicals, several groups were designed: glucose (GLU)+PMO+H2O2, GLU+PMO@GO+H2O2, PMO@GO-GOD+H2O2, GLU+PMO@GO-GOD+H2O2. The concentration of PMO, PMO@GO or PMO@GO-GOD was 250 μg mL−1 (PMO equiv.). The final concentrations of H2O2 and TMB were 50 mM and 800 nM, respectively. Similarly, the centrifuge tube of each group was photographed and the absorbance at 652 nm was recorded after 30 min.
2.5 Evaluating the photothermal conversion of PMO@GO-GOD
The PMO@GO-GOD solutions with different concentrations (0, 0.675, 1.25, 2.5, 5 mg mL−1, PMO equiv.) were irradiated by an 808 nm laser (1.0 W cm−2) (Nanjing PL Optics Technology Co., Ltd, China) for different times (0, 1, 2, 3, 4, 5, 6, 7, 8, 9, 10 min). Then, PMO@GO-GOD solution with a concentration of 1 mg mL−1 (PMO equiv.) was irradiated by an 808 nm laser under different power densities (0.25, 0.5, 1.0 and 2.0 W cm−2) for different times (0, 1, 2, 3, 4, 5, 6, 7, 8, 9, 10 min). The maximum temperature of the solution at different times was detected by a UTi260B thermal camera (UNI-T Technology Co., Ltd, China). Moreover, the PMO@GO-GOD solution with a concentration of 1 mg mL−1 (PMO equiv.) was irradiated by an 808 nm laser (1.0 W cm−2) for 10 min, and then cooled gradually at room temperature to reach the equilibrium temperature. A total of five cycles were performed.2.6 Cellular uptake
MDA-MB-231 cells (1 × 10⁶ cells per well) were planted into a 6-well plate in 10% FBS-containing L-5 medium at 37 °C for 12 h. After removing the old medium, 3 mL of fresh medium containing PMO@GO-GOD (final concentration of 100 μg mL−1, PMO equiv.) was added and the cells were incubated for 0 h, 3 h, 6 h and 24 h. Then, cells were washed, fixed, dehydrated, embedded and sliced. Finaly, TEM images of the cells were captured by a H-7650 microscope (Hitachi, Japan).2.7 ROS generation in tumor cells
MDA-MB-231 cells (8 × 10⁴ cells per dish) were planted into a cell culture dish in L-5 medium at 37 °C for 12 h. After removing the old medium, 1 mL of fresh medium containing PMO, PMO@GO, PMO@GO-GOD (final concentration of 1 mg mL−1, PMO equiv.) was added and the cells were incubated for 12 h. The cells incubated with 1 mL of fresh medium were considered as the control group. After removing the medium, cells of each group were washed by PBS thrice and 1 mL of DCFH-DA (10 μM) was added. Twenty minutes later, the fluorescence emission of the cells was captured at 525 nm by a confocal laser scanning microscope (FV1000, Olympus, Japan) (excitation at 485 nm).2.8 Cytotoxicity
MDA-MB-231 cells (1 × 10⁴ cells per well) were planted into a 96-well plate in L-5 medium for 12 h. There were six groups: control, laser, PMO, PMO@GO, PMO@GO-GOD, and PMO@GO-GOD+laser. Three parallel experiments were performed for each group. Then, 100 μL of fresh medium containing PMO, PMO@GO, and PMO@GO-GOD (final concentration of 1 mg mL−1, PMO equiv.) was respectively added and the cells were incubated for another 12 h. For the control group and laser group, 100 μL of fresh medium was added. After washing three times using PBS, the cells of the laser group and PMO@GO-GOD+laser group were irradiated by an 808 nm laser (1 W cm−2) for 5 min. After that, the old medium was removed and 150 μL of medium containing 10% CCK8 was added in each well of all the groups. Two hours later, the absorbance at 450 nm was measured for each well and the relative cell viability was evaluated.The live/dead assay was performed using live/dead stain kits with live cells being stained by Calcein-AM and dead cells being stained by prodium iodide (PI). MDA-MB-231 cells (5 × 10⁵ cells per well) were planted into a 12-well plate in L-5 medium for 24 h. There were six groups: control, laser, PMO, PMO@GO, PMO@GO-GOD, and PMO@GO-GOD+laser. Then, 500 μL of fresh medium containing PMO, and PMO@GO, PMO@GO-GOD (final concentration of 1 mg mL−1, PMO equiv.) was respectively added and the cells were incubated for another 12 h. For the control group and laser group, 500 μL of fresh medium was added. After washing three times using PBS, the cells of the laser group and PMO@GO-GOD+laser group were irradiated by an 808 nm laser (1 W cm−2) for 5 min. After that, the cells of the different groups were digested and washed by assay buffer, then resuspended in buffer (1 × 10⁵–6 cells per mL). 1–2 μL of Calcein-AM was added and cells were incubated for 20–25 min at 37 °C. Then, 3–5 μL of PI was added for 5 min. After washing by PBS, the cells were dropped on a clean microscope slide and photographed using a fluorescence microscope (Olympus, Japan).
2.9 Animal model establishment
All the animal experiments were performed following the rules of the National Institutes of Health Guide for the Care and Use of Laboratory Animals and obtained approval from the Ethical Committee of Guizhou Provincial People's Hospital. The Balb/c nude mice (5–7 weeks old, female) were purchased from SiPeiFu Biotechnology Co., Ltd (Beijing). After feeding for a week, 100 μL of MDA-MB-231 cells (5 × 10⁶ mL−1) were subcutaneously injected into the right back of the mice to establish xenograft models. After the tumor maximum diameters of the mice reached 10 mm, the following experiments were performed.2.10 ROS generation within tumor tissue
The mice bearing xenograft tumors were randomly assigned into four groups by adjusting their weights and tumor sizes (n = 3 per group), as follows: group 1: control (saline); group 2: PMO (50 μL, 4 mg mL−1, PMO equiv.); group 3: PMO@GO (50 μL, 4 mg mL−1, PMO equiv.); group 4: PMO@GO-GOD (50 μL, 4 mg mL−1, PMO equiv.). The corresponding agents were injected into the tumors of mice from each group at day 1, day 3 and day 6. At day 7, tumor tissues were collected, and ROS were detected by the Tissue Reactive Oxygen Species Assay Kit (BB-470515, BestBio, Shanghai, China) according to instructions. The emission at 610 nm were recorded to reflect the intensity of ROS under the excitation at 510 nm.2.11 Evaluating therapeutic effect and biocompatibility in vivo
The mice bearing xenograft tumors were randomly assigned into six groups by adjusting their weights and tumor sizes (n = 5 per group), as follows: group 1: control (saline); group 2: laser (808 nm, 1 W cm−2, 5 min); group 3: PMO (50 μL, 4 mg mL−1, PMO equiv.); group 4: PMO@GO (50 μL, 4 mg mL−1, PMO equiv.); group 5: PMO@GO-GOD (50 μL, 4 mg mL−1, PMO equiv.); group 6: PMO@GO-GOD (50 μL, 4 mg mL−1, PMO equiv.)+laser (808 nm, 1 W cm−2, 5 min). The corresponding agents were injected into tumors of mice from each group and laser irradiation was performed at day1, day 3 and day 6, if applicable. The tumor sizes were measured every three days, and the tumor volume (V) was calculated by using the equation: V = (X2 × Y)/2, where X is the maximum width and Y is the maximum length. The relative tumor volume was calculated by normalizing the tumor volume at day X to the tumor volume at day 0. Fourteen days later, the tumors of mice from each group were harvested for TUNEL and H&E staining.For evaluating the biosafety in vivo, healthy mice were randomly assigned into two groups (n = 3 per group): group 1: control (saline); group 2: PMO@GO-GOD (50 μL, 4 mg mL−1, PMO equiv.). The corresponding agents were intravenously injected, and weights of the mice were recorded every day. Seven days later, venous blood of the mice was collected for a routine blood and biochemical examination. The main organs, including liver, kidney, heart, spleen and, of the mice were collected for H&E staining.
2.12 Statistical analysis
GraphPad Prism 6 (GraphPad Software Inc., USA) and Origin 8 (OriginLab Inc., USA) software were applied for the statistical analysis and visualization. Continuous results are indicated as mean ± standard deviation. Variance analysis was used for the comparison of certain variables between two groups. The statistical difference existed when p < 0.05.3. Results and discussion
3.1 Characterization
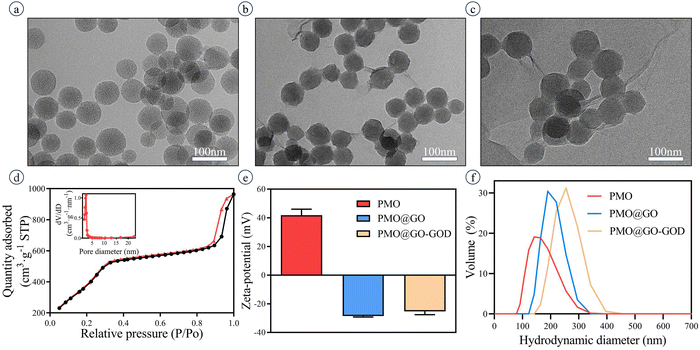
The TEM images show the well-defined spherical structure of PMO (Fig. 2a) with a diameter of 70 ± 7 nm. The nanoparticles exhibit a good dispersibility. After being successfully coated by GO sheets, the nanoparticles PMO@GO remain well-defined in structure and of satisfactory dispersibility (Fig. 2b). The size of PMO@GO-GOD is 77 ± 10 nm in the TEM image and slightly larger than that of PMO@GO (Fig. 2c). The mesoporous structure of PMO is verified by the nitrogen adsorption–desorption isotherm, which shows a typical IV curve (Fig. 2d). The pore size, pore volume and surface area were 3.7 nm, 1.57 cm3 g−1 and 1647 m2 g−1, respectively (Fig. 2d, inset). Because of the addition of APTES, the zeta potential of PMO in our study shows a positive charge of 42.9 ± 3.4 mV while it becomes −28.5 ± 0.7 mV after being coated with negatively charged GO sheets (Fig. 2e). The PMO@GO-GOD remains with a negative charge of −25.3 ± 2.7 mV because of the negative charge of GOD (Fig. 2e). The hydrodynamic size of PMO is about 138 nm, increases to about 190 nm after being coated with GOs, and further enlarges to 256 nm after linking GOD (Fig. 2f). The change of zeta potential, hydrodynamic size and TEM images indicates that GO sheets have successfully wrapped around the surface of PMO nanoparticles and that the GOD is linked.3.2 Verifying the successful anchoring of GOD on PMO@GO and its catalytic activity
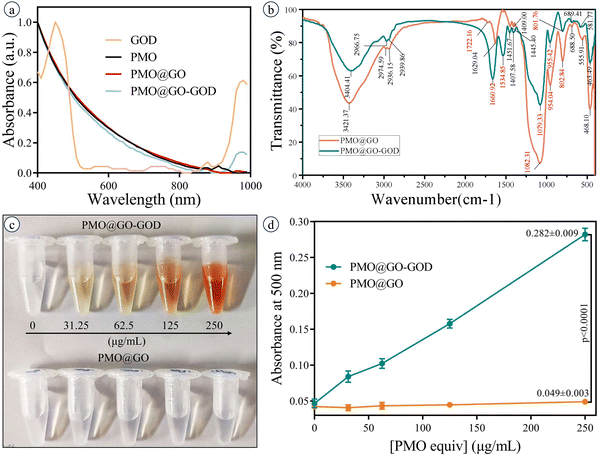
The PMO@GO-GOD shows a typical absorption peak at 970 nm, which is consistent with the absorption peak of GOD and indicates the successful modification of GOD (Fig. 3a). The FT-IR spectra of PMO@GO and PMO@GO-GOD display vibration peaks at ∼1080 cm−1 and ∼800 cm−1 (assigned to the asymmetric and symmetric stretching vibration of the Si–O–Si band), and ∼950 cm−1 (assigned to the flexural vibration of the Si–OH band)42 (Fig. 3b). These vibration peaks suggest the organosilicon structure of PMO@GO and PMO@GO-GOD. A vibration peak at about 1722 cm−1 (attributed to the C![[double bond, length as m-dash]](https://www.rsc.org/images/entities/char_e001.gif) O band) is observed for PMO@GO,43 while not clearly identified in PMO@GO-GOD. Instead, the amide I band and II band vibration peaks at 1660 cm−1 and 1534 cm−1 appear in the PMO@GO-GOD spectrum (Fig. 3b),44,45 which indicates GOD is successfully conjugated in the PMO@GO by the amino-carboxyl reaction. Then, the glucose oxidase activity of PMO@GO-GOD was tested. After adding the glucose oxidase activity assay working solution, the color of the PMO@GO-GOD solution changes from colorless to orange, while the PMO@GO solution remains colorless (Fig. 3c). The absorbance at 500 nm of the PMO@GO-GOD solution is significantly higher than that of the PMO@GO solution (p < 0.01) (Fig. 3d). The results suggest GOD remains active after being anchored on PMO@GO. By calculation, the glucose oxidase activity of PMO@GO-GOD is 5.12–6.40 U μg−1.
O band) is observed for PMO@GO,43 while not clearly identified in PMO@GO-GOD. Instead, the amide I band and II band vibration peaks at 1660 cm−1 and 1534 cm−1 appear in the PMO@GO-GOD spectrum (Fig. 3b),44,45 which indicates GOD is successfully conjugated in the PMO@GO by the amino-carboxyl reaction. Then, the glucose oxidase activity of PMO@GO-GOD was tested. After adding the glucose oxidase activity assay working solution, the color of the PMO@GO-GOD solution changes from colorless to orange, while the PMO@GO solution remains colorless (Fig. 3c). The absorbance at 500 nm of the PMO@GO-GOD solution is significantly higher than that of the PMO@GO solution (p < 0.01) (Fig. 3d). The results suggest GOD remains active after being anchored on PMO@GO. By calculation, the glucose oxidase activity of PMO@GO-GOD is 5.12–6.40 U μg−1.
3.3 Evaluating the peroxidase-like activity of the nanocatalyst
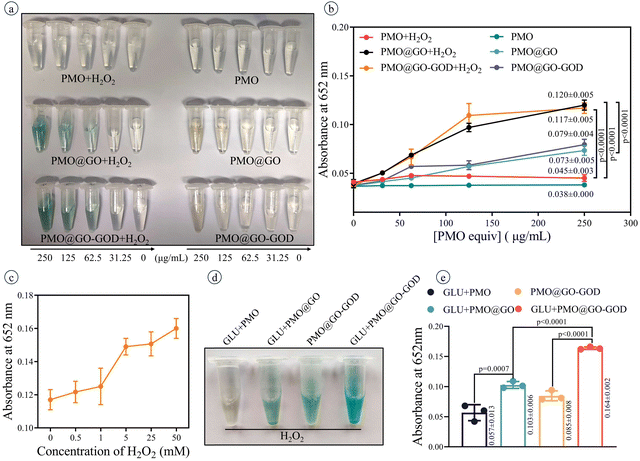
After adding TMB (a reagent for detecting peroxidase activity), the color of PMO@GO mixed with H2O2 changes to blue and a darker blue is observed when the concentration of PMO@GO increases (Fig. 4a). As a comparison, the color of PMO@GO without extra H2O2 shows a slight change, while the PMO and PMO mixed with H2O2 remain colorless (Fig. 4a). The absorbance at 625 nm of PMO@GO+H2O2 is significantly higher than those of the PMO@GO group and PMO+H2O2 group (both p < 0.0001) (Fig. 4b). The absorbance at 625 nm of PMO@GO increases with concentration of H2O2 after adding TMB for 30 min (Fig. 4c). These results confirm the peroxidase-like activity of PMO@GO, which is attributed to the GO sheets and can catalyze H2O2 to generate a hydroxyl radical. Meanwhile, we also observed that the color and absorbance at 625 nm of the PMO@GO+H2O2 group and PMO@GO-GOD+H2O2 group were similar (Fig. 4a and b) (p = 0.9206), which may be due to the lack of glucose in the reaction solution and that the GOD cannot play an active role to produce H2O2. Next, we verify that the peroxidase-like activity of PMO@GO can be enhanced by modifying GOD. The color of the PMO@GO-GOD+glucose group becomes obviously blue and its absorbance at 625 nm is significantly higher than that of the PMO@GO-GOD group and PMO@GO+glucose group (both p < 0.0001) (Fig. 4d and e). These results indicate that the loaded GOD can decompose the glucose into H2O2 to enhance the peroxidase-like activity of the GO sheets to generate more hydroxyl radicals. The PMO@GO-GOD can act as a sequential nanocatalyst with glucose oxidase and a peroxidase-like activity in a hybrid system.3.4 Photothermal performance of the nanocatalyst
The temperature of the PMO@GO-GOD solution increases with irradiation time and the photothermal efficiency depends on the concentration of PMO@GO-GOD (Fig. 5a). The temperature of PMO@GO-GOD (5 mg mL−1, PMO equiv.) increases about 33 °C after irradiation (1 W cm−2) for 10 min, while the ultrapure water shows only a 2.5 °C increase. Besides, the temperature increase also depends on the laser intensity (Fig. 5b). When 1 mg mL−1 PMO@GO-GOD solution is irradiated by a laser (808 nm, 1 W cm−2) for five on–off cycles, the temperature change is stable and exhibits a 22–23 °C increase for each bout of irradiation (Fig. 5c). These results indicate that the PMO@GO-GOD has a high photothermal efficiency and excellent photothermal stability.3.5 Evaluating the therapeutic effect in vitro
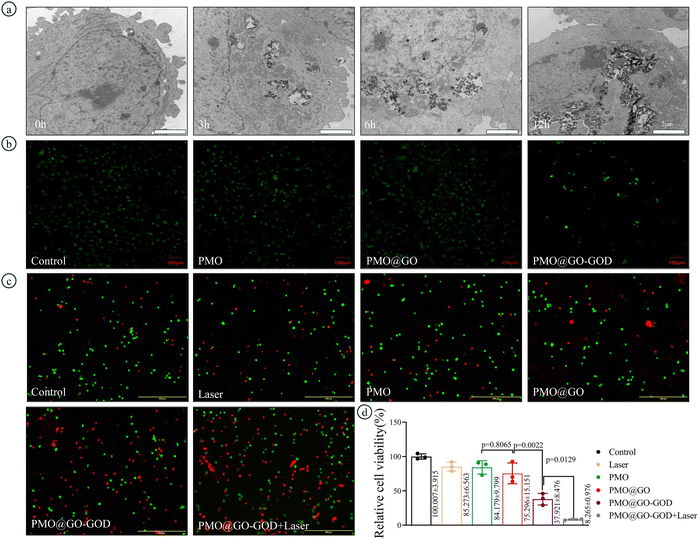
TEM images show the uptake progress of PMO@GO-GOD nanoparticles by MDA-MB-231 cells. The cellular uptake gradually increases with time and abundant PMO@GO-GOD nanoparticles are taken in after incubation for 24 h (Fig. 6a). The ROS was detected by DCFH-DA and observed by fluorescent micrographs. The fluorescent intensity of MDA-MB-231 cells incubated with PMO@GO-GOD is stronger than that of other groups (Fig. 6b), which indicates more ROS generation. Meanwhile, we also observe that cells of the PMO@GO-GOD groups are reduced (Fig. 6b). The reason may be that partial cells are damaged by hydroxyl radicals generated via the peroxidase-like activity of PMO@GO-GOD. Next, we evaluate the therapeutic effect in MDA-MB-231 cells via a CCK8 kit and live/dead cells stain kit. The relative cell viability is not significantly inhibited by PMO@GO when compared with that of PMO (p = 0.8065), while is obviously reduced in the PMO@GO-GOD group (p < 0.01) (Fig. 6d). Furthermore, tumor cells are injured more severely when treated with PMO@GO-GOD and laser irradiation (p < 0.05) (Fig. 6d). Similar results were observed in the live/dead cells assay (Fig. 6c). These results demonstrate that ROS is not sufficient for killing tumor cells by only using PMO@GO, while by introducing GOD in this nanosystem, the therapeutic effect can be elevated. What's more, the combination of cytotoxic ROS and photothermal therapy can further enhance the therapeutic effect for breast cancer cells.3.6 Evaluating therapeutic effect and biocompatibility in vivo
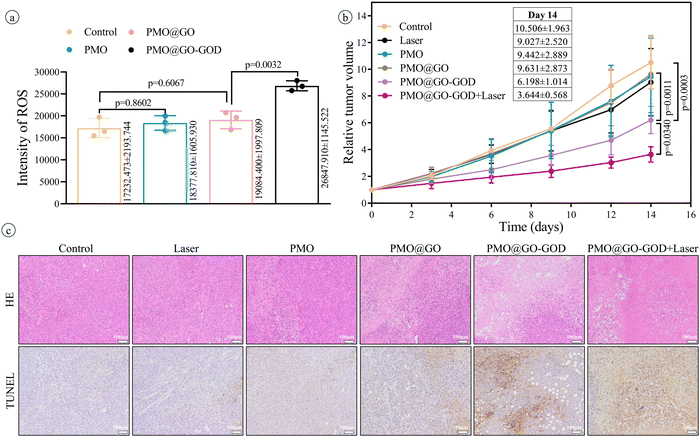
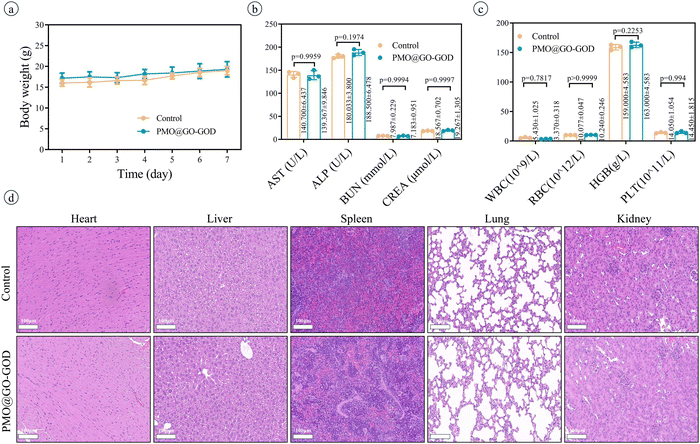
After injecting saline or PMO or PMO@GO or PMO@GO-GOD, the ROS in tumor tissue is detected by a dedicated tissue ROS assay kit. The ROS in the PMO@GO group shows no significant increase than that of the control group (p = 0.6067), while the PMO@GO-GOD group displays an obviously elevated ROS when compared with that of the PMO@GO group (p < 0.01) (Fig. 7a). The result suggests that PMO@GO-GOD can increase the generation of ROS in tumor tissue due to the modified GOD. Next, we assess the therapeutic effect in tumor-bearing mice by comparing relative tumor volumes. Tumor volumes of mice from the control, laser, PMO and PMO@GO groups increase with time and share a similar trend, while tumor growth rates become slower for the PMO@GO-GOD group and PMO@GO-GOD+laser group (Fig. 7b). At the end of treatment, the relative tumor volume of mice from the PMO@GO-GOD group is significantly inhibited when compared to that of the control group and PMO@GO group (both p < 0.01). A better therapeutic effect is observed in mice treated with PMO@GO-GOD and laser irradiation when compared with that of the PMO@GO-GOD group (p < 0.05) (Fig. 7b). Similarly, more necrotic and apoptotic tumor cells in the H&E staining and TUNEL staining sections are found in mice receiving PMO@GO-GOD and laser irradiation treatment (Fig. 7c). These results indicate that PMO@GO-GOD can provide sufficient ROS to kill tumor cells and the combination of cytotoxic ROS and photothermal therapy significantly improves the therapeutic effect for breast tumors.To assess biocompatibility in vivo, healthy mice were intravenously injected with PMO@GO-GOD, and then the relevant parameters were analyzed at day 7, with mice treated with saline as the control group. The body weights of mice from the PMO@GO-GOD and control groups display no significant reduction (Fig. 8a). There are no obvious differences in the main blood routine and biochemical results between the two groups (Fig. 8b and c) (all p > 0.05). The H&E staining sections of the main organs of the mice show no obvious damage after the administration of PMO@GO-GOD (Fig. 8d). These results manifest that the biocompatibility of PMO@GO-GOD in vivo is satisfactory, which can promote its application for biomedicine.
4. Conclusion
We construct a simple, biocompatible, and sequential catalytic nanocatalyst PMO@GO-GOD to realize enhanced CDT and photothermal therapy for combating breast cancers by taking advantage of the peroxidase-like activity of GO. The PMO@GO-GOD shows a well-defined structure, uniform size and good dispersibility. This nanocatalyst PMO@GO-GOD is verified to have glucose oxidase activity and peroxidase-like activity, and the peroxidase-like activity can be enhanced by modifying GOD. The GOD decomposes glucose in the tumor microenvironment into H2O2 to continually provide the catalytic substrate for the GO shells. Subsequently, the GO shells effectively catalyze H2O2 into hydroxyl radicals to kill tumor cells. Meanwhile, PMO@GO-GOD can also achieve an effective photothermal therapy due to its high photo-thermal efficiency. According to data from cell and animal experiments, ROS significantly increase in tumor cells and tumor tissues after administration with PMO@GO-GOD, and a remarkable therapeutic effect can be achieved by combining the CDT and photothermal therapy. Furthermore, there is no obvious weight reduction or organ damage in mice treated with PMO@GO-GOD, which confirms its good biocompatibility. Our study focuses on the peroxidase-like catalytic activity of GOs and constructs a simple, biocompatible, sequential catalytic nanocatalyst for effectively combating breast cancers.Ethics approval statement
All animal experiments were performed following the rules of the National Institutes of Health Guide for the Care and Use of Laboratory Animals and approval was obtained from the Ethical Committee of Guizhou Provincial People's Hospital (ID: EC Review (Animal) 2024-003).Author contributions
Zhenlu Yang: visualization; formal analysis; writing – original draft; writing – review & editing. Ying Zhao: data curation; formal analysis; writing – original draft. Zi Xu: software; data curation; formal analysis. Rongpin Wang: conceptualization; methodology; project administration. Qing Wang: supervision; validation; writing – review & editing.Conflicts of interest
The authors declare no conflict of interest.Acknowledgements
We greatly appreciate financial support from the National Natural Science Foundation of China (82001892) and Guizhou Provincial People's Hospital Talent Fund ([2023]-1).References
- Q. Liu, A. Zhang, R. Wang, Q. Zhang and D. Cui, A Review on Metal- and Metal Oxide-Based Nanozymes: Properties, Mechanisms, and Applications, Nano-Micro Lett., 2021, 13(1), 154, DOI:10.1007/s40820-021-00674-8.
- H. Wei and E. Wang, Nanomaterials with Enzyme-Like Characteristics (Nanozymes): Next-Generation Artificial Anzymes, Chem. Soc. Rev., 2013, 42(14), 6060–6093, 10.1039/c3cs35486e.
- J. Wu, X. Wang, Q. Wang, Z. Lou, S. Li, Y. Zhu, L. Qin and H. Wei, Nanomaterials with Enzyme-Like Characteristics (Nanozymes): Next-Generation Artificial Enzymes (II), Chem. Soc. Rev., 2019, 48(4), 1004–1076, 10.1039/c8cs00457a.
- P. N. Navya, S. Mehla, A. Begum, H. K. Chaturvedi, R. Ojha, C. Hartinger, M. Plebanski and S. K. Bhargava, Smart Nanozymes for Cancer Therapy: The Next Frontier in Oncology, Adv. Healthcare Mater., 2023, 12(25), e2300768, DOI:10.1002/adhm.202300768.
- D. Xu, L. Wu, H. Yao and L. Zhao, Catalase-Like Nanozymes: Classification, Catalytic Mechanisms, and Their Applications, Small, 2022, 18(37), e2203400, DOI:10.1002/smll.202203400.
- J. Yang, H. Yao, Y. Guo, B. Yang and J. Shi, Enhancing Tumor Catalytic Therapy by Co-Catalysis, Angew. Chem., Int. Ed., 2022, 61(17), e202200480, DOI:10.1002/anie.202200480.
- S. Li, B. Xu, M. Lu, M. Sun, H. Yang, S. Liu, Z. Huang and H. Liu, Tensile-Strained Palladium Nanosheets for Synthetic Catalytic Therapy and Phototherapy, Adv. Mater., 2022, 34(32), e2202609, DOI:10.1002/adma.202202609.
- L. Zhang, C. X. Li, S. S. Wan and X. Z. Zhang, Nanocatalyst-Mediated Chemodynamic Tumor Therapy, Adv. Healthcare Mater., 2022, 11(2), e2101971, DOI:10.1002/adhm.202101971.
- M. Xu, H. Gao, Q. Ji, B. Chi, L. He, Q. Song, Z. Xu, L. Li and J. Wang, Construction Multifunctional Nanozyme for Synergistic Catalytic Therapy and Phototherapy Based on Controllable Performance, J. Colloid Interface Sci., 2022, 609, 364–374, DOI:10.1016/j.jcis.2021.11.183.
- H. Lin, Y. Chen and J. Shi, Nanoparticle-triggered in Situ Catalytic Chemical Reactions for Tumour-specific Therapy, Chem. Soc. Rev., 2018, 47(6), 1938–1958, 10.1039/c7cs00471k.
- C. Jia, Y. Guo and F. G. Wu, Chemodynamic Therapy via Fenton and Fenton-Like Nanomaterials: Strategies and Recent Advances, Small, 2022, 18(6), e2103868, DOI:10.1002/smll.202103868.
- Y. Zhu, R. Zhao, L. Feng, C. Wang, S. Dong, M. V. Zyuzin, A. Timin, N. Hu, B. Liu and P. Yang, Dual Nanozyme-Driven PtSn Bimetallic Nanoclusters for Metal-Enhanced Tumor Photothermal and Catalytic Therapy, ACS Nano, 2023, 17(7), 6833–6848, DOI:10.1021/acsnano.3c00423.
- R. Zhao, Y. Zhu, J. Zhou, B. Liu, Y. Du, S. Gai, R. Shen, L. Feng and P. Yang, Dual Glutathione Depletion Enhanced Enzyme Catalytic Activity for Hyperthermia Assisted Tumor Therapy on Semi-Metallic VSe(2)/Mn-CS, ACS Nano, 2022, 16(7), 10904–10917, DOI:10.1021/acsnano.2c03222.
- R. Zhao, Y. Zhu, L. Feng, B. Liu, Y. Hu, H. Zhu, Z. Zhao, H. Ding, S. Gai and P. Yang, Architecture of Vanadium-Based MXene Dysregulating Tumor Redox Homeostasis for Amplified Nanozyme Catalytic/Photothermal Therapy, Adv. Mater., 2024, 36(2), e2307115, DOI:10.1002/adma.202307115.
- Y. Zhu, Z. Wang, R. Zhao, Y. Zhou, L. Feng, S. Gai and P. Yang, Pt Decorated Ti(3)C(2)T(x) MXene with NIR-II Light Amplified Nanozyme Catalytic Activity for Efficient Phototheranostics, ACS Nano, 2022, 16(2), 3105–3118, DOI:10.1021/acsnano.1c10732.
- M. Daniyal, B. Liu and W. Wang, Comprehensive Review on Graphene Oxide for Use in Drug Delivery System, Curr. Med. Chem., 2020, 27(22), 3665–3685, DOI:10.2174/13816128256661902011296290.
- A. M. Itoo, S. L. Vemula, M. T. Gupta, M. V. Giram, S. A. Kumar, B. Ghosh and S. Biswas, Multifunctional Graphene Oxide Nanoparticles for Drug Delivery in Cancer, J. Controlled Release, 2022, 350, 26–59, DOI:10.1016/j.jconrel.2022.08.011.
- D. F. Baez, Graphene-Based Nanomaterials for Photothermal Therapy in Cancer Treatment, Pharmaceutics, 2023, 15(9), 2286, DOI:10.3390/pharmaceutics15092286.
- V. Revuri, J. Mondal and Y. K. Lee, Graphene as Photothermal Therapeutic Agents, Adv. Exp. Med. Biol., 2022, 1351, 177–200, DOI:10.1007/978-981-16-4923-3_9.
- Z. Gu, S. Zhu, L. Yan, F. Zhao and Y. Zhao, Graphene-Based Smart Platforms for Combined Cancer Therapy, Adv. Mater., 2019, 31(9), e1800662, DOI:10.1002/adma.201800662.
- Y. Song, K. Qu, C. Zhao, J. Ren and X. Qu, Graphene Oxide: Intrinsic Peroxidase Catalytic Activity and Its Application to Glucose Detection, Adv. Mater., 2010, 22(19), 2206–2210, DOI:10.1002/adma.200903783.
- D. Wang, X. Song, P. Li, X. J. Gao and X. Gao, Origins of The Peroxidase Mimicking Activities of Graphene Oxide from First Principles, J. Mater. Chem. B, 2020, 8(39), 9028–9034, 10.1039/d0tb01765e.
- B. Lin, H. Chen, D. Liang, W. Lin, X. Qi, H. Liu and X. Deng, Acidic pH and High-H(2)O(2) Dual Tumor Microenvironment-Responsive Nanocatalytic Graphene Oxide for Cancer Selective Therapy and Recognition, ACS Appl. Mater. Interfaces, 2019, 11(12), 11157–11166, DOI:10.1021/acsami.8b22487.
- J. Wu, Z. Li, Y. Li, A. Pettitt and F. Zhou, Photothermal Effects of Reduced Graphene Oxide on Pancreatic Cancer, Technol. Cancer Res. Treat., 2018, 17, 1533034618768637, DOI:10.1177/1533034618768637.
- X. Zhang, Y. Wang, G. Luo and M. Xing, Two-Dimensional Graphene Family Material: Assembly, Biocompatibility and Sensors Applications, Sensors, 2019, 19(13), 2966, DOI:10.3390/s19132966.
- W. Hu, C. Peng, M. Lv, X. Li, Y. Zhang, N. Chen, C. Fan and Q. Huang, Protein Corona-Mediated Mitigation of Cytotoxicity of Graphene Oxide, ACS Nano, 2011, 5(5), 3693–3700, DOI:10.1021/nn200021j.
- O. Akhavan and E. Ghaderi, Toxicity of Graphene and Graphene Oxide Nanowalls Against Bacteria, ACS Nano, 2010, 4(10), 5731–5736, DOI:10.1021/nn101390x.
- W. Liu, W. Miao, Y. Li, D. He, Y. Tang, X. Guan, C. Li, F. Wu, J. Tang and S. Wang, Hybridized Double-Shell Periodic Mesoporous Organosilica Nanotheranostics for Ultrasound Imaging Guided Photothermal Therapy, J. Colloid Interface Sci., 2022, 608(3), 2964–2972, DOI:10.1016/j.jcis.2021.11.019.
- W. Tian, S. Wang, Y. Tian, X. Su, H. Sun, Y. Tang, G. Lu, S. Liu and H. Shi, Periodic Mesoporous Organosilica Coupled with Chlorin e6 and Catalase for Enhanced Photodynamic Therapy to Treat Triple-Negative Breast Cancer, J. Colloid Interface Sci., 2022, 610, 634–642, DOI:10.1016/j.jcis.2021.11.107.
- Z. Teng, W. Li, Y. Tang, A. Elzatahry, G. Lu and D. Zhao, Mesoporous Organosilica Hollow Nanoparticles: Synthesis and Applications, Adv. Mater., 2019, 31(38), e1707612, DOI:10.1002/adma.201707612.
- P. R. Salekdeh, L. Ma’mani, J. Tavakkoly-Bazzaz, H. Mousavi, M. H. Modarressi and G. H. Salekdeh, Bi-functionalized Aminoguanidine-PEGylated Periodic Mesoporous Organosilica Nanoparticles: A Promising Nanocarrier for Delivery of Cas9-sgRNA Ribonucleoproteine, J. Nanobiotechnol., 2021, 19(1), 95, DOI:10.1186/s12951-021-00838-z.
- W. Tian, Y. Su, Y. Tian, S. Wang, X. Su, Y. Liu, Y. Zhang, Y. Tang, Q. Ni and W. Liu, et al., Periodic Mesoporous Organosilica Coated Prussian Blue for MR/PA Dual-Modal Imaging-Guided Photothermal-Chemotherapy of Triple Negative Breast Cancer, Adv. Sci., 2017, 4(3), 1600356, DOI:10.1002/advs.201600356.
- Y. Cheng, X. Jiao, W. Fan, Z. Yang, Y. Wen and X. Chen, Controllable Synthesis of Versatile Mesoporous Organosilica Nanoparticles as Precision Cancer Theranostics, Biomaterials, 2020, 256, 120191, DOI:10.1016/j.biomaterials.2020.120191.
- W. Fan, N. Lu, Z. Shen, W. Tang, B. Shen, Z. Cui, L. Shan, Z. Yang, Z. Wang and O. Jacobson, et al., Generic Synthesis of Small-Sized Hollow Mesoporous Organosilica Nanoparticles for Oxygen-Independent X-ray-Activated Synergistic Therapy, Nat. Commun., 2019, 10(1), 1241, DOI:10.1038/s41467-019-09158-1.
- B. Guan, Y. Cui, Z. Ren, Z. A. Qiao, L. Wang, Y. Liu and Q. Huo, Highly Ordered Periodic Mesoporous Organosilica Nanoparticles with Controllable Pore Structures, Nanoscale, 2012, 4(20), 6588–6596, 10.1039/c2nr31662e.
- Z. Teng, C. Wang, Y. Tang, W. Li, L. Bao, X. Zhang, X. Su, F. Zhang, J. Zhang and S. Wang, et al., Deformable Hollow Periodic Mesoporous Organosilica Nanocapsules for Significantly Improved Cellular Uptake, J. Am. Chem. Soc., 2018, 140(4), 1385–1393, DOI:10.1021/jacs.7b10694.
- K. Dong, Z. Z. Zhao, J. Kang, L. R. Lin, W. T. Chen, J. X. Liu, X. L. Wu and T. L. Lu, Cinnamaldehyde and Doxorubicin Co-Loaded Graphene Oxide Wrapped Mesoporous Silica Nanoparticles for Enhanced MCF-7 Cell Apoptosis, Int. J. Nanomed., 2020, 15, 10285–10304, DOI:10.2147/IJN.S283981.
- A. V. Tran, K. Shim, T. T. Vo Thi, J. K. Kook, S. S. A. An and S. W. Lee, Targeted and Controlled Drug Delivery by Multifunctional Mesoporous Silica Nanoparticles with Internal Fluorescent Conjugates and External Polydopamine and Graphene Oxide Layers, Acta Biomater., 2018, 74, 397–413, DOI:10.1016/j.actbio.2018.05.022.
- Y. Tang, H. Hu, M. G. Zhang, J. Song, L. Nie, S. Wang, G. Niu, P. Huang, G. Lu and X. Chen, An Aptamer-targeting Photoresponsive Drug Delivery System Using “Off-On” Graphene Oxide Wrapped Mesoporous Silica Nanoparticles, Nanoscale, 2015, 7(14), 6304–6310, 10.1039/c4nr07493a.
- J. Zhang, X. Wang, J. Wen, X. Su, L. Weng, C. Wang, Y. Tian, Y. Zhang, J. Tao and P. Xu, et al., Size Effect of Mesoporous Organosilica Nanoparticles on Tumor Penetration and Accumulation, Biomater. Sci., 2019, 7(11), 4790–4799, 10.1039/c9bm01164a.
- Z. L. Yang, W. Tian, Q. Wang, Y. Zhao, Y. L. Zhang, Y. Tian, Y. X. Tang, S. J. Wang, Y. Liu and Q. Q. Ni, et al., Oxygen-Evolving Mesoporous Organosilica Coated Prussian Blue Nanoplatform for Highly Efficient Photodynamic Therapy of Tumors, Adv. Sci., 2018, 5(5), 1700847, DOI:10.1002/advs.201700847.
- M. B. Alkindy, V. Naddeo, F. Banat and S. W. Hasan, Synthesis of Polyethersulfone (PES)/GO-SiO(2) Mixed Matrix Membranes for Oily Wastewater Treatment, Water Sci. Technol., 2020, 81(7), 1354–1364, DOI:10.2166/wst.2019.347.
- H. Zhai, L. Huang, Z. Chen, Z. Su, K. Yuan, G. Liang and Y. Pan, Chip-based Molecularly Imprinted Monolithic Capillary Array Columns Coated GO/SiO2 for Selective Extraction and Sensitive Determination of Rhodamine B in Chili Powder, Food Chem., 2017, 214, 664–669, DOI:10.1016/j.foodchem.2016.07.124.
- J. Xie, F. Yang, H. Shi, J. Yan, H. Shen, S. Yu, N. Gan, B. Feng and L. Wang, Protein FT-IR Amide Bands Are Beneficial to Bacterial Typing, Int. J. Biol. Macromol., 2022, 207, 358–364, DOI:10.1016/j.ijbiomac.2022.02.161.
- E. Mitri, S. Kenig, G. Coceano, D. E. Bedolla, M. Tormen, G. Grenci and L. Vaccari, Time-resolved FT-IR Microspectroscopy of Protein Aggregation Induced by Heat-shock in Live Cells, Anal. Chem., 2015, 87(7), 3670–3677, DOI:10.1021/ac5040659.
| This journal is © The Royal Society of Chemistry 2024 |

