
Novel ternary AgIICoIIIF5 fluoride: synthesis, structure and magnetic characteristics†‡
Daniel
Jezierski
 *a,
Zoran
Mazej
*b and
Wojciech
Grochala
*a
*a,
Zoran
Mazej
*b and
Wojciech
Grochala
*a
aCenter of New Technologies, University of Warsaw, 02089 Warsaw, Poland. E-mail: d.jezierski@cent.uw.edu.pl; w.grochala@cent.uw.edu.pl
bDepartment of Inorganic Chemistry and Technology, Jožef Stefan Institute, Jamova cesta 39, 1000 Ljubljana, Slovenia. E-mail: zoran.mazej@ijs.si
First published on 26th April 2024
Abstract
We present a new compound in the silver–cobalt-fluoride system, featuring paramagnetic silver (d9) and high-spin cobalt (d6), synthesized by solid-state method in an autoclave under F2 overpressure. Based on powder X-ray diffraction, we determined that AgIICoIIIF5 crystallizes in a monoclinic system with space group C2/c. The calculated fundamental band-gap falls in the visible range of the electromagnetic spectrum, and the compound has the character of charge-transfer insulator. AgCoF5 is likely a ferrimagnet with one predominant superexchange magnetic interaction constant between mixed spin cations (Ag–Co) of −62 meV (SCAN result). Magnetometric measurements conducted on a powdered sample allowed the identification of a transition at 128 K, which could indicate magnetic ordering.
Introduction
The world of transition metal fluorides is already quite rich, but a large number of even simple bimetallic systems are still awaiting to be discovered. The same applies to mixed-valence fluoride compounds. For example, only three crystal structures of mixed-valence transition metal homodimetallic pentafluorides are currently known: Cr2F5,1 Mn2F5![[thin space (1/6-em)]](https://www.rsc.org/images/entities/char_2009.gif) 2 and Ag2F5.3 The first two, Cr2F5 and Mn2F5, crystallize in the monoclinic space group C2/c and exhibit two paramagnetic metal sites, that show antiferromagnetic ordering between the spins below 40 K1 and 53 K,2 respectively. The third, AgIIAgIIIF5, crystallizes in a triclinic structure (P
2 and Ag2F5.3 The first two, Cr2F5 and Mn2F5, crystallize in the monoclinic space group C2/c and exhibit two paramagnetic metal sites, that show antiferromagnetic ordering between the spins below 40 K1 and 53 K,2 respectively. The third, AgIIAgIIIF5, crystallizes in a triclinic structure (P![[1 with combining macron]](https://www.rsc.org/images/entities/char_0031_0304.gif) ) and possess diamagnetic low-spin AgIII. In addition, one compound, Cu2F54 has been predicted theoretically, while four others, Ni2F5,5 Co2F5,6 Fe2F57 and V2F5,8 have been postulated as intermediates in the thermal decomposition of the corresponding TMF3 (TM – transition metal), for the first three, or its hydrate, for the V compound.
) and possess diamagnetic low-spin AgIII. In addition, one compound, Cu2F54 has been predicted theoretically, while four others, Ni2F5,5 Co2F5,6 Fe2F57 and V2F5,8 have been postulated as intermediates in the thermal decomposition of the corresponding TMF3 (TM – transition metal), for the first three, or its hydrate, for the V compound.
The family of heterobimetallic AIIBIIIF5 compounds, although limited in number, demonstrates remarkable diversity (see Section I. in ESI‡).1,9–16 These includes pentafluorides with two transition metals, such as: CrTiF5,1 CrVF5,1 MnCrF5,17 CdMnF5.9 All known examples of pentafluorides with two paramagnetic sites are limited to early transition metals, late transition metal pentafluorides have not been reported.
To date, no pentafluorides with a paramagnetic transition metal (TM) ion in the trivalent state (TMIII) have been documented within the AgIITMF5 series. Only AgAuF5, which exhibits Au in its low-spin diamagnetic trivalent state (AuIII), has been postulated18 to be isostructural with the triclinic CuAuF5 homolog. Further investigation of Ag–TM–F phases identified four compounds that may exhibit magnetic interactions between divalent silver (AgII) and transition metals (TM). These compounds include AgMnIVF6,19 which is characterized by a Curie–Weiss constant of −66 K, and others such as AgRhIVF6,20 AgRuVF721 and AgIrVF7.21 However, the exact crystal structures of the Mn and Rh analogs and a detailed elucidation of the magnetic behavior of all compounds are still unresolved. This knowledge gap has initiated theoretical investigations of the magnetic coupling mechanisms between Ag and paramagnetic transition metals in possible fluoride systems.22–24 Remarkably, significant inter-metal magnetic superexchange constants of −45.9 meV for Ag–CuII and −33.3 meV for Ag–NiII22 systems have been calculated in theoretical AgTMF4 models (with TM = Cu or Ni). The question naturally arises whether other TM/AgII systems with even stronger magnetic interactions can be prepared.
In this study, we present a new member of the mixed-valence transition dimetal fluorides – AgCoF5. The precursors of this compound – AgF2 and CoF3, exhibit antiferromagnetic behavior below 163 K25 and 460 K,26 respectively. AgF2 is a 2D antiferromagnet,27 while CoF3 has a G-type antiferromagnetic structure.26,28 Of these two binary fluorides, AgF2 is recognized as a high temperature superconductor (HTSC) precursor,27,29,30 which has recently led to extensive investigations into its possible doping.31–38
In this paper, the crystal structure, magnetic, and electronic properties of AgCoF5 are described and supported by theoretical analysis.
Results and discussion
Synthesis
The successful synthesis of AgCoF5 was achieved by a solid-state high-temperature reaction with a stoichiometric mixture of AgF2 and CoF3 compounds at F2 overpressure, as presented in eqn (1). First, the mixture was carefully ground on the mortar in a glovebox under argon atmosphere, then transferred to a nickel boat and hermetically sealed in a nickel autoclave. The autoclave was then removed from the glovebox and connected to a vacuum line. Argon was pumped away from the reaction vessel, and the system was pressurized with F2 gas (up to 5 bar). The mixture underwent heating at 520 °C for 24 hours. Excess fluorine prevents the thermal decomposition of AgII to AgI fluoride, and that of CoIII to CoII.39 After cooling the reactor and evacuating the fluorine gas, the reactor was returned to the glovebox. The middle part of the sample was extracted from the boat to avoid contamination by nickel. The mixture was further ground and subjected to the similar conditions as before (under F2 overpressure at 480 °C for 24 hours). The resulting product, a brown powder (sample designated S1), was characterized using various analytical methods.| AgF2 + CoF3 → AgCoF5 | (1) |
In our next experimental approach, we investigated the potential for the formation of a structure with mutual miscibility at the positions of metal atoms, similar to the observed behavior in AgF2/CuF2 mixtures.24 To investigate this, we started the synthesis with a mixture of AgF2 and CoF2 at a molar ratio of 0.7:0.3 under the same conditions as in the first approach (eqn (1)). Upon XRD analysis, we identified the presence of two distinct phases in the final product: AgCoF5 and AgF2 (sample S2), with the respective near equimolar ratio (0.44:0.56) determined by Rietveld refinement (see Fig. SI2 in the ESI‡). Crucially, our measurements revealed no change in the Néel temperature (TN) for AgF2, which remained at 163 K.
Given that the volume of the phases identified as AgCoF5 and AgF2 in the second approach practically coincides with the volume assigned in the first experiment (eqn (1), and also refer to Table SI1 in the ESI‡), we assume that solubility of the cations or partial mutual substitution at the corresponding cation sites24 is unlikely under these conditions. This assertion is also supported by the large differences in atomic radii between CoIII (R = 88.5 pm) and AgII (R = 108 pm).
Crystal structure of AgCoF5
The crystal structure of AgCoF5 was elucidated by powder X-ray diffraction of a polycrystalline sample obtained according to eqn (1) (Fig. 1). The preliminary phase analysis of the diffractogram showed the predominant presence of an unknown crystalline phase and trace amounts of AgF2. All reflections corresponding to the unidentified phase in the diffraction pattern were selected for the indexing procedure using X-Cell implemented in the Materials Studio software.40 Consequently, the software suggested a monoclinic structure with a unit cell volume twice as small as the unit cell of final structure of AgCoF5 presented in Table 1. By reviewing the ICSD database, we found that CrIICrIIIF5 (C2/c, no. 15, Z = 4) has similar diffraction pattern features to our new unknown phase. Therefore, we took the structure of Cr2F5 as a starting point for the geometry optimization of AgCoF5 (using DFT+U method), substituting CrII and CrIII atoms with AgII and CoIII, respectively. Following the geometry optimization of such a structure, a Rietveld refinement was performed using the results of the theoretical calculations of AgCoF5 and experimental XRD pattern (Fig. 1), resulting in good fitting parameters (Table 1).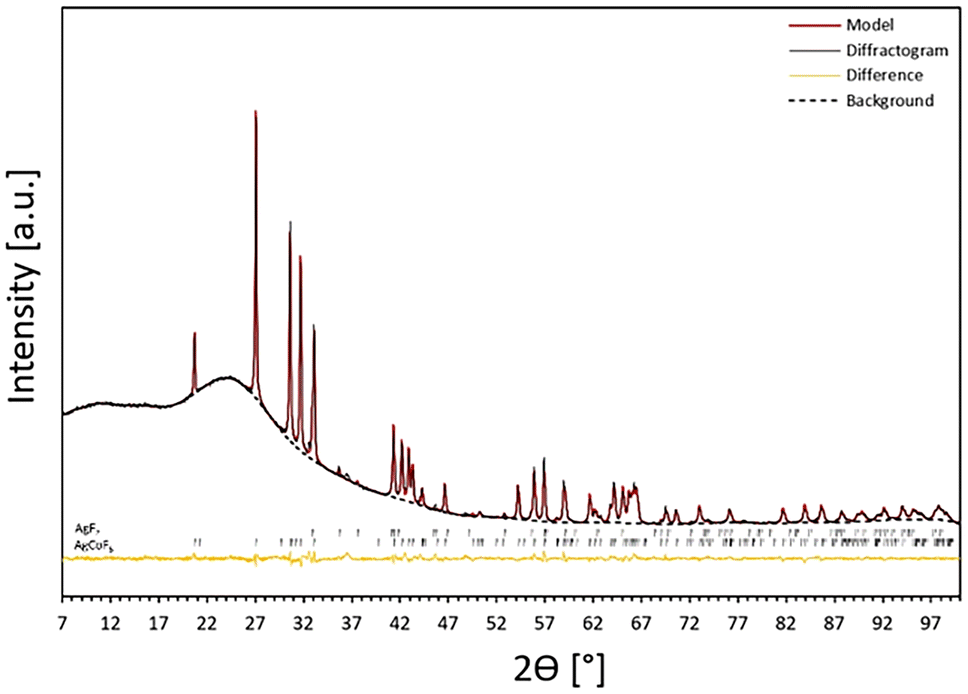 | ||
| Fig. 1 Powder XRD pattern for S1 (black line): mainly AgCoF5 (96%) with traces of AgF2 (4%), next to the refined model (red) and the fitted background (as black dashed line). The black markers indicate reflex positions for the AgF2 and AgCoF5 model phases for the Co Kα1 line. The differential profile is marked in orange (see also Fig. SI1 in ESI‡). | ||
| Formula | AgCoF5 |
| Crystal system | Monoclinic |
| Space group (number) | C2/c (15) |
| a, b, c [Å] | 7.274414 (2), 7.627744 (2), 7.529471 (2) |
| α = γ, β [°] | 90, 115.976(4) |
| Z | 4 |
| V [Å3] | 375.580 (19) |
| Temperature, radiation type, range | 298 K, Co Kα, 7°–100° of 2Θ |
| Fit parameters | GOF = 1.66%, Rp = 1.12%, wRp = 1.68% |
Considering the final structure of AgCoF5, we also performed comparative analysis between space group C2/c (Z = 4) and its counterpart C2/m (Z = 2). The presence of a two-fold axis (C2) is observed in both groups. However, the distinct structural variations emerge from the different orientation of the symmetry plane in relation to this axis. In particular, in the monoclinic C2/c space group, the symmetry plane is oriented perpendicular to the binary axis. In the C2/m space group, on the other hand, the arrangement is such that the symmetry plane is aligned parallel to the two-fold axis. The result of this orientation of the symmetry plane is the presence of Co–F–Co chains without any tilting (bond angle of 180 degrees), with larger interatomic distances of the metal sites along the c axis compared to the C2/c type (check Fig. SI4 in ESI‡). This symmetry is quite uncommon, as none of the AIIBIIIF5 compounds exhibit it (see Section I. in ESI‡). Nevertheless, a comparative analysis of both structural forms was performed to clarify the final structure of AgCoF5. The structure of AgCoF5 in both proposed structural solutions is detailed in the ESI,‡ where a comprehensive analysis of its features is also provided.
We have also performed a comparative computational analysis of the ground state (GS) energies and dynamic stability for both structural solutions. Our calculations demonstrate that the C2/c space group is energetically more favorable, with an energy lower by 4.51 meV per f.u. compared to C2/m (DFT+U).
Moreover, the latter displays dynamic instability, evidenced by three imaginary phonon branches, while the former has no imaginary phonons (see ESI‡ for detailed information).
Indeed, if the C2/m space group is assumed for the Rietveld refinement procedure using the experimental diffraction pattern, it proves to be insufficient for the description the AgCoF5 structure. First, it leads to absence of several reflections – in particular at 45.7, 52.1, 52.7, 58.2 of 2θ, which are observable in the experimental data (but present for the C2/c space group), and (2) the fitting parameters are much worse to those obtained for the C2/c model (see Table SI5 and Fig. SI3 in the ESI‡). This led us to conclude that the C2/c space group accurately represents the crystal structure of the AgCoF5 compound.
The key structural information of AgCoF5 (C2/c) from the Rietveld refinement is presented in the Table 1. Further details are provided in Table SI2.‡
The experimentally determined parameters of the AgCoF5 unit cell were compared with the theoretical values from calculations, and the data are shown in Table SI3.‡ The best agreement between the Rietveld method and the theoretical values is observed for the DFT+U (UAg = 5 eV) and HSE06 methods, where calculations slightly underestimate and overestimate AgCoF5 volume by 0.07% and 0.34%, respectively. For DFT+U (U = 8 eV), the volume of the unit cell is underestimated more – by 1.36%. However, the largest discrepancy is observed with the SCAN method – the volume is by 1.87% larger than experimental data.
The intermetallic distances between the paramagnetic centers are defined by the lattice vectors. Specifically, the interatomic Ag–Co distance along the a-axis is determined to be 3.814(10) Å, while the corresponding distance along the b-axis is 3.637(10) Å. The nearest Co–Co and Ag–Ag contacts oriented along [100], appear as 3.765(10) Å (more detailed and theoretical data are explained in Table SI4‡). The fluorine atoms are the completing elements of the structure. They act as important bridging elements linking metal ions, thus creating a distinct network of metal–fluorine bonds and playing a crucial role in the magnetic properties of the compound.
A salient structural motif in the C2/c AgCoF5 framework comprises alternating Co–F–Co chains and Ag–F–Ag rectangles aligned along the c-axis – [001] direction (Fig. 2) in the (010) plane. The bond angles in these Co–F–Co chains are less than 180° and the tilt is determined to be 162.0(3)°. In contrast, there are no chain-like Ag–F–Ag connections. Along the c crystallographic axis, the Ag–F bonds are generally the longest, as shown in Fig. 4B. The Ag⋯Ag connections are bridged by two fluorine atoms along [001] and form a rectangle with an Ag–F–Ag angle of 107.6(5)°. These fluorine atoms simultaneously form covalent bonds with cobalt atoms, creating a composite structural network. Orthogonal to the Co–F–Co chains is a rectangular lattice of paramagnetic centers – silver and cobalt (001), which are bridged by fluorine atoms. The Ag–F–Co bonds have a corrugated arrangement; their angles are 158.9(12)° along the [010] direction and 127.9(8)° along the [100] direction (Fig. 2 and 3). All angles determined using theoretical and experimental methods are summarized in Table SI4 in the ESI.‡
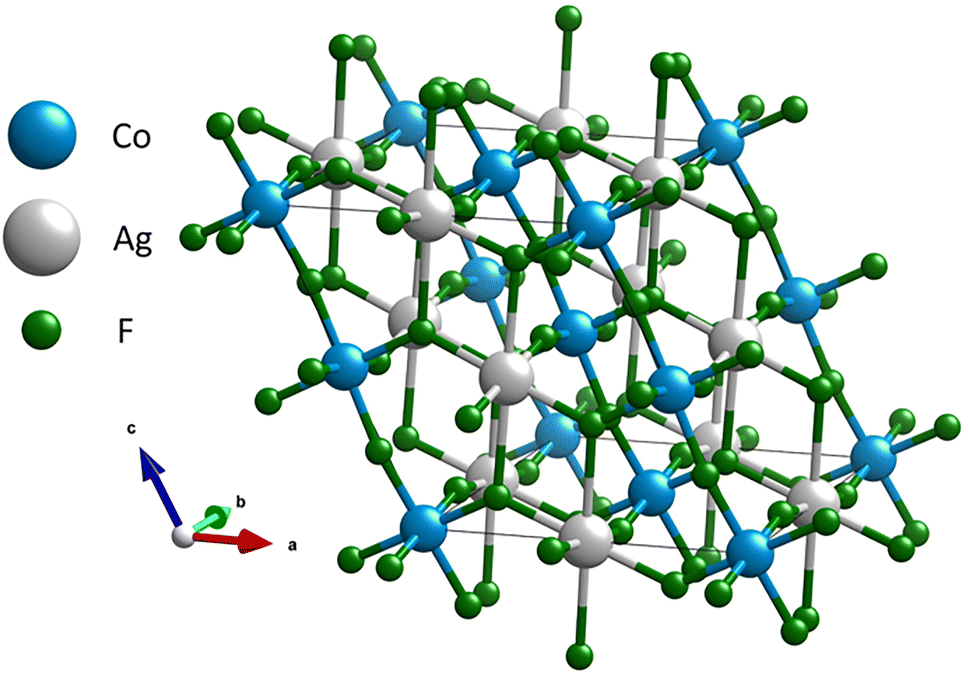 | ||
| Fig. 2 Structure of AgCoF5. Color code: grey for silver, blue for cobalt and green for fluorine atoms. | ||
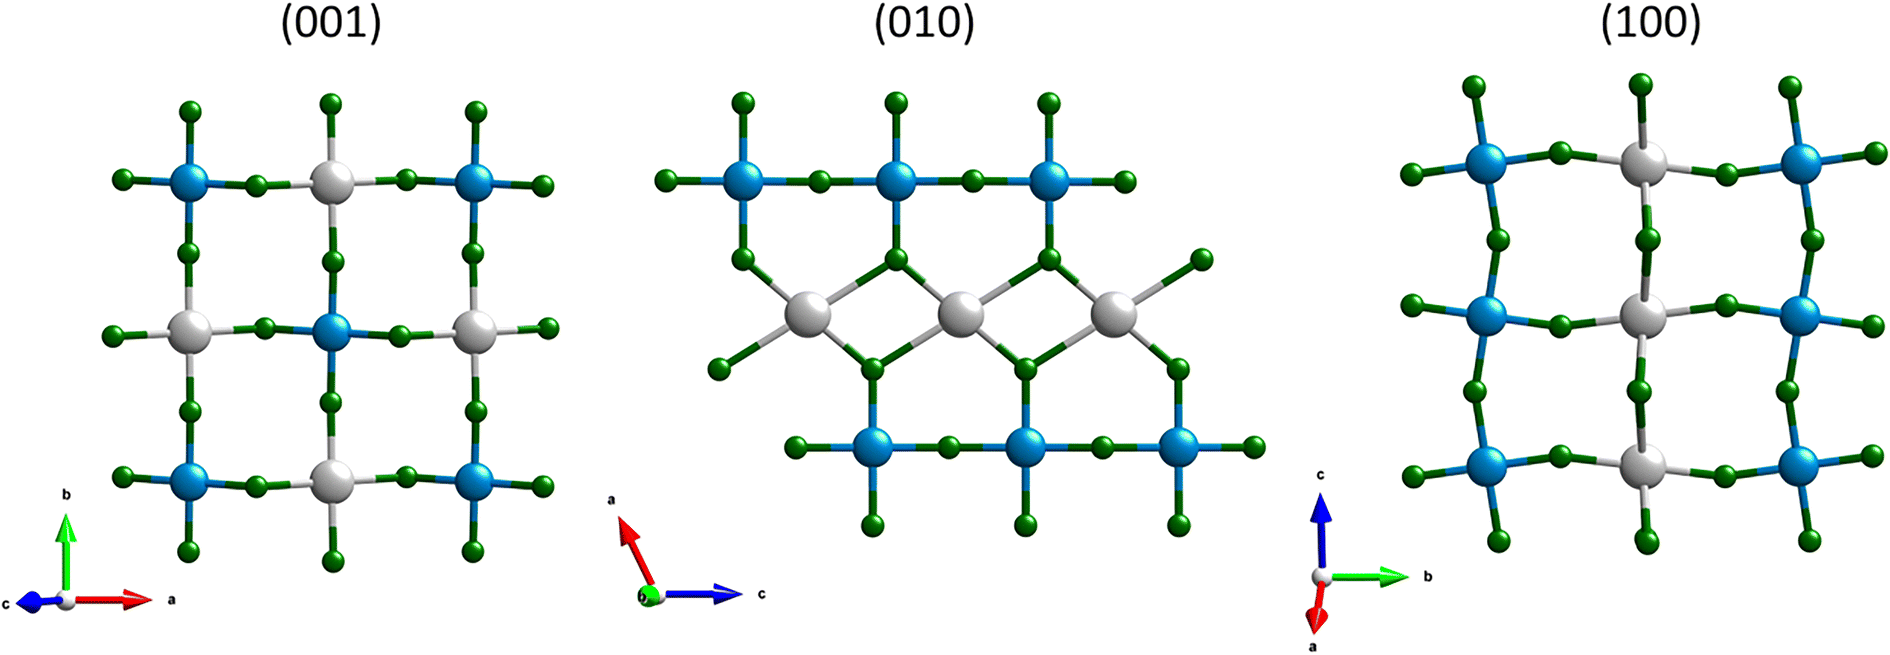 | ||
| Fig. 3 Projections of the AgCoF5 structure, from left: along c axis (001), centre – along the b axis (010) and right – along the a axis (100). Colour code: grey for silver, blue for cobalt and green for fluorine atoms. For further details see Table SI4 in the ESI.‡ | ||
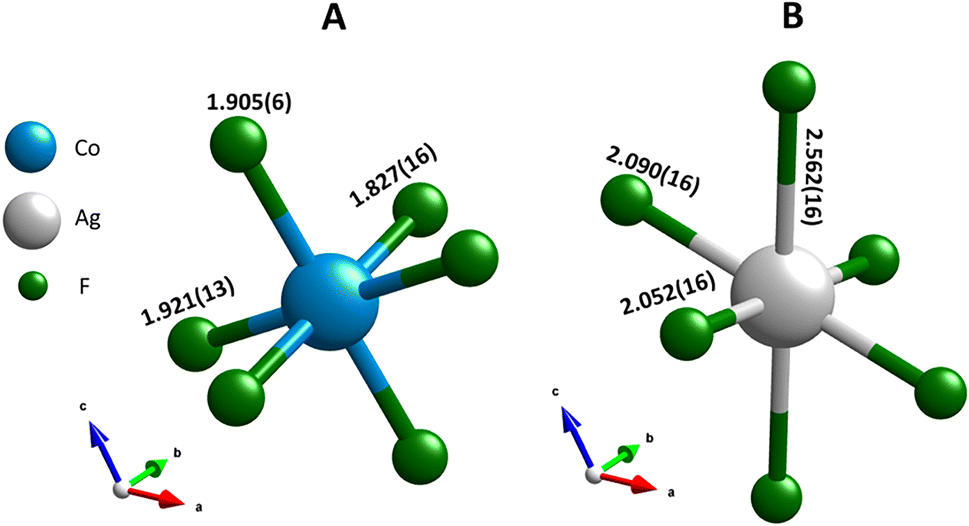 | ||
| Fig. 4 The first coordination sphere for (A) cobalt and (B) silver, both with CN = 6. The M–F bonds lengths are expressed in Å, following Rietveld refinement. | ||
The first coordination sphere of cobalt forms a distorted octahedral configuration (CN = 6), as presented in Fig. 4A. Such as distortion is also observed in CoF3 and can be attributed to the Jahn–Teller effect, which applies to the high-spin d6 electronic configuration.28 This distortion in AgCoF5 is manifested by the presence of three distinct sets of Co–F bond lengths: 2 × 1.827(16) Å, 2 × 1.905(6) Å, and 2 × 1.921(13) Å. The elongation of these bonds is aligned along specific crystallographic axes, with the longest Co–F bond along the [100] direction, the second longest along [001], and the shortest along the [010] b-axis. A comparative analysis of the computational data, derived from density functional theory augmented with Hubbard U (DFT+U), and the Rietveld refinement results reveal a general agreement with the observed trend (ESI, Table SI4‡).
In the primary coordination environment, the silver atoms exhibit a configuration that deviates strongly from the ideal octahedral symmetry (CN = 6), as can be seen in Fig. 4B. This distortion, which is similar to that found in pure AgF2, is primarily attributed to the pronounced Jahn–Teller effect, which is a characteristic feature of the d9 electron configuration of divalent silver.25 The manifestation of this effect is evident in the three distinct categories of Ag–F bond lengths within the coordination sphere: two bonds with a length of 2.052(16) Å [010], two others of 2.090(16) Å [100] and the last pair with 2.562(16) Å [001]. The computational methods provide closely matched results with a maximum deviation of 1.77% between experimental and theoretical Ag–F bond lengths in the (001) plane (HSE06 functional; for all methods see Table SI4‡).
The structural properties of AgCoF5 described above have a profound influence on the vibrational spectra of this compound (phonons) as well as its magnetic and electronic properties. Let us take a look at the phonons.
Vibrational spectra of AgCoF5
In the case of the space group C2/c, the crystallographic unit cell is twice as large as the Bravais cell.41,42 According to group theory, one should therefore expect 42 phonon vibrations of the lattice for AgCoF5 (Z = 2 for the primitive cell). Of these, 12 are silent (Au) and 3 are translational (2Bu and Au). Consequently, 12 modes are infrared active: 12Bu, while 15 are active in Raman spectroscopy: 8Bg + 7Ag.Fig. 5 shows comparison of the experimental IR and Raman spectra for AgCoF5 (lines) with the theoretical positions of the bands (dashed). The assignment of the observed band positions in the spectra shown (Fig. 5), along with their theoretical positions and symmetry (based on DFT+U calculations), is presented in Table SI6 in the ESI.‡
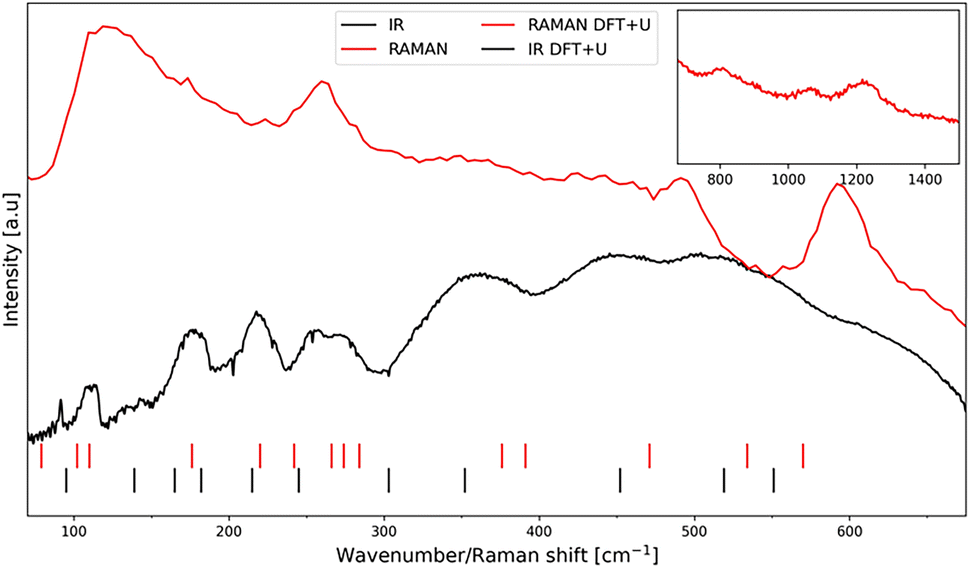 | ||
| Fig. 5 The Raman spectrum (red line) and the infrared absorption spectrum (black line) together with the positions of the phonon vibrations based on DFT+U calculations (red and black dashes) (for exact positions see Table SI6‡). An extended range for Raman spectroscopy measurement is shown in the upper right corner of the image. | ||
In general, we find a very good agreement between the vibrational positions for the AgCoF5 lattice as predicted by computational methods and the positions in the experimental spectra. This is evidenced by a high correlation coefficient R2 = 0.9976 (Fig. 6). In addition, the wavenumbers of the translational (acoustic) modes are calculated with an error of ±2 cm−1, suggesting that the positions of other vibrations may have similarly small deviations (Table SI6‡). Overall, we succeeded to assign 12 out of 15 Raman-active modes (with the exception of one Ag vibration calculated at 534 cm−1 and two low-frequency modes that fall below our bottom experimental range). Also, we assigned 9 out of 12 IR-active modes (with two absent Bu vibrations calculated at 303 cm−1 and 165 cm−1, and one falling below our experimental range). Their absence in the spectra could be due to the low intensity of the corresponding bands or/and too much background noise.
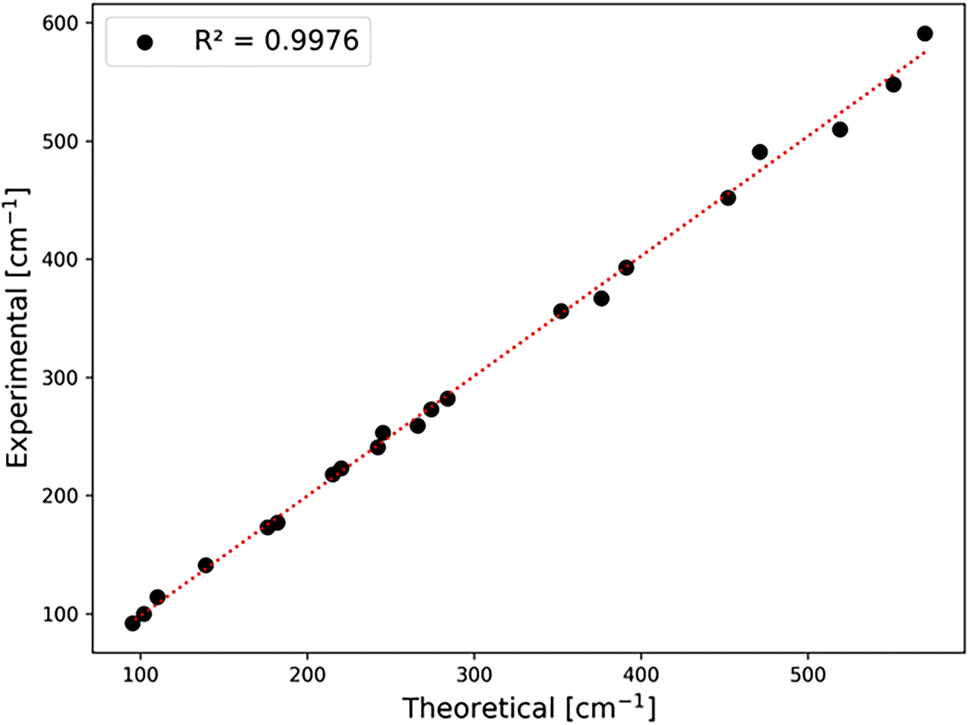 | ||
| Fig. 6 Correlation between experimental and theoretical positions for bands observed in the spectra. For exact band positions from IR and Raman spectra, cf. Table SI6 in the ESI.‡ | ||
Magnetic properties of AgCoF5
To evaluate the magnetic nature of the compound, we performed magnetic measurements on a polycrystalline AgCoF5 sample (S1) using SQIUD (Superconducting Quantum Interference Device). In addition, we performed Density Functional Theory (DFT) calculations to deepen our understanding of the magnetic behavior. Unfortunately, it was not possible to obtain samples of AgCoF5 that were free of traces of AgF2. The sample S1 taken for the magnetic measurements contained about 4 mol% of AgF2, as revealed by Rietveld refinement. Its presence is also confirmed by a transition in the magnetic susceptibility curve at 163 K, indicative of AgF2 (in particular in the −dχ/dT curve, see Fig. 7). Thus, while we can detect the transition temperature typical of AgCoF5, we decided not to determine the effective magnetic moment and the paramagnetic Curie–Weiss temperature (θ) which are strongly affected by the AgF2 impurity.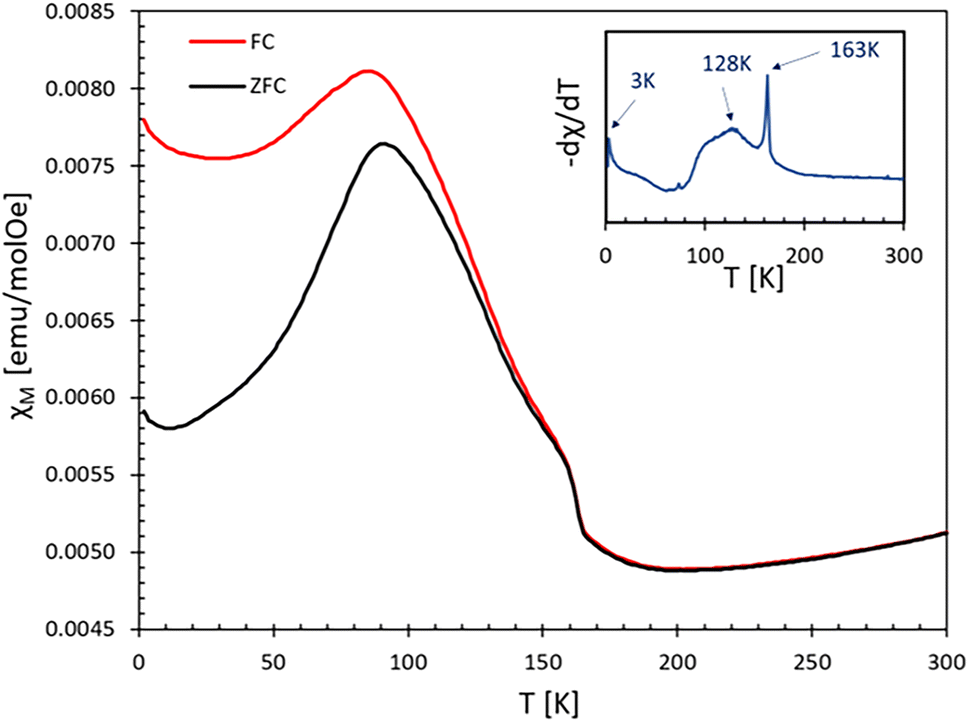 | ||
| Fig. 7 Magnetic susceptibility χ of the sample at 10 kOe. For FC regime −dχ/dT vs. T shown in the inset. | ||
Fig. 7 displays the magnetic susceptibility χ(T) of the sample, measured from 2 to 300 K under both zero-field-cooled (ZFC) and field-cooled (FC) conditions at 10 kOe. The magnetic behavior of the sample is rather complex, however, based on the maximum value of −dχ/dT (FC) we determined three transition temperatures: two associated with AgCoF5, T1 = 128 K and T2 = 3–9 K (depending on the applied field, see Fig. SI5 in ESI‡) and one for AgF2 with TN = 163 K. Between the temperatures of 300 K and 163 K, a decrease in magnetization with temperature is observed. This could indicate the existence of short-range antiferromagnetic (AFM) ordering in AgCoF5 in this temperature range, similar to that observed in KAgF3.43 On the other hand, the ordering at T2 is unspecific, as it may originate from a minute amount of any ferromagnetic impurities.
Below the transition temperature (128 K), a noticeable divergence in the temperature-dependent behavior of the magnetic susceptibility between the zero-field-cooled (ZFC) and field-cooled (FC) regimes can be observed. A similar feature is seen in pure AgF2 samples (see Fig. SI6‡), where the weak ferromagnetism below the Néel temperature (TN) is related to the spin-canting of silver(II), due to the Dzyaloshinskii–Moriya interaction.44,45 A similar explanation for the weak ferromagnetism of AgCoF5 below 128 K can be postulated. It should be noted that the canting of Ag2+ is likely to be more pronounced than that of Co3+, as the former exhibits a stronger spin–orbit coupling. In the structure of AgCoF5, the magnetic interactions within the square spin lattice parallel to the (001) plane are limited to the silver and cobalt atoms. In contrast, the interactions along the [001] direction are predominantly limited to homoatomic contacts, especially between two silver sites, and are similar to interlayer contacts observed in AgF2 (Fig. 3).
In addition, the presence of AgF2 traces with AgCoF5 in S1 can be used for comparison purposes. Thus, a significant difference in the magnetic transition widths between AgF2 and AgCoF5 is evident (see inset in Fig. 7). The significantly wider transition in AgCoF5 in contrast to AgF2, could be due to the existence of additional magnetic transitions in AgCoF5 and/or to differences in the dimensionality of the magnetic ordering for both compounds. Silver(II) difluoride is identified as a two-dimensional (2D) antiferromagnet, exhibiting an exchange constant close to −70 meV in the [AgF4] layers;27,33 this leads to a sharp transition at 163 K, evidenced by a distinct peak in the −dχ/dT versus T plot (see inset in Fig. 7). In the following, we focus on the M(H) dependence of the sample (S1).
Fig. 8 shows the M(H) curve for sample S1. We observe hysteresis loops at temperatures of 1.8 K, 50 K, and 130 K. The coercivity (Hc) varies with temperature and reaches 1060 Oe at 1.8 K, 4132 Oe at 50 K, 2116 Oe at 100 K, 1402 Oe at 130 K and drops to 11 Oe at 180 K. Therefore, in the observed magnetic transition at 128 K (see Fig. 7 and Fig. SI5 in ESI‡), as evidenced by the broad feature in magnetic susceptibility, a nonzero coercivity is discernible above 128 K, particularly at 130 K, and the phenomenon disappears only at temperatures close to 180 K. Furthermore, the remanence magnetization is strongly temperature-dependent, with values of 12 emu mol−1 at 1.8 K, 24 emu mol−1 at 50 K, 22 emu mol−1 at 100 K, and approximately 10 emu mol−1 at 130 K. Beyond the last transition point observed in the M(T) dependence of the sample (163 K for AgF2 traces), the M(H) curve becomes linear without coercivity (measurements at 180 K and 250 K, see also ESI‡). These results agree with the magnetic susceptibility measurements and indicate a weak ferromagnetic character of the sample at low temperatures. However, since magnetic saturation was not reached even at lowest applied temperature under the maximum applied magnetic field of 70 kOe, this indicates that spin canting may be at the origin of weak ferromagnetism (as in AgF2) or ferrimagnetism.
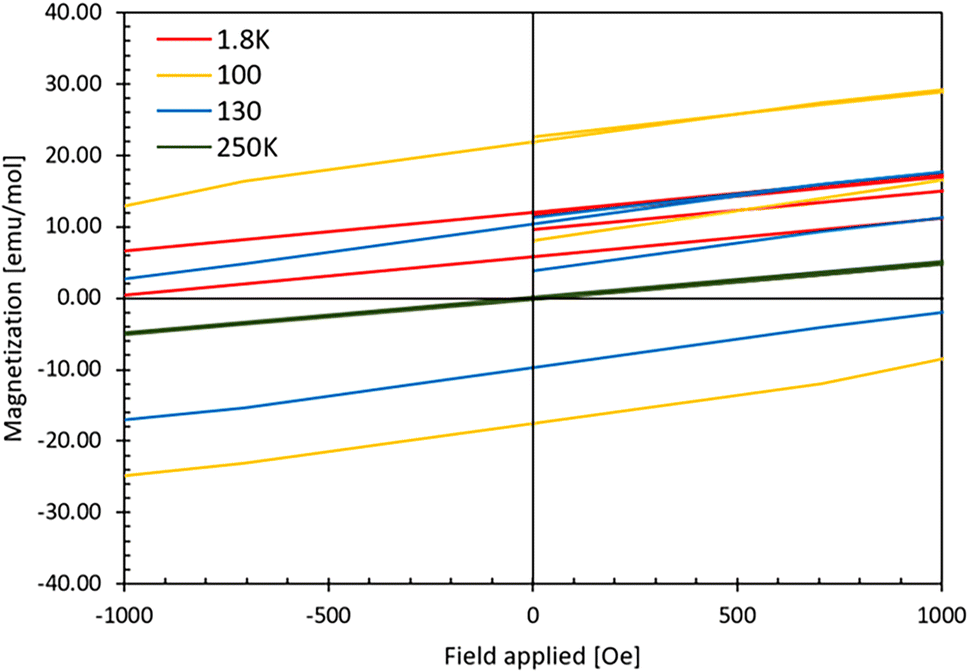 | ||
| Fig. 8 Magnetization curves at 1.8 K, 100 K, 130 K and 250 K for S1 as a function of the applied field for fields up to 1000 Oe. The curves for the extended temperature range and the applied magnetic fields are listed in the ESI.‡ | ||
The magnetic behavior of AgCoF5 may be related to that of structurally analogous compounds. Several mixed-valent paramagnetic transition metal pentafluorides with the C2/c structure have been documented1,2,9 (see Section I. in ESI‡). Homometallic compounds such as Mn2F5 and Cr2F5 have been shown to be antiferromagnets by magnetic susceptibility measurements below 53 K2 and 30 K,1 respectively. For the heteroatomic compound MnCrF5 an antiferromagnetic order below 6 K was observed.17 However, for CrTiF5 and CrVF5, the ferrimagnetism was observed below 26 K1 and 40 K,1 respectively. This is attributed to the 3d1 and 3d2 configurations for TiIII and VIII ions and to the simultaneous 3d4 configuration of CrII. Therefore, the different electronic configurations of 3d6 HS-CoIII and 4d9 AgII, suggest the possibility of ferrimagnetism of AgCoF5 (Table 2).
| Compound | T t [K] | Magnetic nature/GSa |
|---|---|---|
| n.d. – not defined.a AF – antiferromagnetic, Fi – ferrimagnetic.b This work.c Depending on the field applied (ESI‡). | ||
| Mn2F52 |
53.4 | AF |
| Cr2F51 |
40 | AF |
| CrTiF51 |
26 | Fi |
| CrVF51 |
40 | Fi |
| MnCrF517 |
6 | AF |
| CdMnF59 |
n.d. | n.d. |
| AgCoF5b |
T
N = 128, T2 = 3–9c |
Complex behavior (most likely Fi) |
The complex magnetic behavior of the AgCoF5 compound necessitates a more comprehensive characterization. Techniques such as muon spin resonance spectroscopy or neutron diffraction, supported by quantum mechanical calculations in a non-collinear model and with explicit inclusion of spin–orbit coupling, should be employed. While these measurements and calculations remain to be performed in the future, we have conducted a preliminary analysis of the magnetic superexchange (SE) constants.
The exchange coupling constants were calculated using the Heisenberg Hamiltonian formalism based on the energy calculations of the respective spin configurations (see Fig. SI8 in ESI‡) within the broken symmetry method. We have determined the five closest metal contacts – both between silver and cobalt (Jb1, Ja2, Jc4), as well as the homoatomic ones (Jc3, J5). A detailed description of the SE paths is shown presented in Fig. SI8 in ESI.‡ The determined values of the superexchange (SE) constants obtained from DFT+U calculations (for UAg = 5 and 8 eV), SCAN and HSE06 methods are listed in the table below. A negative value indicates antiferromagnetic ordering between the spins, while a positive values indicate ferromagnetic ordering. In the context of magnetic interaction strength, we mainly refer to the absolute values of the particular constant describing the interactions, denoted as |J|.
Analyzing the differences in the calculated values for relevant superexchange constants between diverse methods, the largest discrepancies are observed for Jb1(Co–Ag). This situation is likely not only a result of differences in the exchange–correlation functionals employed, but also stems from the variations in the geometry of the systems obtained during optimization by each method – specifically, the distances between the paramagnetic centers and the angle of the bond formed through fluorine. All these parameters together with the SE constants, are listed in Table 3 for all the methods used. Recently, however, we have shown that among various exchange–correlation (XC) functionals, the SCAN method provides the best agreement between experimental and theoretical J2D value for AgF2, with an error margin of only 4%.33 Therefore, we assume here −62 meV as a reliable value for Jb1(Co–Ag) and restrict ourselves to the SCAN results in the following analysis.
| Direction | Parameter | DFT+U (UAg = 5 eV) | DFT+U (UAg = 8 eV) | SCAN | HSE06 |
|---|---|---|---|---|---|
| [010] | J b1(Co–Ag) [meV] | −47.7 | −39.3 | −62.0 | −39.5 |
| d [Å] | 3.822 | 3.803 | 3.874 | 3.831 | |
| Angle [°] | 158.9 | 158.6 | 164.1 | 159.6 | |
| [100] | J a2(Co–Ag) [meV] | −6.5 | −6.5 | −4.8 | −6.7 |
| d [Å] | 3.593 | 3.579 | 3.635 | 3.600 | |
| Angle [°] | 127.9 | 127.7 | 130.1 | 129.1 | |
| [001] | J c3(Co–Co) [meV] | −8.3 | −8.2 | −10.3 | −8.0 |
| d [Å] | 3.768 | 3.754 | 3.793 | 3.763 | |
| Angle [°] | 158.9 | 158.9 | 162.4 | 160.2 | |
| [001] | J c4(Ag–Ag) [meV] | −1.1 | −0.4 | −1.3 | +0.7 |
| d [Å] | 3.768 | 3.754 | 3.793 | 3.763 | |
| Angle [°] | 107.9 | 108.4 | 109.1 | 106.9 | |
| [101] | J 5(Ag–Co) [meV] | −1.2 | −1.4 | −1.9 | −0.5 |
| d [Å] | 3.961 | 3.943 | 3.915 | 3.967 | |
| Angle [°] | 121.3 | 121.1 | 120.7 | 121.3 | |
According to all the theoretical methods used, the ground state of AgCoF5 is antiferromagnetic with a quasi-G-type magnetic structure (as illustrated in the Fig. 9), which means that the antiferromagnetic exchange occurs between all six corner-sharing metal centers. In addition, Cr2F5, which has the same crystal structure as the compound discussed in this work, has a magnetic structure identical to that determined here for AgCoF5, as previously suggested.46 However, the specific values of the superexchange constants (SE) for Cr2F5 have not yet been determined.
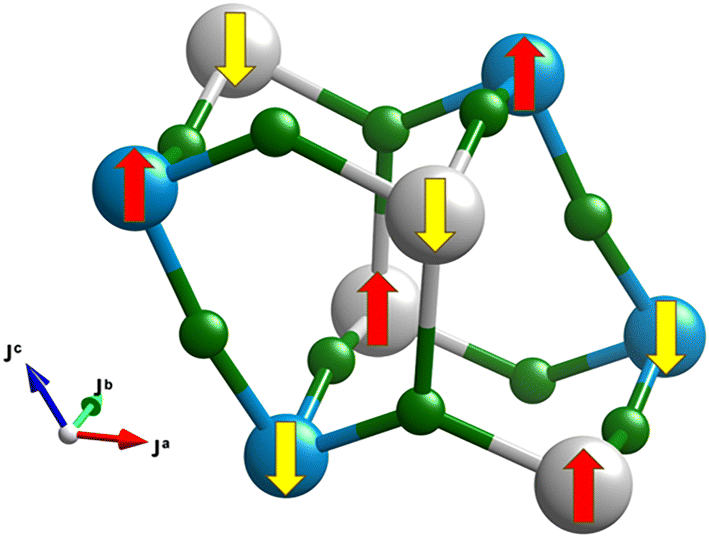 | ||
| Fig. 9 The G-type antiferromagnetic structure, calculated as the magnetic ground state for AgCoF5. A comprehensive description of the superexchange paths and all spin configurations considered can be found in the Fig. SI8 in the ESI.‡ | ||
In the rectangular lattice along the ab plane, we identified two SE constants: Jb1 and Ja2, both for heteroatomic (Ag–Co) magnetic interactions. The most important SE constant, labelled as Jb1(Co–Ag), is related to the Co–Ag interaction along the b-axis [010] via an F bridge. Its value from the SCAN method is −62.02 meV (Table 3). Since the Co–F–Ag bond angle along [010] is 164.1° (SCAN), the observation of a relatively strong antiferromagnetic exchange along this SE path is rather expected in line with the GKA (Goodenough–Kanamori–Anderson) rules.47–49 This interaction encompasses the eg electrons of Co S = 4/2 (high-spin) and Ag S = 1/2 cations, since the magnetic moments for these paramagnetic sites have been computed as 3.22μB and 0.58μB (DFT+U), respectively (as for typical HS-Co3+28 and d9 Ag2+,33,50 see Table SI8 in ESI‡). The subsequent SE constant in the rectangular lattice within the (001) plane, which describes the strength of the Co–Ag interaction along the [100] direction (Ja2(Co–Ag)), appears to be considerably weaker than the dominant interaction. The SCAN method gives the value of −4.8 meV. The Co–F–Ag angle along the a-axis is 130.1° (SCAN) and thus deviates significantly from 180°, which considerably weakens the antiferromagnetic interaction.
For Co–F–Co chains along [001], the superexchange is stronger than for Co–F–Ag (−10.3 meV). The other two exchange constants, Jc4(Ag–Ag) and J5(Ag–Co), are significantly weaker and show negative values. Our results are similar to those for isostructural Cr2F5, where Monte Carlo simulations suggested that the three strongest superexchange (SE) constants should be negative, indicating of antiferromagnetic ordering between the spins, while the other two constants are significantly weaker.46
The study of the SE constants in AgCoF5 clearly shows a pronounced anisotropy of these interactions. It was demonstrated that the interaction characterized by Jb1(Ag–Co) is considerably more robust than the other two, which are described as Ja2(Co–Ag) and Jc3(Co–Co). To assess the extent of this anisotropy, one can calculate the ratio J′/J′′, where J′′ represents the constant with the highest absolute value – in this case Jb1(Ag–Co), and J′ as that of Ja2(Co–Ag) or Jc3(Co–Co). The most significant anisotropy is evident in the SCAN results. Considering the constant J′ as the constant describing the interaction between S = 4/2 (CoIII) and S = 1/2 (AgII), the ratio is 7.69 × 10⁻² (J′ = Ja2(Co–Ag)). For the SE constant, which describes the interaction between two cobalt ions (both S = 4/2), the ratio is 1.66 × 10⁻¹ (J′ = Jc3(Co–Co)). The results for all methods are shown in the Table 4.
| Method | J′/J′′ ratio | |
|---|---|---|
| J′ = Ja2(Co–Ag) | J′ = Jc3(Co–Co) | |
| DFT+U (UAg = 5 eV) | 1.37 × 10⁻¹ | 1.73 × 10⁻¹ |
| DFT+U (UAg = 8 eV) | 1.66 × 10⁻¹ | 2.09 × 10⁻¹ |
| SCAN | 7.69 × 10⁻² | 1.66 × 10⁻¹ |
| HSE06 | 1.71 × 10⁻¹ | 2.02 × 10⁻¹ |
The J′/J′′ ratios calculated in our study are significantly higher than those typically found in nearly ideal 1D antiferromagnets. For instance, in FeF3(4,4′-bpy), where superexchange (SE) occurs along the Fe–F–Fe (S = 5/2) chains, the J′/J′′ ratio is less than 3.2 × 10−5.51 This tendency can also be observed for ternary compounds with AgII and F, such as KAgF3 (2.1 × 10⁻²).43 Additionally, a similar ratio was also found for the quasi-1D magnet Bi2Fe(SeO3)2OCl3, where J′/J′′ is equal to 8.0 × 10−2.52 It is important to note that in all these compounds the chains are either completely or quasi-isolated, in contrast to AgCoF5, which has a 3D network of metal–ligand–metal bonds.
All this together suggests that AgCoF5 does not exhibit characteristics of a canonical one-dimensional (1D) antiferromagnet, but rather should be classified as a quasi-three-dimensional (3D) antiferromagnet with significant magnetic anisotropy within the rectangular mixed spin lattice (along ab) (J′ and J′′ < J1D by around 10−1). In view of this, one can tentatively assign the observed transition at 128 K to the onset of antiparallel alignment of the Co and Ag spins along the crystallographic b-axis.
Analysis of spin density for the ground state magnetic solution (Fig. 10) shows that there is substantial spin polarization on F atoms, which constitute key intermediaries of the superexchange.
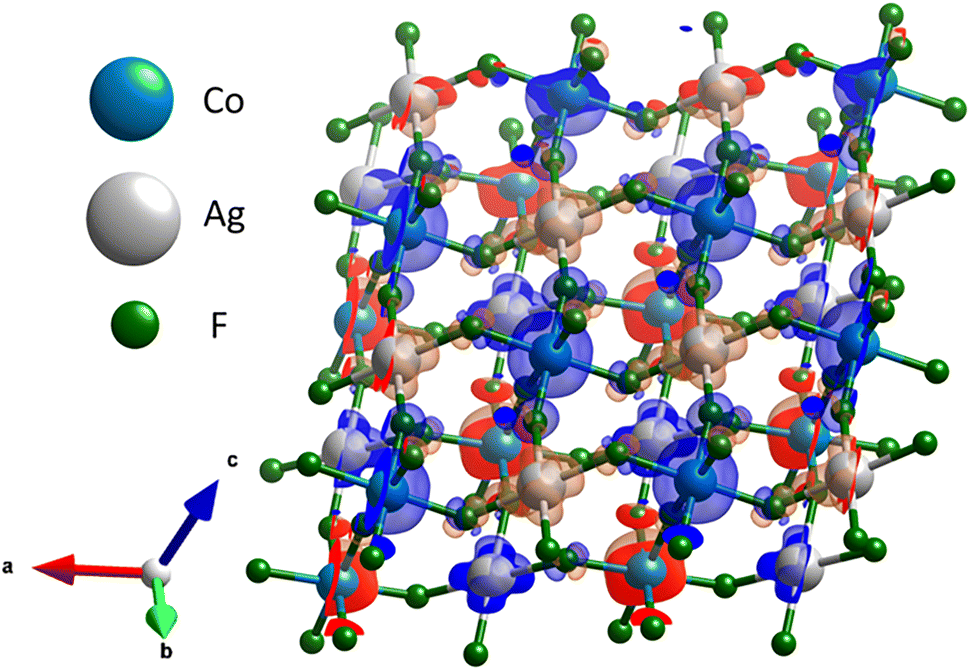 | ||
| Fig. 10 Figure presents part of AgCoF5 2 × 2 × 1 supercell. The spin density localized at the fluorine atoms, illustrates their pivotal role as intermediaries (bridge) in the superexchange interaction mechanism. The spin density was calculated using density functional theory augmented with Hubbard U (UAg = 5 eV), and is shown with an isosurface threshold set at 0.008 electrons per Å3, where blue and red refer to alpha and beta spin density excess. | ||
Electronic properties of AgCoF5
The inspection of the electronic density of states indicates the presence of an energy gap between occupied and unoccupied states, ranging from 1.382 eV (DFT+U) to 2.476 eV (HSE06). The nature of this gap can be described as charge-transfer (CT) according to the ZSA (Zaanen–Sawatzky–Allen) classification.53 The main contribution to the valence band just below the Fermi level (zero on the x-axis of Fig. 11) originates from the p states of fluorine, while, the conduction band consists mainly of the unoccupied states of the metals – silver and/or cobalt. In DFT+U (UAg = 5 eV) and HSE06 calculations, the electronic states proximal to the Fermi level (0 at the energy axis in Fig. 11) within the conduction band predominantly consist of Ag d(x2−y2) states. In addition, these states also provide a substantial contribution to the valence states near the Fermi level. A comparable observation is noted for Co d(x2−y2) and Co dxy states, where both valence and conduction bands, close to the Fermi level, have the greatest contribution from those particular states, across all Co d orbitals. It is important to note that the unoccupied states of silver and cobalt are different, each forming relatively narrow bands (HSE06 and DFT+U, where UAg = 5 eV). In the unoccupied band, alongside the metal states, Fp states are also present, indication a notable hybridization between the ligand (Fp) and metal (Agd and/or Cod) states. This also suggests the existence of substantial amount of ‘holes’ in the fluorine orbitals. Similarly, the coexistence of ligand and metal states in the same energy range from −8 to 0 eV below the Fermi level, implies significant orbital hybridization. This covalence of the chemical bonds fits well with the relatively high values of the superexchange (SE) constants, particularly for Jb1(Co–Ag), where the Fp orbitals mediate the magnetic interaction.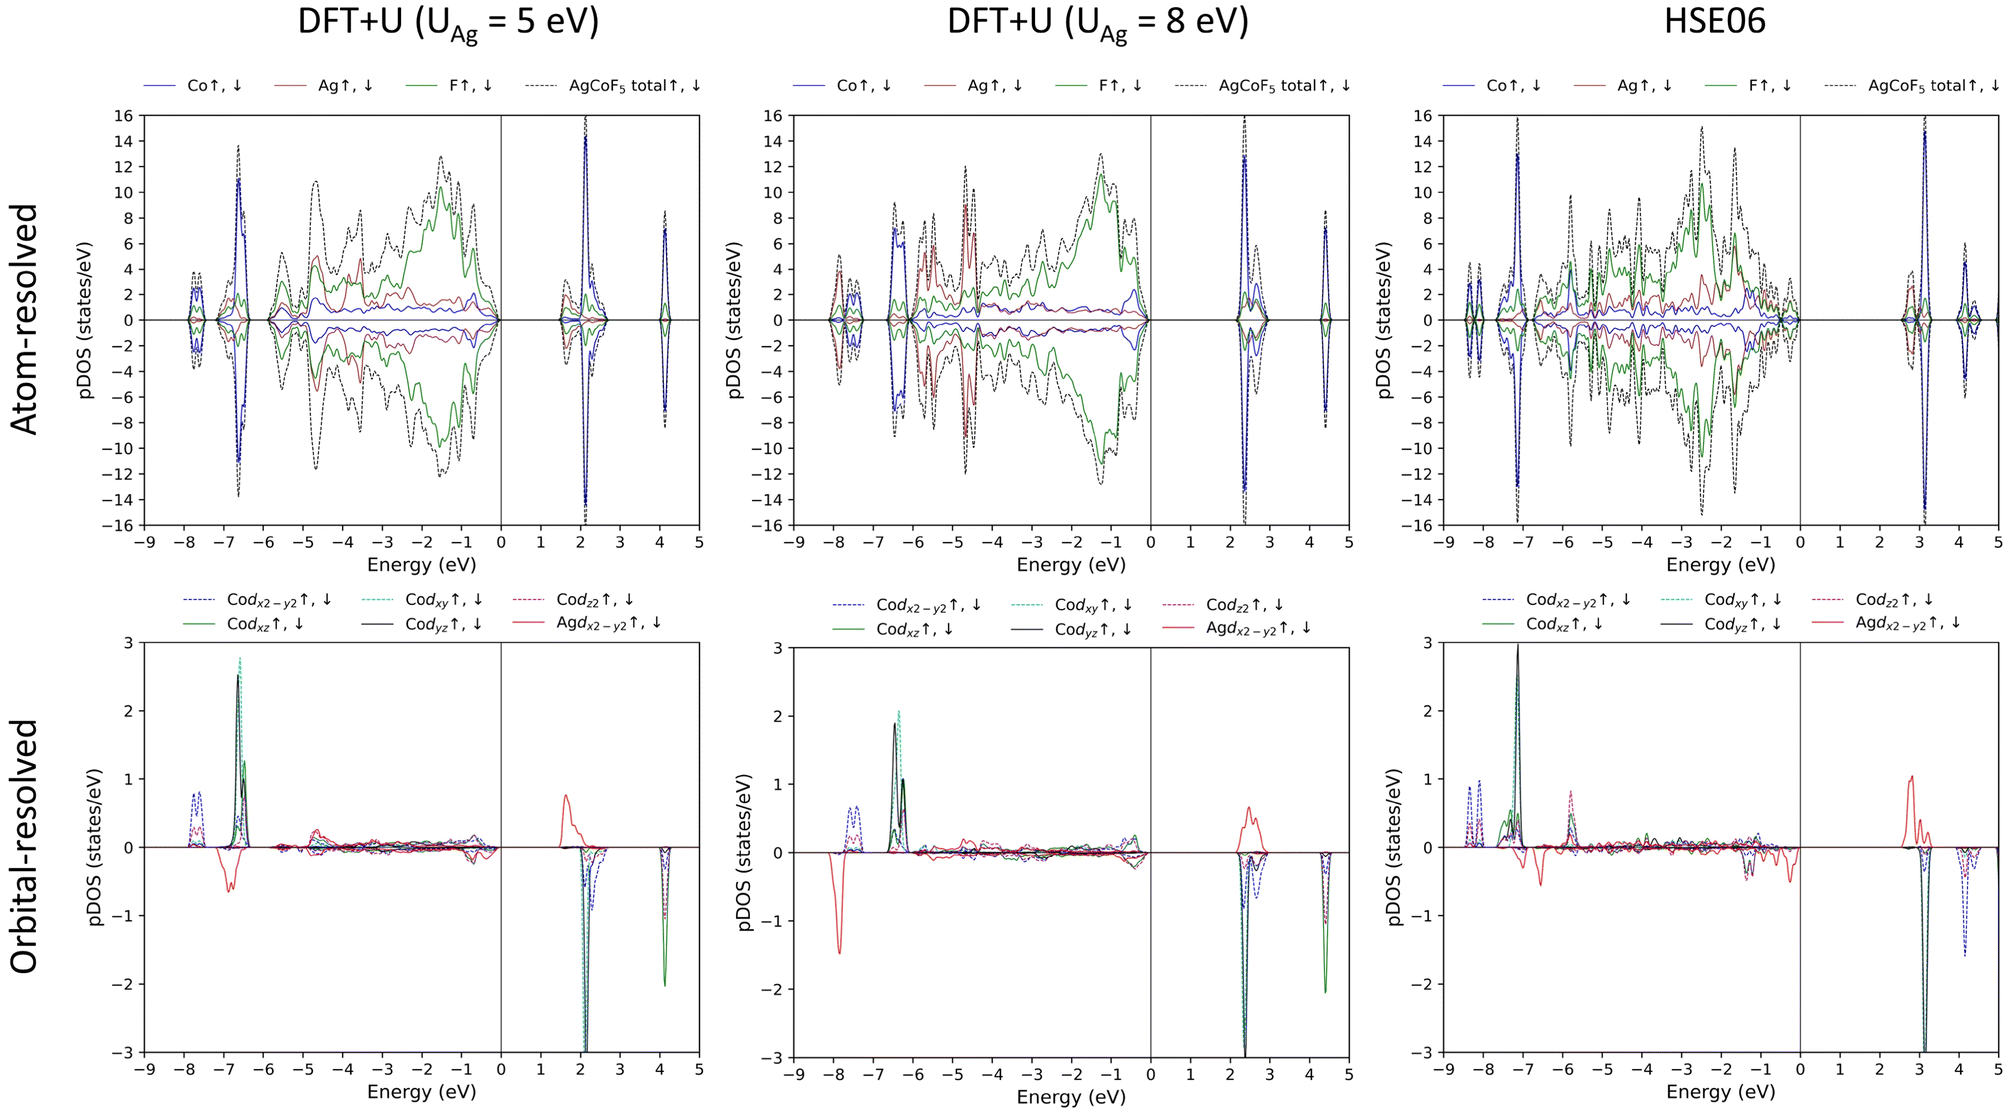 | ||
| Fig. 11 Density of states for AgCoF5 calculated with the DFT+U method (UCo is equal to 5 eV). For orbital resolved DOS only the d states of Co are shown, for Ag – only d(x2−y2). | ||
Theoretical insight into the stability of the different members of the AgMF5 family
Encouraged by the preparation of AgCoF5, we decided to theoretically investigate the stability of this and several other members of the AgMF5 family with trivalent M cations. It turned out that the formation of AgCoF5 from AgF2 and CoF3 is slightly exothermic, about −3 kJ mol−1 (Table 5). Therefore, we have screened the following reactions:| AgIIF2 + MIIIF3 → AgIIMIIIF5 | (2) |
| dG = GAgMF5 − GAgF2 − GMF3 | (3) |
| dV = VAgMF5 − VAgF2 − VMF3. | (4) |
| MIII | dG [eV mol−1] | dE [kJ mol−1] | dV [Å3] | Mag. mom. [μB] | |
|---|---|---|---|---|---|
| Ag | MIII | ||||
| a Structure of CuF3 not known experimentally but provisionally assumed to be isostructural with that of FeF3, as suggested by recent calculations.4 | |||||
| Ag | −0.09 | −8.21 | 6.24 | ±0.82 | ±0.49 |
| Cua | −0.06 | −5.97 | 5.97 | ±0.54 | ±1.06 |
| Co | −0.03 | −3.25 | 5.25 | ±0.58 | ±3.22 |
| Fe | 0.06 | 5.83 | 4.71 | ±0.59 | ±4.32 |
| Ni | 0.06 | 6.07 | 4.36 | ±0.65 | ±1.01 |
| Ga | 0.12 | 11.89 | 4.96 | +0.51 | ±0.01 |
| Al | 0.21 | 20.28 | 2.92 | ±0.65 | ±0.03 |
| Sc | 0.26 | 24.63 | 2.00 | ±0.51 | ±0.03 |
| Au | 0.26 | 25.40 | 3.08 | ±0.56 | ±1.01 |
We found that only in three cases, the enthalpy (eqn (3)) of bimetallic pentafluoride formation was negative: for the already mentioned AgCoF5 and for two hypothetical phases – AgCuF5 and AgIIAgIIIF5. In the case of AgCuF5, for calculations of eqn (3) and (4) we adapted theoretically predicted CuF3 structure.4 Moreover, the latest experimental approach in the HT solid state reaction of CuF2/AgF2 mixtures with F2 overpressure revealed in the formation of AgII/CuII–F solid solutions without oxidation to CuIII fluoride.24 For these reasons, the significance of this result is somewhat diminished.
However, the case of AgIIAgIIIF5 is exceptionally interesting for three reasons: (i) it contains two powerful oxidizers, AgII and AgIII, simultaneously in its structure; (ii) it has two paramagnetic centers – Ag2+(d9) and HS-Ag3+(d8) and (iii) a compound with this stoichiometry has already been prepared. However, the structure produced is not monoclinic but triclinic and it contains LS-AgIII.3
This raises the question of the relative energetic stability of these two polytypes – the hypothetical monoclinic C2/c and the synthesized triclinic P. Our preliminary DFT+U calculations indicate that the C2/c structure is slightly more energetically favorable by 21 meV per f.u. (including Zero-Point Energy, ZPE) compared to the (P) structure type. Moreover, the most significant superexchange (SE) constants between S = 1/2 (d9) and S = 1 (d8) silver sites (J2D) in the ab plane, calculated for the monoclinic AgIIAgIIIF5 structure are at −100 meV and for two AgIII sites around −93 meV (DFT+U, UAg = 5 eV). A further description of this new hypothetical polymorphic form of a known compound is beyond the scope of this paper and will be explored elsewhere. It suffices to say that the theory suggests the existence of an AgIIAgIIIF5 phase with HS-AgIII that is analogous to the prepared AgIICoIIIF5.
Finally, we experimentally verified the reactions between NiF2, GaF3, and FeF3 separately with AgF2. Under conditions corresponding to those of the successful synthesis of AgCoF5, no formation of new phases was observed – the powder contained only the unreacted substrates after annealing at high temperature. Therefore, the theory seems to accurately describe the lack of energetic preference for the formation of AgNiF5 (starting from NiF3), AgGaF5 and AgFeF5.
Conclusions and prospects
We have prepared a new member of the family of bimetallic pentafluorides, albeit the first to contain AgII and other paramagnetic transition metal cation. The AgCoF5 crystallizes in the monoclinic unit cell. Apart from the good Rietveld fit parameters, we have confirmed the structure by phonon calculations, with very good agreement between the computed and observed bands in the IR and Raman spectra. The title compound shows a complex magnetic structure that can tentatively characterized as ferrimagnetic. This magnetic behavior results from the d9 silver and the high-spin cobalt – d6, both of which have open d shells. The quasi-layered structural configuration of the compound facilitates antiferromagnetic interactions between disparate spin states, in particular S = 4/2 (CoIII, d6 high spin), and S = 1/2 (AgII, d9). These interactions are favored by a superexchange mechanism mediated by a fluorine bridge, with the appreciable interaction strength estimated at −62 meV (SCAN), along crystallographic b axis. The next two superexchange interactions are much weaker, with magnetic anisotropy on the order of 10−1.For an accurate description of the magnetic properties of the compound, the application of more sophisticated methods, such as muon and neutron techniques, would be essential. In addition, obtaining the compound in the form of single crystals would significantly improve the possibilities of determining the magnetic structure of the titled compound, especially for measurements related to specific crystallographic axes. Experiments to grow single crystals will be carried out in the future.
Furthermore, based on theoretical calculations, we have indicated the possibility of the existence of a mixed-valence compound AgIIAgIIIF5 with HS-AgIII (C2/c). Here, the calculated predominant SE constant J2D value is −100 meV (DFT+U). It is worthwhile to investigate this fascinating system by experiments.
Methods
Synthetic details
The synthesis method applied was the same as in previous studies on AgF2/CuF2 systems.24 Further details can be found in Section 1.1 of the paper.Magnetic measurements
The powder samples, weighing about 35 mg, were encapsulated in Teflon tubes under a dry argon atmosphere before being transferred to the measurement chamber. Magnetic characterizations were conducted using a Quantum Design MPMS SQUID VSM magnetometer. Magnetic susceptibility as a function of temperature was recorded in the range of 2 to 300 K under different applied magnetic fields under both field-cooled (FC) and zero-field-cooled (ZFC) conditions with a temperature increment of 1 K. On the same sample M(H) dependence were recorded. The data acquired were adjusted for the baseline contribution of an empty sample holder.XRD measurements
The powder samples were enclosed in perfluorinated quartz capillaries with a diameter of 0.5 mm under a dry argon atmosphere. The experiments were performed using a PANalytical X'Pert Pro diffractometer equipped with a linear PIXcel Medipix2 detector, with a parallel beam of Co Kα1 and Co Kα2 radiation with an intensity ratio of 2:1, at ambient temperature. The pseudo-Voigt function was utilized for peak shape analysis, while the Berar–Baldinozzi function was used to analyze the peak asymmetry. The background signals were modeled with 20–36 Legendre polynomials. All analyses included absorption correction (UISO) as implemented in the software Jana2006.54
IR and Raman measurements
For the Raman measurements powder samples were enclosed in perfluorinated quartz capillaries with a diameter of 0.5 mm under a dry argon atmosphere. The measurements were carried out on T64000 spectrometer from Horiba–Jobin Yvon equipped with a liquid nitrogen cooled Si detector with the Mitutoyo long-working distance lenses. The excitation line with a wavelength of 532 nm was used. We collected signals from different locations to identify possible decomposition features and exclude them from the analysis. To avoid photodecomposition of the sample, we typically conducted 420 accumulations, with each lasting 40 seconds, using a beam power of between 0.3 and 3 mW.The IR spectra were recorded with a Vertex 80v spectrometer from Bruker. A small amount of the powder was placed under dry argon between the HDPE windows and tightly closed in the measurement cell.
Computational details
The computations were conducted utilizing the Density Functional Theory (DFT) framework as implemented in the VASP 5.4.4 software.55 A Generalized Gradient Approximation (GGA) type PBEsol functional56 was employed, coupled with the projected augmented wave method.57,58 To account for the on-site coulombic interactions of the d electrons, Hubbard (Ud) and Hund (JH) parameters were introduced, following the DFT+U formalism as suggested by Liechtenstein.59 In the DFT+U and the JH parameter was set to 1 eV,60 while the Ud values for Ag were set to 8 or 5 eV and for Co as 5 eV, respectively.29,61 Other methods used the SCAN62 and HSE0663 approaches. A plane-wave cutoff energy of 520 eV was utilized for all systems. The k-spacing parameters were established at 0.032 Å−1 (0.048 Å−1) for geometry optimization and 0.022 Å−1 (0.032 Å−1) for achieving self-consistent-field convergence in the DFT+U and SCAN methods (in arrays values for HSE06). Convergence criteria of 10−9 eV for electronic steps and 10−7 for ionic steps were applied.
Graphical presentation
All figures of the structures were visualized with the VESTA software.64Conflicts of interest
There are no conflicts to declare.Acknowledgements
W. G. is grateful to the Polish National Science Center (NCN) for project Maestro (2017/26/A/ST5/00570). Research was carried out with the use of CePT infrastructure financed by the European Union – the European Regional Development Fund within the Operational Programme “Innovative economy” for 2007–2013 (POIG.02.02.00-14-024/08-00). ZM acknowledges the financial support of the Slovenian Research and Innovation Agency (research core funding no. P1-0045; Inorganic Chemistry and Technology). Quantum mechanical calculations were performed using supercomputing resources of the ICM UW (project SAPPHIRE [GA83-34]). The authors are grateful to Prof. Jose Lorenzana (CNR, Rome) for valuable remarks to this work.References
- A. Tressaud, J. M. Dance, J. Ravez, J. Portier, P. Hagenmuller and J. B. Goodenough, Mater. Res. Bull., 1973, 8, 1467–1477 CrossRef CAS.
- J. Bandemehr, F. Zimmerhofer, S. I. Ivlev, C. Pietzonka, K. Eklund, A. J. Karttunen, H. Huppertz and F. Kraus, Inorg. Chem., 2021, 60, 12651–12663 CrossRef CAS PubMed.
- R. Fischer and B. G. Müller, Z. Anorg. Allg. Chem., 2002, 628, 2592–2596 CrossRef CAS.
- N. Rybin, D. Y. Novoselov, D. M. Korotin and A. R. Oganov, Phys. Chem. Chem. Phys., 2021, 23, 15989–15993 RSC.
- M. Tramšek and B. Žemva, Acta Chim. Slov., 2002, 49, 209–220 Search PubMed.
- J. V. Rau, V. R. Albertini, N. S. Chilingarov, S. Colonna and M. D. Michiel, Chem. Lett., 2002, 31, 664–665 CrossRef.
- J. V. Rau, V. Rossi Albertini, N. S. Chilingarov, M. Di Michiel, S. Colonna, I. N. Ioffe and L. N. Sidorov, Bull. Chem. Soc. Jpn., 2003, 76, 1165–1169 CrossRef CAS.
- H. J. Seifert, H. W. Loh and K. Jungnickel, Z. Anorg. Allg. Chem., 1968, 360, 62–69 CrossRef CAS.
- U. Müller and R. Hoppe, Z. Anorg. Allg. Chem., 1990, 583, 205–208 CrossRef.
- J. Graulich, W. Massa and D. Babel, Z. Anorg. Allg. Chem., 2003, 629, 365–367 CrossRef CAS.
- S. M. Eicher and J. E. Greedan, J. Solid State Chem., 1984, 52, 12–21 CrossRef CAS.
- R. Von Der Mühll, S. Andersson and J. Galy, Acta Crystallogr., Sect. B: Struct. Crystallogr. Cryst. Chem., 1971, 27, 2345–2353 CrossRef.
- R. Georges, J. Ravez, R. Olazcuaga and P. Hagenmuller, J. Solid State Chem., 1974, 9, 1–5 CrossRef.
- R. von der Mühll, F. Daut and J. Ravez, J. Solid State Chem., 1973, 8, 206–212 CrossRef.
- A. Tressaud, J. M. Parenteau, J. M. Dance, J. Portier and P. Hagenmuller, Mat. Res. Bull., 1973, 8, 565–570 CrossRef CAS.
- M. Body, G. Silly, C. Legein, J.-Y. Buzaré, F. Calvayrac and P. Blaha, J. Solid State Chem., 2005, 178, 3655–3661 CrossRef CAS.
- G. Ferey and R. Pape, Acta Crystallogr., Sect. B: Struct. Crystallogr. Cryst. Chem., 1978, 1084–1091 CrossRef CAS.
- W. J. Casteel, G. Lucier, R. Hagiwara, H. Borrmann and N. Bartlett, J. Solid State Chem., 1992, 96, 84–96 CrossRef CAS.
- R. Hoppe and G. Siebert, Z. Anorg. Allg. Chem., 1970, 376, 261–267 CrossRef CAS.
- B. Müller and R. Hoppe, Z. Anorg. Allg. Chem., 1972, 392, 37–41 CrossRef.
- G. Lucier, J. Muenzenberg, W. J. Casteel and N. Bartlett, Inorg. Chem., 1995, 34, 2692–2698 CrossRef CAS.
- M. A. Domański and W. Grochala, Z. Naturforsch., B: J. Chem. Sci., 2021, 76, 751–758 CrossRef.
- M. Domański, J. van Leusen, M. Metzelaars, P. Kögerler and W. Grochala, J. Phys. Chem. A, 2022, 126, 9618–9626 CrossRef PubMed.
- D. Jezierski, K. Koteras, M. Domański, P. Połczyński, Z. Mazej, J. Lorenzana and W. Grochala, Chem. – Eur. J., 2023, 29, e202301092 CrossRef CAS PubMed.
- P. Fischer, G. Roult and D. Schwarzenbach, J. Phys. Chem. Solids, 1971, 32, 1641–1647 CrossRef CAS.
- E. O. Wollan, H. R. Child, W. C. Koehler and M. K. Wilkinson, Phys. Rev., 1958, 112, 1132–1136 CrossRef CAS.
- J. Gawraczyński, D. Kurzydłowski, R. A. Ewings, S. Bandaru, W. Gadomski, Z. Mazej, G. Ruani, I. Bergenti, T. Jaroń, A. Ozarowski, S. Hill, P. J. Leszczyński, K. Tokár, M. Derzsi, P. Barone, K. Wohlfeld, J. Lorenzana and W. Grochala, Proc. Natl. Acad. Sci. U. S. A., 2019, 116, 1495–1500 CrossRef PubMed.
- S. Mattsson and B. Paulus, J. Comput. Chem., 2019, 40, 1190–1197 CrossRef CAS PubMed.
- R. Piombo, D. Jezierski, H. P. Martins, T. Jaroń, M. N. Gastiasoro, P. Barone, K. Tokár, P. Piekarz, M. Derzsi, Z. Mazej, M. Abbate, W. Grochala and J. Lorenzana, Phys. Rev. B, 2022, 106, 035142 CrossRef CAS.
- N. Bachar, K. Koteras, J. Gawraczynski, W. Trzciński, J. Paszula, R. Piombo, P. Barone, Z. Mazej, G. Ghiringhelli, A. Nag, K.-J. Zhou, J. Lorenzana, D. Van Der Marel and W. Grochala, Phys. Rev. Res., 2022, 4, 023108 CrossRef CAS.
- S. Bandaru, M. Derzsi, A. Grzelak, J. Lorenzana and W. Grochala, Phys. Rev. Mater., 2021, 5, 064801 CrossRef CAS.
- A. Grzelak, H. Su, X. Yang, D. Kurzydłowski, J. Lorenzana and W. Grochala, Phys. Rev. Mater., 2020, 4, 084405 CrossRef CAS.
- D. Jezierski and W. Grochala, Phys. Rev. Mater., 2024, 8, 034407 CrossRef CAS.
- W. Grochala and R. Hoffmann, Angew. Chem., Int. Ed., 2001, 40, 2742–2781 CrossRef CAS PubMed.
- A. Grzelak, M. Derzsi and W. Grochala, Inorg. Chem., 2021, 60, 1561–1570 CrossRef CAS PubMed.
- D. Jezierski, A. Grzelak, X. Liu, S. K. Pandey, M. N. Gastiasoro, J. Lorenzana, J. Feng and W. Grochala, Phys. Chem. Chem. Phys., 2022, 24, 15705–15717 RSC.
- M. A. Domański, M. Derzsi and W. Grochala, RSC Adv., 2021, 11, 25801–25810 RSC.
- A. Grzelak, J. Lorenzana and W. Grochala, Angew. Chem., Int. Ed., 2021, 60, 13892–13895 CrossRef CAS PubMed.
- W. Levason and C. A. McAuliffe, Coord. Chem. Rev., 1974, 12, 151–184 CrossRef CAS.
- M. A. Neumann, J. Appl. Crystallogr., 2003, 36, 356–365 CrossRef CAS.
- D. T. Durig and J. R. Durig, in Low Temperature Molecular Spectroscopy, ed. R. Fausto, Springer Netherlands, Dordrecht, 1996, pp. 477–504 Search PubMed.
- J. Fábry and R. Krupková, Ferroelectrics, 2008, 375, 59–73 CrossRef.
- D. Kurzydłowski, Z. Mazej, Z. Jagličić, Y. Filinchuk and W. Grochala, Chem. Commun., 2013, 49, 6262 RSC.
- I. Dzyaloshinsky, J. Phys. Chem. Solids, 1958, 4, 241–255 CrossRef CAS.
- T. Moriya, Phys. Rev., 1960, 120, 91–98 CrossRef CAS.
- P. Lacorre, G. Ferey and J. Pannetier, J. Solid State Chem., 1992, 96, 227–236 CrossRef CAS.
- J. B. Goodenough, Phys. Rev., 1955, 100, 564–573 CrossRef CAS.
- J. Kanamori, J. Phys. Chem. Solids, 1959, 10, 87–98 CrossRef CAS.
- P. W. Anderson, Phys. Rev., 1950, 79, 350–356 CrossRef.
- C. Miller and A. S. Botana, Phys. Rev. B, 2020, 101, 195116 CrossRef CAS.
- H. Lu, T. Yamamoto, W. Yoshimune, N. Hayashi, Y. Kobayashi, Y. Ajiro and H. Kageyama, J. Am. Chem. Soc., 2015, 137, 9804–9807 CrossRef CAS PubMed.
- P. S. Berdonosov, E. S. Kuznetsova, V. A. Dolgikh, A. V. Sobolev, I. A. Presniakov, A. V. Olenev, B. Rahaman, T. Saha-Dasgupta, K. V. Zakharov, E. A. Zvereva, O. S. Volkova and A. N. Vasiliev, Inorg. Chem., 2014, 53, 5830–5838 CrossRef CAS PubMed.
- H. Eskes and G. A. Sawatzky, Phys. Rev. Lett., 1988, 61, 1415–1418 CrossRef CAS PubMed.
- V. Petříček, M. Dušek and L. Palatinus, Z. Kristallogr. – Cryst. Mater., 2014, 229, 345–352 CrossRef.
- G. Kresse and J. Furthmüller, Phys. Rev. B: Condens. Matter Mater. Phys., 1996, 54, 11169–11186 CrossRef CAS PubMed.
- J. P. Perdew, A. Ruzsinszky, G. I. Csonka, O. A. Vydrov, G. E. Scuseria, L. A. Constantin, X. Zhou and K. Burke, Phys. Rev. Lett., 2008, 100, 136406 CrossRef PubMed.
- P. E. Blöchl, Phys. Rev. B: Condens. Matter Mater. Phys., 1994, 50, 17953–17979 CrossRef PubMed.
- G. Kresse and D. Joubert, Phys. Rev. B: Condens. Matter Mater. Phys., 1999, 59, 1758–1775 CrossRef CAS.
- A. I. Liechtenstein, V. I. Anisimov and J. Zaanen, Phys. Rev. B: Condens. Matter Mater. Phys., 1995, 52, R5467–R5470 CrossRef CAS PubMed.
- V. I. Anisimov, J. Zaanen and O. K. Andersen, Phys. Rev. B: Condens. Matter Mater. Phys., 1991, 44, 943–954 CrossRef CAS PubMed.
- F. Zhou, M. Cococcioni, C. A. Marianetti, D. Morgan and G. Ceder, Phys. Rev. B: Condens. Matter Mater. Phys., 2004, 70, 235121 CrossRef.
- J. Sun, A. Ruzsinszky and J. P. Perdew, Phys. Rev. Lett., 2015, 115, 036402 CrossRef PubMed.
- A. V. Krukau, O. A. Vydrov, A. F. Izmaylov and G. E. Scuseria, J. Chem. Phys., 2006, 125, 224106 CrossRef PubMed.
- K. Momma and F. Izumi, J. Appl. Crystallogr., 2008, 41, 653–658 CrossRef CAS.
Footnotes |
| † Dedicated to Prof. Boris Žemva in memoriam. |
| ‡ Electronic supplementary information (ESI) available: Overview of the AIIBIIIF5 fluoride family, structural and magnetochemical data, and phonon spectra for title compound. CCDC 2332918 (AgCoF5). For ESI and crystallographic data in CIF or other electronic format see DOI: https://doi.org/10.1039/d4dt00419a |
| This journal is © The Royal Society of Chemistry 2024 |