 Open Access Article
Creative Commons Attribution 3.0 Unported Licence
Electrochemiluminescent screening for methamphetamine metabolites†
Emre
Dokuzparmak
,
Kelly
Brown
and
Lynn
Dennany
 *
*
WestChem Department of Pure and Applied Chemsitry, Univeristy of Strathclyde, Technology and Innovation Centre, 99 George Street, Glasgow, G1 1RD, UK. E-mail: lynn.dennany@strath.ac.uk
First published on 7th April 2021
Abstract
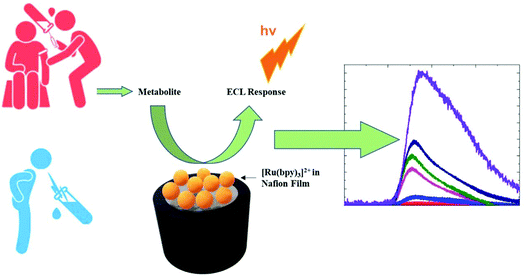
The abuse of methamphetamine (MA) is to date detected and subsequently verified through the monitoring of MA and its metabolites within biological specimens. Current approaches require complex sample purification strategies alongside significant analysis time. Given the high prevalence of MA within the global drug market, there remains a need for rapid, portable and alternative screening approaches appropriate for direct detection within biological matrices for employment across the forensic and clinical environments. This contribution illustrates the use of an electrochemiluminescence (ECL) strategy for the screening of MA, amphetamine (AMP) and para hydroxy-methamphetamine (pOH-MA) for such applications. The sensing system showed ideal analytical performance with linear ranges at forensically relevant concentrations of 0.1 μM to 0.5 mM for MA, 10 μM to 1 mM AMP and 10 μM to 5 mM for pOH-MA, and superb detection limits of 74.6 nM, 6 μM and 82. μM for MA, AMP and pOH-MA respectively. Furthermore, the sensor was successful in the detection of MA, AMP and pOH-AMP within human pooled serum, artificial urine and saliva, without any prior purification strategies. Here a portable ECL sensor is detailed for the successful employment of the direct screening of these amphetamine type substances and their corresponding metabolites at clinically and forensically relevant concentrations within a range of biological matrices. This approach successfully represents a strong proof-of-concept, for a novel, simple and rapid screening method with significant potential for high-throughput screening of biological samples for drug metabolites, widening the avenues where ECL sensors could be employed.
1. Introduction
Methamphetamine (MA) remains amongst the highest abused illicit drugs within the world, with an estimated 29 million users globally.1 MA belongs to a group of amphetamine type stimulants (ATS) which also includes amphetamine (AMP) and methylenedioxymethamphetamine (MDMA). ATS are now primarily considered party drugs, likely accounting for their wide spread use. Yet frequent abuse of ATS is linked to an increased display of impulsive, violent and even homicidal behaviour and as such are still considered to present a significant threat to public safety.2,3As evident by their continued prevalence amongst drug users there still remains the requirement for appropriate screening methodologies to identify the abuse of ATS and allow law enforcement or physicians to rapidly determine the substance which has led to the consumers erratic, violent or life-threatening behaviour. A key focus of any screening strategies for employment within such environments, must place emphasis upon the application of the methodology toward a number of complex matrices including biological fluids; a common requirement faced within forensic and clinical practices. Biological fluid analysis presents its own unique complications, where accurate determination of a drug of abuse is necessary, despite the high number of metabolites present, which are often considered to be target analytes themselves.2–5
Immunoassays, which use antibodies for the targeted detection of a specific drug or metabolite, have seen wide employment across a number of fields including forensic practices and clinical toxicological screening.5–7 They are often the primary method employed for the screening of substances of abuse, which can be attributed to their intrinsic advantages including, large scale screening facilitated through automation and rapid substance identification.4,5 What's more a number of commercial kits are available which currently offer home-testing or point-of-care analysis. However, immunoassays notably suffer from “false-positives” or “false-negatives” when drugs within the same class require identification, particularly within biological fluid anlaysis.4–9 Although these screening methods are the primary method employed for the detection of ATS, they fail to offer low cost systems.
Electrochemical sensors, including electrochemiluminescence (ECL) based sensors, have become a viable alternative for applications within the forensic and clinical arenas. The growth in technology has facilitated the development of portable sensors which can be performed through commercially available handheld systems or even smartphone devices.10–16 Electrochemical sensors are primed to address the limitations faced by current immunoassay screening methodologies, with a reduction in cost, increased reusability, reduced instrument costs and minimal reagent consumption. Furthered though the proven ability of ECL sensors to offer direct drug detection within range of complex matrices, including biological fluids, without the requirement of any separation or purification strategies.16–27
The detection of MA within biological fluids adopts a two-pronged approach, whereby identification of MA abuse is paired with detection of AMP as one of its primary metabolites.8,28–30 Following ingestion, MA is readily absorbed into the blood stream, with excretion primarily though the renal system following hepatic metabolism, resulting in the primary metabolites; AMP following the N-demethylation process and para-hydroxymethamphetamine (p-OHMA) following para-hydroxylation.30 With typically, between 37–54% of a MA dosage excreted via the renal system, urinary analysis is the primary biological fluid investigated for the identification of MA abuse.3 However, the basicity of ATS, with pKa values of 9.9![[thin space (1/6-em)]](https://www.rsc.org/images/entities/char_2009.gif) 29 for MA and AMP, lends themself well for detection within oral fluid, were they are observed to easily transfer from the blood stream to saliva of the consumer.29 Typical concentration values reported for MA and AMP within urine, oral fluid and plasma range from as low as 0.12 μM to 20 μM for MA and 48 nM to 2.6 μM for AMP recorded across time intervals of ∼5 to 16 hours.8,28,29 As such, any sensing system developed must operate within these μM concentration regions within a range of biological fluids.
29 for MA and AMP, lends themself well for detection within oral fluid, were they are observed to easily transfer from the blood stream to saliva of the consumer.29 Typical concentration values reported for MA and AMP within urine, oral fluid and plasma range from as low as 0.12 μM to 20 μM for MA and 48 nM to 2.6 μM for AMP recorded across time intervals of ∼5 to 16 hours.8,28,29 As such, any sensing system developed must operate within these μM concentration regions within a range of biological fluids.
To date there is limited literature available on the electrochemical detection of ATS substances, despite the amine moiety previously demonstrating good electroactivity facilitating the electrochemical detection of a number of fellow amine containing compounds.17–20,31–34 This limited investigation may be attributed to the high potential values required to initiate their oxidation, restricting the selectivity of voltammetric based detection, particularly within aqueous matrices. Previous studies have focus upon electrode modification to overcome the high oxidative potentials required. Of the ATS substances, MDMA, whose electroactivity is greater than its other ATS counterparts, is by far the most studied species to date.24,35 MA has seen significantly less investigation in comparison. 2016 marked the first use of a disposable electrode for the detection of MA, within undiluted saliva samples, through utilisation of N,N′-(1,4-phenylene)-dibenzenesulfoamide as a mediator.25 Although this work was promising for the detection of MA via portable electrochemical methodologies within biological matrices, the detection limits achieved lay outwith the clinically relevant range. Detection limits for MA have been improved via utilisation of ECL sensors, through employment of the traditional luminophore, [Ru(bpy)3]2+, facilitating mediated oxidation of the amine moiety within the species. Such employment achieved detection down to 4.0 fM.20,21 However, despite their promise these methodologies have displayed, to date, no electrochemical sensing system able to identify MA alongside its primary metabolites, AMP and p-OHMA, via a singular and direct detection strategy.
With ECL based sensors growing in popularity as viable alternatives for employment as point-of-care or at-scene devices, alongside their proven ability to detect MA and AMP, further investigation into their ability to simultaneously detect a drug of abuse alongside its metabolites within complex matrices will only stand to further their employment across a number of fields. Within this contribution we report the development of a basic [Ru(bpy)3]2+ ECL sensor for the rapid screening of MA alongside its primary metabolites AMP and p-OHMA, within a variety of biological fluids, including human serum, artificial saliva and sweat. What's more we demonstrate the potential of the developed methodology for at-scene or point-of-care analysis through the negation of any sample purification procedures prior to analysis, providing a sensing system capable of offering the rapid answers required by law enforcement and physicians without access to a dedicated laboratory facility.
2. Experimental
2.1 Materials and reagents
Tris (2,2′-bipyridyl) – dichlororuthenium(II) hexahydrate, ([Ru(bpy)3]2+), (+) methamphetamine hydrochloride, DL-amphetamine, phosphate buffered saline (PBS) tablets, human pooled serum, artificial urine and 117 Nafion (∼5% (w/v) mixture of lower aliphatic alcohols and water) were purchased from Sigma-Aldrich. 0.1 M PBS was used as the electrolyte. para-hydroxymethamphetamine was purchased from Carbosynth Limited. All reagents were of analytical grade and used as received. All samples were prepared in ultra-pure water (Milli-Q plus, Millipore Inc.). Artificial saliva (Bioténe® oral balance gel) was commercially purchased and used as received.2.2 Instrumentation
All electrochemical analysis was performed on a CH instrument (model 602E) using a standard three-electrode configuration. A glassy carbon electrode (GCE) was coated with [Ru(bpy)3]2+/Nafion film as the working electrode. A platinum wire electrode and Ag/AgCl (saturated KCl) were used as counter electrode and reference electrode, respectively. All potentials were measured and reported according to this reference electrode. The ECL experiments were carried using the CH instrument model 602E connected to a Hamamatsu H6780-20 PMT. The ECL cell was placed directly above the photomultiplier tube (PMT) which was enclosed in a light-tight box. A full description of the instrumentation employment can be found within our prior publications.17–20,372.3 Fabrication of [Ru(bpy)3]2+/Nafion ECL sensor
The ruthenium film was prepared by drop casting 5 μL of a 1![[thin space (1/6-em)]](https://www.rsc.org/images/entities/char_2009.gif) :
:![[thin space (1/6-em)]](https://www.rsc.org/images/entities/char_2009.gif) 1 1 mM [Ru(bpy)3]2+ in 0.2% Nafion 117/MeOH (1
1 1 mM [Ru(bpy)3]2+ in 0.2% Nafion 117/MeOH (1![[thin space (1/6-em)]](https://www.rsc.org/images/entities/char_2009.gif) :
:![[thin space (1/6-em)]](https://www.rsc.org/images/entities/char_2009.gif) 3 v/v) solution onto the surface of a GCE. This was then allowed to dry for 2 hours in the dark. The GCE were then stored in the fridge until required for analysis as outlined in Scheme 1.
3 v/v) solution onto the surface of a GCE. This was then allowed to dry for 2 hours in the dark. The GCE were then stored in the fridge until required for analysis as outlined in Scheme 1.
2.4 Preparation of biological samples
All samples were prepared via spiking of the selected matrix with the required volume of ATS to give the desired concentration. Artificial saliva and urine were commercially purchased. Due to viscosity of the artificial saliva, it was diluted 5 times to observe optimum results. Results from “raw” artificial saliva were also recorded. Human pooled serum samples were stored at −80 °C and fully defrosted at room temperature prior to spiking and measurement. Human serum has strong background signal due to some interferences such as amino acids and proteins. To decrease the background signal a dilution ratio of human serum was investigated and optimum results seen at a ratio of 1![[thin space (1/6-em)]](https://www.rsc.org/images/entities/char_2009.gif) :
:![[thin space (1/6-em)]](https://www.rsc.org/images/entities/char_2009.gif) 3 (human serum
3 (human serum![[thin space (1/6-em)]](https://www.rsc.org/images/entities/char_2009.gif) :
:![[thin space (1/6-em)]](https://www.rsc.org/images/entities/char_2009.gif) PBS). Results obtained from non-diluted samples of pooled human serum were also recorded.
PBS). Results obtained from non-diluted samples of pooled human serum were also recorded.
3. Results and discussion
3.1 Detection of ATS via ECL
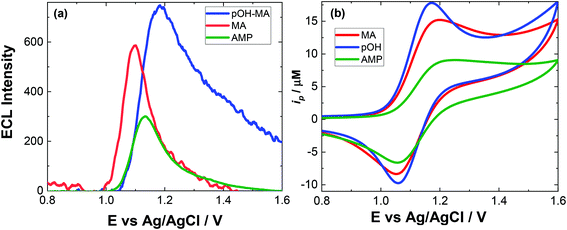
The approach utilised within this study was based upon the interaction of pOH-MA with a [Ru(bpy)3]2+ complex which had been surface confined with a Nafion film on a GC electrode as previously reported.17–20 The sensor was characterised and the same electrochemical behaviour as previously reported was observed. Amphetamine type substances (ATS) including methamphetamine and amphetamine, have been shown to produce an ECL signal upon interaction with a ruthenium(II) complex through the oxidative-reduction pathway.16,17Fig. 1(a) shows the ECL response for the interaction of the surface confined ruthenium with MA, AMP and pOH-MA. Similar to the reaction of electrogenerated [Ru(bpy)3]3+ with amino acids and other structurally similar amine compounds, the reaction between pOH-MA and the Ru3+ undergoes a similar reaction process being sufficiently energetic to produce an ECL response.31 Direct electrochemical oxidation of pOH-MA was not observed over the concentrations examined within this study, as shown in Fig. S1† and consistent with previous studies.20 In the presence of [Ru(bpy)3]2+, mediated oxidation of pOH-MA via the electrogenerated [Ru(bpy)3]3+ species facilitated the production of an ECL emission through the mediated oxidative-reduction co-reactant ECL pathway with a maximum ECL intensity observed at ∼1.15 V vs. Ag/AgCl as shown in Fig. 1(a). The ECL mechanism for pOH-MA is thought to follow a similar reaction process as that previously described for MA, amphetamine and other amino acids, as described in eqn (1)–(5).37 When a anodic potential is applied on the system, [Ru(bpy)3]2+ is oxidised at the electrode surface becoming [Ru(bpy)3]3+ (eqn (1)). This Ru(III) species then facilitates the oxidation of the pOH-MA via the mediated oxidation process, reported for a number of fellow amine spices, which do not undergo direct oxidation at the electrodes surface. This process generates the unstable radical cation, pOHMA˙+ (eqn (2)), which rapidly decomposes to form the highly reducing radical species pOH-MA˙ (eqn (3)). This free radical then undergoes a oxidation via the transfer an electron to [Ru(bpy)3]3+, forming the excited state ([Ru(bpy)3]2+*) (eqn (4)), where excess energy is given off in the form of light (eqn (5)).
| [Ru[(bpy)3]2+ − e− ↔ [Ru(bpy)3]3+ | (1) |
 | (2) |
| pOH-MA˙+ → pOH-MA˙ | (3) |
 | (4) |
| [Ru(bpy)3]2+\ast ↔ [Ru(bpy)3]2+ + hν | (5) |
Similarly, to other ATS, in the presence of pOH-MA, the onset of an ECL emission closely corresponds with the onset of oxidative current where the potential of Ru3+ is generated. Although no ECL emission is observed when pOH-MA is absent, a typical voltammetric response for the Ru2+/3+ redox couple is observed. ECL production for AMP, also a metabolite of MA, was examined and the ECL response is shown in Fig. 1. This follows the same reaction mechanism and is consistent with previous investigations into the ECL co-reactant generation from ruthenium complexes with other ATS and amino acids.31 Direct electrochemical oxidation of AMP or pOH-MA, was not observed over the concentrations examined within this study. In the presence of [Ru(bpy)3]2+, mediated oxidation of both metabolites alongside the electrogenerated [Ru(bpy)3]3+ species facilitates the production of an ECL emission through the oxidative-reduction co-reactant pathway described above. ECL mechanism with a maximum ECL intensity observed at ∼1.15 V vs. Ag/AgCl is observed for both metabolites. This is slightly shifted compared to that of MA, which shows an ECL maximum of ∼1.10 V vs. Ag/AgCl. However, for all the onset of the ECL response can be seen at ∼1.00 V vs. Ag/AgCl and therefore this difference in ECL maximum output cannot be utilised for discriminating between the different ATS compounds. The ECL signals obtained for these ATS clearly varies, with each producing varying ECL intensities as well as slight differences in the ECL maximum potentials. This has been observed previously and is related to the R group attached to the amino group, with ECL intensity being highest for R groups with poor electron withdrawing characteristics.31 This also influences the pH behaviour observed within this contribution.
Given the similarities of the ECL observed for these ATS, it would not be possible to distinguish between them solely from their resultant ECL response. However, for a screening method, the detection of either MA and/or its metabolites would be sufficient. For both clinical and toxicological interpretation, an easily obtained and rapid “yes or no” would be greatly beneficial to either direct treatment or what and if further toxicological analysis is required. Therefore, despite the current inability to discriminate between these three ATS, this approach still meets the criterion of a screening method. For use within this field, analysis in biological matrices is key. The pH of these matrices can be quite different and so an understanding of the impact of pH on the ECL response is needed.
3.2 Evaluating the impact of pH on ECL analysis
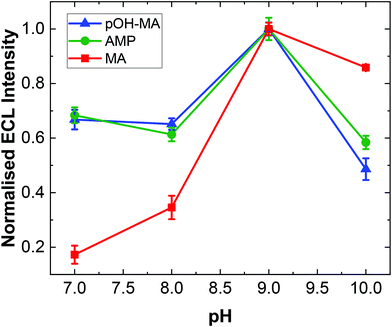
As with previous studies on other structurally similar compounds, the ECL intensity observed is strongly dependent on pH.19,20,31 The ECL intensity for ATS complexes is maximised at pH values near the pKa of the N-terminal amine site. Indeed, experimental evidence has illustrated that the overall reaction efficiency is strongly influenced by the pH at which the analysis is undertaken in addition to the electron donating/withdrawing behaviour of the functional groups attached to the α-carbon of the amino acid moiety within the ATS structure. This is primarily due to the fact that the pH influences the dominant form of the molecule under different pH conditions as influenced by the molecules’ dissociation mechanism. The ECL responses for MA at different pH values is shown in Fig. S2.†A similar trend was observed within this study for pOH-MA with the maximum ECL intensity obtain at values close to its pKa.38 As shown in Fig. 2, the ECL intensity increases as the pH increases from 7, reaching a maximum intensity at ∼pH 9. When the pH range was increased to values higher than pH 10, a significant background signal was observed. This is due to formation of the excited state from a secondary reaction between [Ru(bpy)3]3+ and OH−. The normalised ECL intensity is defined as the ratio of signal intensity (IpOH-MA) to background intensity (IBKG). ECL signals were clearly observed across the entire pH range evaluated to varying degrees. This is extremely relevant when considering analysis in a variety of biological matrices where the samples will have different pH values. In this context, MA and AMP were also studied to interrogate their pH dependence for ECL production.
The highest ECL intensity of MA, AMP and pOH-MA were observed at pH 9.0 (pKa of MA: 10.1, pKa of AMP: 10.5, pKa of pOH-MA: 9.8). These results are supported by previous work which illustrate the increased difficulty to oxidise amine species at low pH values, where their protonated and hence not electrochemically active form is dominant.17–20,39
3.3 Analytical parameters
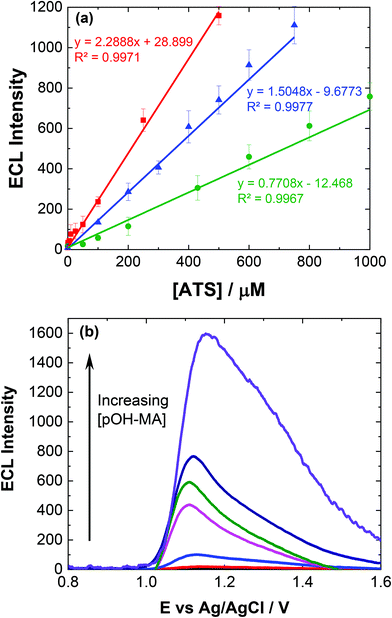
To ensure sensor performance was adequate for both qualitative and semi-quantitative analysis, the analytical parameters for this ECL based sensor were evaluated. As mentioned, while pH 10 may provide the greatest ECL response, pH 9 represents a much greater signal to noise (S/N) ratio and is therefore more discriminating. However, to evaluate the response over different pH values, reflecting the range of pHs observed for biological matrices investigated within this study, calibrations were conducted at pH 7 and 10.Linear coefficients (R2) of 0.9971, 0.9967 and 0.9977 were obtained for the pH values investigated as shown in Table 1 and Fig. 3(a). The limit of detection (LoD) at each of the pH values was also calculated based upon the lowest concentration were an observable signal was still distinguishable at a signal to noise ratio of 3, summarised in Table 1.
| ECL approach for ATS | LoD | LoD in biological matrix | Linear range |
|---|---|---|---|
| MA – this study | 74.6 nM | 0.2 μM serum | 0.1 μM to 0.5 mM |
| 0.5 μM urine | |||
| 10 μM saliva | |||
| AMP – this study | 1 μM | 6 μM serum | 10 μM to 1 mM |
| 2 μM urine | |||
| 10 μM saliva | |||
| pOH-MA – this study | 82.8 nM | 4 μM serum | 0.1 mM to 5 mM |
| 4 μM urine | |||
| 10 μM saliva | |||
| MA – multiwall carbon nanotube/ionic liquid composite electrode9 | 8.0 nM | 10 nM to 80 μM | |
| MA – glassy carbon electrode modified with [Ru(bpy)3]2+ – doped silica nanoparticles/Nafion composite film10 | 26.0 nM | 0.1 μM to 10 μM | |
| MA – ECL sensor organically modified with silica film11 | 0.2 μM | 0.5 μM to 1 mM |
The influence of pOH-MA, AMP and MA concentrations on ECL intensity was evaluated over the concentration range 0.1 μM and 0.5 mM, consistent with the expected values that would be observed within biological fluids after ingesting MA8 and comparable to previous studies in optimised sample matrices, as shown in Fig. 3(a).9–11Fig. 3(b) illustrates the increase in the ECL response, taken at the peak maximum for each analyte, as the concentration of pOH-MA increases. This trend is similar for both MA and AMP (see Fig. S3†) at pH 10 as well as at pH 7 (see Fig. S4†), as well as other compounds with comparable amine functional groups. LOD for the biological samples are slightly higher, as shown in Table 1, due to the interference effects of natural amino acids. Despite this, they are still within the forensic and toxicologically relevant range. The forensically relevant ranges for MA and AMP are 0.12 to 20 μM and 48 to 2.6 μM respectively. The range for MA is therefore appropriate for relevant forensic samples, however, improvements are needed for AMP and pOH.
3.4 Biological fluid analysis
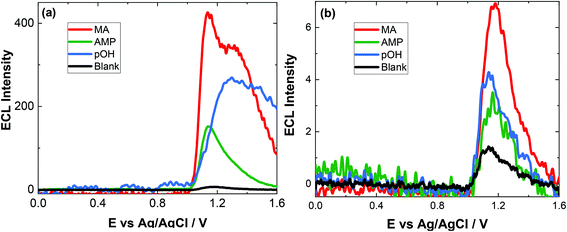
To evaluate the capacity of our approach for toxicological analysis, a range of biological fluids typically used for ATS analysis were examined. The biological matrices chosen included artificial saliva, artifical urine and pooled human serum. These samples are utilised to illustrate the feasibility of this approach for screening within complex biological matrices which will have numerous interferences. We report here for the first time, a method for screening of ATS in biological samples. In the literature, there is very limited study about pOH-MA in body fluids by ECL and electrochemical methods. Therefore, the results of this study were compared to standardised laboratory methods for ATS analysis, namely, LC-MS and GC-MS.36Previous studies using screen-printed electrodes illustrated that an ECL response can be obtained directly from saliva, although it is advantageous to dilute it due to the issues surrounding its viscosity.42 However, when using conventional GC electrodes, the issue of viscosity was more pronounced and an ECL response could not be obtained, despite the fact that no ECL response was obtained from the blank artificial saliva sample before spiking. Indeed, after dilution, as seen in Fig. 4(a) the blank response is so low as to be indistinguishable from the baseline. Upon dilution with 0.1 M PBS (pH = 9.0) in a ratio 1![[thin space (1/6-em)]](https://www.rsc.org/images/entities/char_2009.gif) :
:![[thin space (1/6-em)]](https://www.rsc.org/images/entities/char_2009.gif) 5 (v/v), an ECL response from the spiked artificial saliva is clearly visible as shown in Fig. 4. The concentration of the ATS reported is that prior to dilution. This figure also highlights that the response from control or blank artificial saliva alone does not produce any significant interferent. The rational for achieving an increased response after dilution is attributed to the lowering of the viscosity of the sample therefore allowing sufficient kinetics to take place facilitating the production of the ECL response and to a lesser extent, to the shift in pH from ∼7.4 to the optimal pH for ECL detection of pOH-MA at ∼pH 9.0.
5 (v/v), an ECL response from the spiked artificial saliva is clearly visible as shown in Fig. 4. The concentration of the ATS reported is that prior to dilution. This figure also highlights that the response from control or blank artificial saliva alone does not produce any significant interferent. The rational for achieving an increased response after dilution is attributed to the lowering of the viscosity of the sample therefore allowing sufficient kinetics to take place facilitating the production of the ECL response and to a lesser extent, to the shift in pH from ∼7.4 to the optimal pH for ECL detection of pOH-MA at ∼pH 9.0.
As evident from Fig. 4(a), at high concentration of drug, a secondary peak is observed. This is likely due to diffusional issues within this quite viscose sample matrix. However, this is not an issue at the concentrations expected to be obtained from saliva samples (Fig. 4(b)).
![[thin space (1/6-em)]](https://www.rsc.org/images/entities/char_2009.gif) :
:![[thin space (1/6-em)]](https://www.rsc.org/images/entities/char_2009.gif) 3 ratio with 0.1 M PBS (pH 9).
3 ratio with 0.1 M PBS (pH 9).
Chromatographic analysis of p-OH-MA by LC-MS-MS achieved recovery rates of between 85–90% for spiked blood/serum samples in the μM range.31,32 The % recovery rates achieved here are consistent with these previous reports, however the approach described here would be effective as a portable, rapid screening method at crime scenes or as a point-of-care device. This is primarily due to the simple process, particularly for saliva and urine samples, which negates the need for sample preparation. Indeed, if needed this approach could be implemented without any pre-treatment, although lower recovery rates would be achieved.
According to the results from the experiments, we report pH effect is very important in ECL intensity and ECL detection of MA and its main metabolite by a modified electrode system with [Ru(bpy)3]2+ and Nafion film can be done in body fluids.
![[thin space (1/6-em)]](https://www.rsc.org/images/entities/char_2009.gif) :
:![[thin space (1/6-em)]](https://www.rsc.org/images/entities/char_2009.gif) 3 v/v ratio.
3 v/v ratio.
% recovery of pOH-MA, MA and AMP in diluted human serum (1![[thin space (1/6-em)]](https://www.rsc.org/images/entities/char_2009.gif) :
:![[thin space (1/6-em)]](https://www.rsc.org/images/entities/char_2009.gif) 3), artificial saliva (1
3), artificial saliva (1![[thin space (1/6-em)]](https://www.rsc.org/images/entities/char_2009.gif) :
:![[thin space (1/6-em)]](https://www.rsc.org/images/entities/char_2009.gif) 5) and urine (1
5) and urine (1![[thin space (1/6-em)]](https://www.rsc.org/images/entities/char_2009.gif) :
:![[thin space (1/6-em)]](https://www.rsc.org/images/entities/char_2009.gif) 3) was investigated and the maximum ECL intensities compared to that of the ATS in 0.1 M PBS. In the experiment, three different concentration were used (150, 200 and 250 μM). % recovery ratio of each body fluid was shown in Table 2. Based on the results, our system is working in body fluids and has high recovery ratio.
3) was investigated and the maximum ECL intensities compared to that of the ATS in 0.1 M PBS. In the experiment, three different concentration were used (150, 200 and 250 μM). % recovery ratio of each body fluid was shown in Table 2. Based on the results, our system is working in body fluids and has high recovery ratio.
| [ATS] μM | Neat | Saliva | Human serum | Urine |
|---|---|---|---|---|
| % recovery | % recovery (±4.68) | % recovery (±6.22) | % recovery (±4.45) | |
| [MA] 150 | 76.73 | 76.70 | 88.90 | |
| [MA] 200 | 41.31 (urine) | 91.27 | 89.73 | 89.29 |
| 3.18 (serum) | ||||
| [MA] 250 | 87.31 | 91.45 | 87.71 | |
| [AMP] 150 | 85.57 | 91.56 | 88.49 | |
| [AMP] 200 | 22.29 (urine) | 90.41 | 94.63 | 91.72 |
| 11.43 (serum) | ||||
| [AMP] 250 | 94.22 | 92.88 | 96.12 | |
| [pOH-MA] 150 | 92.77 | 86.44 | 94.48 | |
| [pOH-MA] 200 | 40.62 (urine) | 97.55 | 81.73 | 92.54 |
| 5.80 (serum) | ||||
| [pOH-MA] 250 | 89.6 | 88.57 | 91.24 |
In the literature, some previously reported voltammetric sensors with no modification to the working electrode have approximately LoD of 10−6 and generally working range is from 10−6 to 10−3.43–46 Some voltammetric sensors with modified working electrode show lower LoDs.47,48 A screen-printed electrode was modified with gold nanoparticles and that system has LoD of 6.0 nM.47 However, these systems are optimised for a single matrix and cannot be used in the same format for other biological matrices. Therefore, although the LoD for this study does need to be improved further, its applicability to use in portable devices where the sample matrix may not be known prior to attending a crime scene or arriving in an emergency room is a significant advantage. In addition, the ability to detect not just one ATS but AMP, MA and pOH-MA is also advantageous for portable screening. Future work examining the potential of a ratiometric approach19 to improve selectivity and investigation of alternative supports or the inclusion of nanoparticles to enhance the ECL response,49–52 thereby increasing the sensitivity are underway.
When the results from HPLC, MA in human serum was detected by ECL method and a simple liquid–liquid extraction was performed to decrease the background signal from the interference. LoD was found as 0.5 μM (signal to noise, 1![[thin space (1/6-em)]](https://www.rsc.org/images/entities/char_2009.gif) :
:![[thin space (1/6-em)]](https://www.rsc.org/images/entities/char_2009.gif) 3) and % recovery ratio was ∼94%.38 Also, HPLC-MS method was studied for detection of some of amphetamine-type stimulants in human urine. LoD for MA was 1 nM and linear working range was 36.1 nM to 0.38 mM. In this method, there was a solid phase extraction step to decrease the effect of interferences in human urine.21 GS-FID (flame ionization detector) was used to detect AMP in urine. LoD for AMP was 2 nM and linear working range was 7.4 nM to 14.8 μM.40pOH-MA in urine was analysed by HPLC and % recovery was seen as % 86.5 and linear working range was 27.8 μM to 418 μM and LoD was 5.2 μM.41 Given that the studies in the literature, LoDs for MA, AMP and pOH-MA by our ECL system are low enough to meet to the requirements in real urine samples without the necessity of an extraction phase. This work illustrates a proof of concept for the screening of ATS in biological matrices, current work is underway to further improve both the sensitivities as well as approaches to provide more selectivity, although in initial triage/screening this is not needed.
3) and % recovery ratio was ∼94%.38 Also, HPLC-MS method was studied for detection of some of amphetamine-type stimulants in human urine. LoD for MA was 1 nM and linear working range was 36.1 nM to 0.38 mM. In this method, there was a solid phase extraction step to decrease the effect of interferences in human urine.21 GS-FID (flame ionization detector) was used to detect AMP in urine. LoD for AMP was 2 nM and linear working range was 7.4 nM to 14.8 μM.40pOH-MA in urine was analysed by HPLC and % recovery was seen as % 86.5 and linear working range was 27.8 μM to 418 μM and LoD was 5.2 μM.41 Given that the studies in the literature, LoDs for MA, AMP and pOH-MA by our ECL system are low enough to meet to the requirements in real urine samples without the necessity of an extraction phase. This work illustrates a proof of concept for the screening of ATS in biological matrices, current work is underway to further improve both the sensitivities as well as approaches to provide more selectivity, although in initial triage/screening this is not needed.
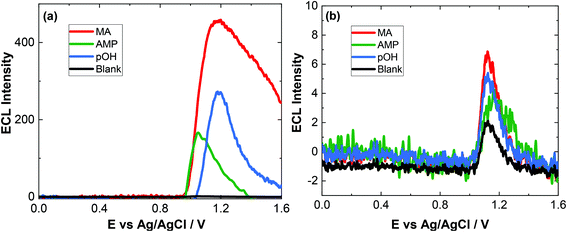
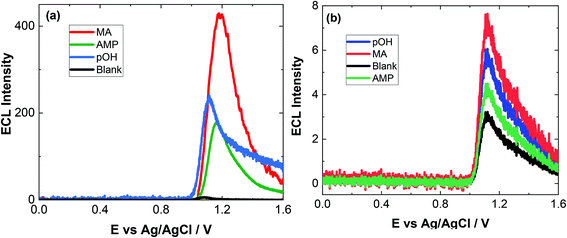
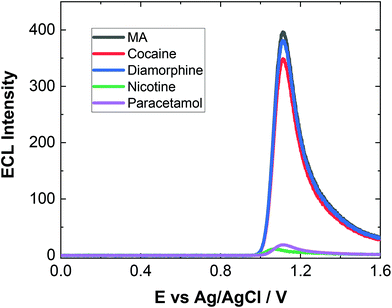
As evident, natural amino acids from the biological samples do produce a signal (see Fig. 4–6). To further assess the specificity of this approach, an interferent study was performed with other compounds including cocaine and diamorphine as well as nicotine. These interferences were assessed against the response of MA and can be found in Fig. 7. As shown both cocaine and diamorphine at similar concentrations produce comparable ECL responses. Previous aptamer-based sensors also saw responses from cocaine.53 Other non-illicit substances were also assessed, namely nicotine and paracetamol. These do produce responses in the same range as the blank or neat biological samples themselves. This does represent a limitation of the current of the proposed approach, this is outweighed by the potential screening ability of this portable ECL approach and the rapid results that can be obtained. Despite these interference effects, we are confident in the identification of the presence of illicit drugs including ATS from this screening approach.
4. Conclusion
In this work we demonstrated the ability of a simple Nafion-[Ru(bpy)3]2+ film modified electrode to detect MA alongside two of its metabolites within a variety of biological matrices. Unfortunately, the current approach does not provide the ability to discriminate between the different ATS present, although it is possible to confidently determine that at least one of these ATS is present. Determining the presence of an ATS is still extremely useful for screening or triage purposes for portable detection. Future work into gaining this ability to discriminate between structurally similar complexes is currently underway. This approach highlights the ability of this ECL based sensor to be applied to non-ideal biological matrices with little to no sample preparation and no extraction required, thereby being ideally suited for implementation within portable and on-site screening. This showcases the potential of ECL sensors for portable detection.Conflicts of interest
The authors have no conflicts of interest to declare.Acknowledgements
The authors would like to thank the Republic of Turkey Ministry of National Education for financially supporting this research. All data underpinning this publication are openly available from the University of Strathclyde Knowledge Base at https://doi.org/10.15129/e6b485a1-d3c2-453d-87df-df09fa25f2d7.References
- UNODC: United Nations Office on Drugs and Crime. UNODC Early Warning Advisory (EWA) on New Psychoactive Substances (NPS), https://www.unodc.org/LSS/Page/NPS, (accessed October 2020).
- F. Westphal, C. Franzelius, J. Schäfer, H. W. Schütz and G. Rochholz, Accredit. Qual. Assur., 2007, 12, 335–342 CrossRef CAS.
- J. C. Scott, S. P. Woods, G. E. Matt, R. A. Meyer, R. K. Heaton, J. H. Atkinson and I. Grant, Neuropsychol. Rev., 2007, 17, 275–297 CrossRef PubMed.
- K. E. Moeller, K. C. Lee and J. C. Kissack, Mayo Clin. Proc., 2008, 83, 66–76 CrossRef CAS PubMed.
- S. Graziano, L. Anzillotti, G. Mannocchi, S. Pichini and F. P. Busardò, J. Pharm. Biomed. Anal., 2019, 163, 170–179 CrossRef CAS PubMed.
- K. E. Grafinger, M. E. Liechti and E. Liakoni, Br. J. Clin. Pharmacol., 2019, 86(3), 429–436 CrossRef PubMed.
- O. Beck, L. Rausberg, Y. Al-Saffar, T. Villen, L. Karlsson, T. Hansson and A. Helander, Drug Test. Anal., 2014, 6, 492–499 CAS.
- M. A. Huestis and E. J. Cone, Ann. N. Y. Acad. Sci., 2007, 1098, 104–121 CrossRef CAS PubMed.
- G. Sloop, M. Hall, G. T. Simmons and C. A. Robinson, J. Anal. Toxicol., 1995, 19, 554–556 CrossRef CAS PubMed.
- W. Miao, Chem. Rev., 2008, 108, 2506–2553 CrossRef CAS PubMed.
- M. M. Richter, Chem. Rev., 2004, 104, 3003–3036 CrossRef CAS PubMed.
- C. K. P. Truong, T. D. D. Nguyen and I. S. Shin, BioChip J., 2019, 13, 203–216 CrossRef CAS.
- W. Gao, S. Jeanneret, D. Yuan, T. Cherubini, L. Wang, X. Xie and E. Bakker, Anal. Chem., 2019, 91, 4889–4895 CrossRef CAS.
- E. H. Doeven, G. J. Barbante, A. J. Harsant, P. S. Donnelly, T. U. Connell, C. F. Hogan and P. S. Francis, Sens. Actuators, B, 2015, 216, 608–613 CrossRef CAS.
- Y. Yao, H. Li, D. Wang, C. Liu and C. Zhang, Analyst, 2017, 142, 3715–3724 RSC.
- L. Shaw and L. Dennnay, Curr. Opin. Electrochem., 2017, 3(1), 23–28 CrossRef CAS.
- K. Brown, C. Jacquet, J. Biscay, P. Allan and L. Dennany, Analyst, 2020, 145, 4295–4304 RSC.
- K. Brown, M. McMenemy, M. Palmer, M. J. Baker, D. W. Robinson, P. Allan and L. Dennany, Anal. Chem., 2019, 91, 12369–12376 CrossRef CAS PubMed.
- K. Brown, C. Jacquet, J. Biscay, P. Allan and L. Dennany, Anal. Chem., 2020, 92, 2216–2223 CrossRef CAS PubMed.
- J. McGeehan and L. Dennany, Forensic Sci. Int., 2016, 264, 1–6 CrossRef CAS PubMed.
- C. Han, Z. Shang, H. Zhang and Q. Song, Anal. Methods, 2013, 5, 6064–6070 RSC.
- Y. Zhang, R. Zhang, X. Yang, H. Qi and C. Zhang, J. Pharm. Anal., 2019, 9, 9–19 CrossRef PubMed.
- P. Norouzi, B. Larijani, T. Alizadeh, E. Pourbasheer, M. Aghazadeh and M. R. Ganjali, Curr. Anal. Chem., 2019, 15, 143–151 CrossRef CAS.
- J. Narang, C. Singhal, M. Khanuja, A. Mathur, A. Jain and C. S. Pundir, Artif. Cells, Nanomed., Biotechnol., 2018, 46, 1586–1593 CAS.
- C. A. Bartlett, S. Taylor, C. Fernandez, C. Wanklyn, D. Burton, E. Enston, A. Raniczkowska, M. Black and L. Murphy, Chem. Cent. J., 2016, 10, 3 CrossRef PubMed.
- M. Akhoundian, T. Alizadeh, M. R. Ganjali and P. Norouzi, Talanta, 2019, 200, 115–123 CrossRef CAS PubMed.
- B. Zanfrognini, L. Pigani and C. Zanardi, J. Solid State Electrochem., 2020, 24, 2603–2616 CrossRef CAS.
- R. J. Schepers, J. M. Oyler, R. E. Joseph Jr., E. J. Cone, E. T. Moolchan and M. A. Huestis, Clin. Chem., 2003, 49, 121–132 CrossRef CAS PubMed.
- R. M. White and C. M. Moore, Detection of Drugs and Their Metabolites in Oral Fluid, Elsevier, 2018 Search PubMed.
- D. J. Wagner, J. E. Sager, H. Duan, N. Isoherranen and J. Wang, Drug Metab. Dispos., 2017, 45(7), 770–778 CrossRef CAS PubMed.
- L. Dennany, E. J. O'Reilly, T. E. Keyes and R. J. Forster, Electrochem. Commun., 2006, 8, 1588–1594 CrossRef CAS.
- D. An, Z. Chen, J. Zheng, S. Chen, L. Wang, Z. Huang and L. Weng, Food Chem., 2015, 168, 1–6 CrossRef CAS.
- W. Cao, J. Liu, H. Qiu, X. Yang and E. Wang, Electroanalysis, 2002, 14, 1571–1576 CrossRef CAS.
- H. Hosono, W. Satoh, J. Fukuda and H. Suzuki, Sens. Actuators, B, 2007, 122, 542–548 CrossRef CAS.
- R. A. S. Couto, S. S. Costa, B. Mounssef Jr., J. G. Pacheco, E. Fernandes, F. Carvalho, C. M. P. Rodrigues, C. Delerue-Matos, A. A. C. Braga, L. Moreira Gonçalves and M. B. Quinaz, Sens. Actuators, B, 2019, 290, 378–386 CrossRef CAS.
- H. M. Schwelm, C. Grumann, V. Auwärter and M. A. Neukamm, Drug Test. Anal., 2020, 12(9), 1354–1365 CrossRef CAS PubMed.
- E. Dokuzparmak and L. Dennany, Proc. SPIE 11542, in Counterterrorism, Crime Fighting, Forensics and Surveillance Technologies IV, 2020, DOI:10.1117/12.2573548.
- F. Takahashi, S. Nitta, R. Shimizu and J. Jin, Forensic Toxicol., 2018, 36(1), 185–191 CrossRef CAS.
- L. Zheng, Y. Chi, Q. Shu, Y. Dong, L. Zhang and G. Chen, J. Phys. Chem. B, 2009, 113, 20316–20321 CAS.
- A. Song and J. Yang, Anal. Chim. Acta, 2019, 1045, 162–168 CrossRef CAS PubMed.
- N. Kato, S. Fujita, H. Kubo and H. Homma, J. Liq. Chromatogr. Relat. Technol., 2005, 28(19), 3099–3108 CrossRef CAS.
- K. M. Hold, D. de Boer, J. Zuidema and R. A. Maes, Int. J. Drug Testing, 1996, 1(1), 1–36 Search PubMed.
- Ľ. Švorc, M. Vojs, P. Michniak, M. Marton, M. Rievaj and D. Bustin, J. Electroanal. Chem., 2014, 717, 34–40 CrossRef.
- A. H. Oghli, E. Alipour and M. Asadzadeh, RSC Adv., 2015, 5(13), 9674–9682 RSC.
- B. Demir, T. Yılmaz, E. Guler, Z. P. Gumus, H. Akbulut, E. Aldemir, H. Coskunol, D. G. Colak, L. Cianga, S. Yamada, S. Timur, T. Endo and Y. Yagcı, Talanta, 2016, 161, 789–796 CrossRef CAS PubMed.
- C. Bartlett, S. Taylor, C. Fernandez, C. Wanklyn, D. Burton, E. Enston, A. Raniczkowska, M. Black and L. Murphy, Chem. Cent. J., 2016, 10(1), 3 CrossRef PubMed.
- B. Rafiee, A. R. Fakhari and M. Ghaffarzadeh, Sens. Actuators, B, 2015, 218, 271–279 CrossRef CAS.
- M. Akhoundian, T. Alizadeh, M. R. Ganjali and P. Norouzi, Talanta, 2019, 200, 115–123 CrossRef CAS PubMed.
- L. Dennany, P. C. Innis, G. G. Wallace and R. J. Forster, J. Phys. Chem. B, 2008, 112(41), 12907–12912 CrossRef CAS.
- E. J. O'Reilly, L. Dennany, D. Griffith, F. Moser, T. E. Keyes and R. J. Forster, Phys. Chem. Chem. Phys., 2011, 13, 7095–7101 RSC.
- E. J. O'Reilly, T. E. Keyes, R. J. Forster and L. Dennany, Electrochem. Commun., 2018, 86, 90–93 CrossRef.
- L. Dennany, G. G. Wallace and R. J. Forster, Langmuir, 2009, 25(24), 14053–14060 CrossRef CAS PubMed.
- B. Zanfrognini, L. Pigani and C. Zanardi, J. Solid State Electrochem., 2020, 24, 2603–2616 CrossRef CAS.
Footnote |
| † Electronic supplementary information (ESI) available. See DOI: 10.1039/d1an00226k |
| This journal is © The Royal Society of Chemistry 2021 |

