Realizing ultrahigh recoverable energy density and superior charge–discharge performance in NaNbO3-based lead-free ceramics via a local random field strategy†
Junpeng
Shi
,
Xiuli
Chen
*,
Xu
Li
,
Jie
Sun
,
Congcong
Sun
,
Feihong
Pang
and
Huanfu
Zhou
Collaborative Innovation Center for Exploration of Hidden Nonferrous Metal Deposits and Development of New Materials in Guangxi, Key Laboratory of Nonferrous Materials and New Processing Technology, Ministry of Education, School of Materials Science and Engineering, Guilin University of Technology, Guilin 541004, China. E-mail: cxlnwpu@163.com
First published on 10th February 2020
Abstract
The development and use of high-performance and environmentally friendly energy storage capacitors are urgently demanded. Despite extensive research efforts, the performance of existing lead-free dielectric ceramics is barely satisfactory. In this work, a novel lead-free 0.78NaNbO3–0.22Bi(Mg2/3Ta1/3)O3 (0.22BMT) linear-like relaxor ferroelectric with ultrahigh energy storage capability and ultrahigh efficiency was designed and synthesized via a local random field strategy. To our satisfaction, an ultrahigh recoverable energy density (Wrec, 5.01 J cm−3) and an ultrahigh energy efficiency (η) of 86.1% were achieved simultaneously, which are superior to those of other reported lead-free systems. In addition, excellent temperature, frequency and fatigue stabilities (variation of Wrec < 8% over 20–200 °C, Wrec < 3% after 1–100 Hz and 104 cycles) were observed. More importantly, the 0.22BMT ceramic exhibited a large current density (CD ∼ 537.9 A cm−2), an extremely high power density (PD ∼ 37.7 MW cm−3), and an ultrafast discharge time (t0.9 ∼ 23 ns). The impedance analysis demonstrated that the introduction of BMT was beneficial for the improvement of the insulation ability and breakdown strength (Eb) of the 0.22BMT ceramic. Additionally, nonisovalent Mg2+ and Ta5+-filled Nb5+ on the B-site with low average electronegativity generated a random local field, which enhanced the ion bonding, destroyed the long-range order and led to decreased remnant polarization (Pr). These results indicate that this new strategy is a feasible and efficacious means to simultaneously achieve ultrahigh Wrec, superior η and excellent thermal stability in NN-based lead-free ceramics. Furthermore, this work has further broadened the scope of research and the application of the NN-based ceramics.
1. Introduction
With the continuous consumption of non-renewable resources and the increasingly serious environmental problems, the development and utilization of high performance, environmentally friendly energy storage materials have become a research hotspot in current technology and industry.1–4 With their advantages of light weight, high power density, excellent stability, good environmental adaptability, ageing resistance and low manufacturing cost, dielectric energy storage capacitors show substantial application prospects in automotive electronics, communication, medical equipment and other fields.5–8 If the energy storage density of the capacitor can be strategically improved, the application field of the capacitor can be further expanded to effectively reduce the volume of the capacitor and achieve the miniaturization and integration of the capacitor. Herein, it is vital to exploit lead-free energy storage ceramic materials with excellent performance and environmental friendliness.9–15 Generally, there are four kinds of energy storage dielectric: ferroelectrics (FE), relaxor ferroelectrics (RFE), anti-ferroelectrics (AFE) and linear dielectrics (LD). Due to low hysteresis polarization response, the RFE ceramics generally have higher η values; however, the limited Wrec values restrict their further applications.16,17,21 It is hard for anti-ferroelectric materials to bear the long-term cyclic operation because they will probably crack owing to phase transition.49 By contrast, the LD ceramics have been extensively studied in dielectric capacitors because of their highest Eb and low loss during the discharging process.18,19 Nevertheless, the Wrec of LD is small due to a low relative dielectric constant (εr) and small maximum polarization (Pmax).21 Based on the above considerations, we focussed on the improvement of Eb, which causes LD to show excellent energy storage performance.22,23Recently, numerous research results have shown that by B-doping or A- and B- doping, lead-based and lead-free ceramics with excellent energy storage characteristics can be obtained. For example, Zhang et al. prepared (Pb, La)(Zr, Ti)O3 ceramics using the spark plasma sintering method and achieved an ultrahigh Wrec of 6.4 J cm−3.24 Moreover, Han and co-workers also fabricated (Sm0.02Ag0.94)(Nb0.9Ta0.1)O3 AFE ceramics and obtained a Wrec of 4.4 J cm−3 at 280 kV cm−1.25 Li et al. found that the Wrec values of BT ceramics can be increased to 3 J cm−3 and 3.282 J cm−3via the addition of BiMeO3 (Me = Li1/3Zr2/3, Mg2/3Ta1/3) compounds, respectively.26,27 Lately, a series of dielectric materials with large Wrec value were achieved in NN-based ceramics. For instance, Ye et al. reported that NN-based ceramics possessed high Wrec ≈ 2.8 J cm−3 and Eb ≈ 300 kV cm−1, benefitting from the intention of enhancing anti-ferroelectricity and constructing a local random field engineered engineering.57 In addition, both a high Wrec of 2.20 J cm−3 and η of 62.68% were achieved in 0.91NaNbO3–0.09Bi(Zn0.5Ti0.5)O3 ceramics at 250 kV cm−1 by Fan et al.28 A large Wrec of 3.02 J cm−3 at 310 kV cm−1 for 0.80NaNbO3–0.20SrTiO3 ceramics was reported by Zhou et al.20 As mentioned above, lead-based materials are significantly better than lead-free materials in comprehensive energy storage, but the use of numerous lead elements is harmful to the human body. Furthermore, most Ag-based AFE have relatively low η (75%), while Ag oxides are expensive and difficult to prepare.27 NN-based ceramics can acquire a relatively high Wrec and a low η. Specifically, there are few studies reporting that ultrahigh Wrec (>5 J cm−3) and η (>80%) can be obtained simultaneously in NN-based or other lead-free systems.
The following strategy was applied in this work. BMT was introduced to control the dielectric properties (i.e., depressing the dielectric nonlinearly, reducing the dielectric loss, and obtaining the appropriate εr), which improved the Eb. The significant improvement of energy storage is summarized as follows:
(I) The Pmax could be strengthened by adjusting the hybridization between the 6p orbital of Bi3+ and the 2p orbital of O.2–27 The larger ionic radii [(Mg2/3Ta1/3)3+ (0.68 Å) would substitute for rNb5+ (0.64 Å)] in the B-site, and greater polarization could encourages larger induced polarization of polar clusters.28
(II) The introduction of B-site ions with low polarizability could effectively enhance the antiferroelectricity of NN.57 Furthermore, nonisovalent Mg2+ and Ta5+ filled Nb5+ on B-site with low average electronegativity generated a random local field, which enhanced the ion bonding, destroyed the long-range order and led to decreased Pr.28
(III) The increase of Eb was largely attributed to the compact microstructure, the small grain size, the high-κ insulator such as Ta2O5 (≈4 eV) oxide,23,27 the grain boundary resistivity increase, the interface polarization inhibition, the leakage loss reduction and the inhibition of the expansion of the conductive path.27
Based on the above considerations, the energy storage performance of linear-like relaxor ferroelectrics can be conspicuously improved by chemical co-substitution of Bi3+ and (Mg2/3Ta1/3)3+ ions in A and B sites, respectively. As expected, an ultrahigh Wrec of 5.01 J cm−3 and η of 86.1% of the 0.22BMT ceramic can be achieved, accompanied by excellent temperature, frequency and fatigue stability. Furthermore, the superior stability of η can be observed in the temperature ranging from 20–200 °C, a wide frequency range (1–100 Hz) and fatigue (1–104 cycles). More importantly, the 0.22BMT ceramic presents prominent charge–discharge performance with substantial CD (∼537.9 A cm−2), extremely high PD (∼37.7 MW cm−3), and ultrafast discharge rate (∼23 ns). These results reveal that the sample could be considered as a promising candidate for lead-free energy storage capacitors.
2. Results and discussion
Fig. 1a displays the XRD patterns of xBMT ceramics at room temperature. All the ceramics display the pure perovskite structure without any impurity phase, indicating that BMT is completely diffused into the NN lattice. No splitting of both the (110) and (200) diffraction peaks indicates that the ceramics have a pseudo-cubic phase.26 The inset of Fig. 1a presents enlarged (110) and (200) diffraction peaks moving towards low angles as the BMT content increases, which may be attributed to volume expansion of the lattice.27 Generally, Bi3+ (1.34 Å, CN = 12) filled Na+ (1.39 Å, CN = 12) on the A-site while Mg2+ (0.72 Å, CN = 6) and Ta5+ (0.64 Å, CN = 6) substituted for Nb5+ (0.64 Å, CN = 6) on the B-site. Therefore, the increase in the lattice volume (as shown in Fig. 1b) may be due to the substitution of (Mg2/3Ta1/3)3+ (0.68 Å) for Nb5+ (0.64 Å) on the B-site.50 Meanwhile, to identify these issues and provide insight into the crystal structure and disorder characteristics of the xBMT ceramics, Raman spectroscopy was used, and the results are shown in Fig. S1 (ESI†). The Raman studies manifested that the cation disorder may account for the much slimmer P–E loops.8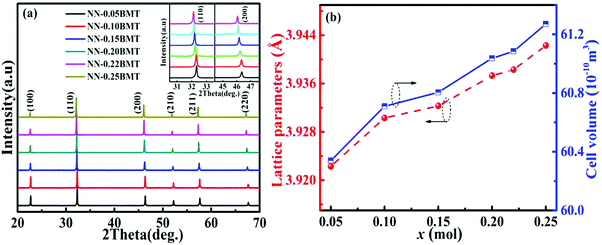 | ||
| Fig. 1 (a) XRD patterns of BMT-modified NN ceramics. (b) The corresponding Lattice parameters and unit cell volume as a function of x. | ||
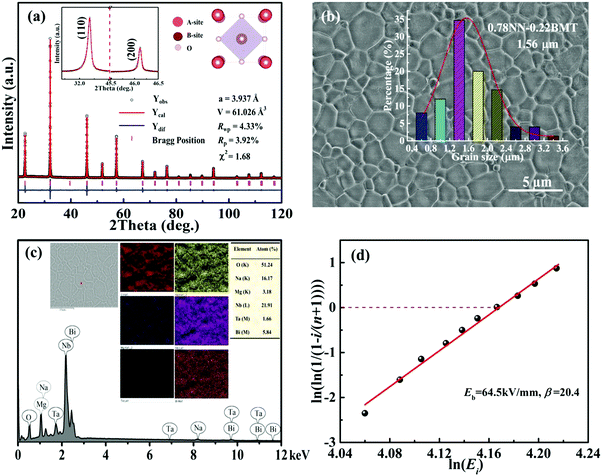
To further confirm the detailed phase structure of the 0.22BMT ceramic, a Rietveld refinement was employed via the GSAS software and the refined profiles fit the observed data well, as displayed in Fig. 2a. It is remarkable that final refined data and locally enlarged (110) and (200) peaks are observed in the inset of Fig. 2a, indicating that the pseudo-cubic phase is stabilized in the 0.22BMT ceramic. Moreover, the introduction of BMT can markedly decrease the grain size of the xBMT compounds, as shown in Fig. 2b and Fig. S2 (ESI†). Fig. 2b exhibits SEM image of the 0.22BMT ceramic, well-developed grains with dense and homogenous microstructure. Specifically, the average grain sizes of the xBMT compounds are 5.11, 4.04, 3.77, 2.72, 2.34 and 1.56 μm for x = 0, 0.05, 0.10, 0.15, 0.20, and 0.22, respectively. In order to determine the exact composition and the homogeneity of the sintered samples, we performed the elemental mapping analysis of the 0.22BMT ceramics, as shown in Fig. 2c.29,31 Compared with the initial chemical stoichiometric ratio, the minor compositional variation can be ascribed to both the detection error of the SEM and the element evaporation during sintering. As shown in Fig. S3 (ESI†), the bulk and relative densities of the 0.22BMT ceramics increased to a maximum value of 5.3 g cm−3 (98.4%) at a sintering temperature of 1260 °C. A relatively high relative density is desirable for practical applications. This high relative density is satisfactory, as small grain size and dense microstructure are conducive to obtaining ultrahigh Eb.29 For 0.22BMT ceramics, a similar phenomenon is seen in Fig. 2d. Weibull distribution was adopted to verify the value of Eb of the 0.22BMT ceramic. The reasonable values of Eb can be calculated by the following equations:25,27
| Xi = ln(Ei), | (1) |
| Yi = ln(ln(1/(1 − i/(1 + n)))), | (2) |
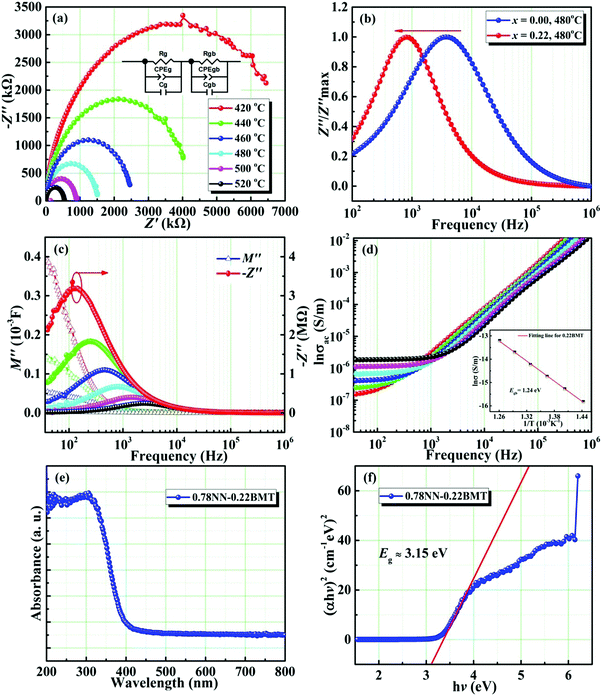
Fig. 3a manifests the complex impedance spectra of the 0.22BMT ceramic at different temperatures, reflecting the relation between the real part (Z′) and the imaginary part (Z′′) of impedance. Normally, the grain boundary response is believed to be in the low frequency region. The semicircle in the impedance spectrum is simulated by an equivalent circuit, which shows that the grain boundary response plays a leading role. The movement of the characteristic peak of the grain boundary reflects the change of resistivity in the electron active region.23 Compared with NN ceramics, the characteristic peak of the 0.22BMT sample moves to a lower frequency, which means that the resistivity increases due to the introduction of BMT. As shown in Fig. 3b, the imaginary part of impedance at different temperatures and frequencies has only one characteristic peak, which is consistent with the complex impedance spectrum. To further determine that the semicircle (Fig. 3a) reflects the role of the grain boundary, the modulus spectrum is introduced for further analysis in Fig. 3c. The impedance spectrum reflects the resistance characteristics of the material, and the modulus spectrum more clearly reflects the contribution of the different parts of the capacitance. The conversion relationship between the electronic modulus (M) and the impedance (Z) is as follows:33
| M = iωC0Z = M′ − iM′′, | (3) |
 | (4) |
 | (5) |
![[thin space (1/6-em)]](https://www.rsc.org/images/entities/char_2009.gif) σ vs. 1/T curve, the activation energy Egb is 1.53 eV.
σ vs. 1/T curve, the activation energy Egb is 1.53 eV.
To verify the effect of the band gap on improving Eb, the investigation of band gap energy (Eg) is shown in Fig. 3e and f. The band gap energy can be given as follows:22,32
| (αhν)1/n = A(hν − Eg), | (6) |
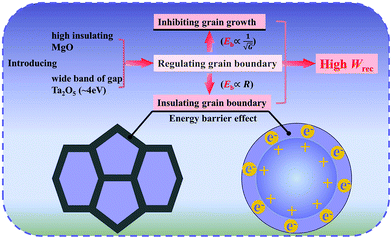
Based on the aforementioned discussions, the schematic diagram of excellent energy storage properties is shown in Fig. 4. The mechanism is associated with the moderate εr, insulating resistance grain boundaries and inhibiting grain growth. The ultrahigh Eb can be explained by the mechanism. Due to the high insulation, the grain boundary usually acts as an impediment to conduction. Smaller grain size means higher grain boundary density. The grain boundary can effectively block the charge migration under the external electric field. As a result, electrons will move smoothly in the grains but amass at the grain boundaries.34 The introduction of BMT has the advantage of improving the insulation resistance grain boundary and grain boundary barrier effect, which is conducive to achieving an ultrahigh Eb and improving energy storage performance.
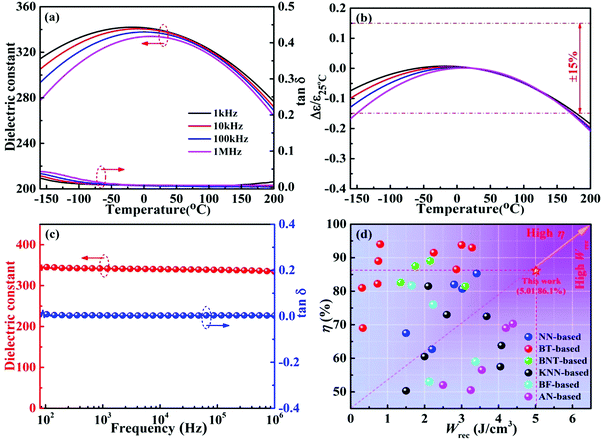
Fig. 5a demonstrates the relationship between the dielectric properties and temperature of 0.22BMT ceramics under different frequencies. The ceramics exhibit a proper εr and remain stable with the increasing the frequency, as shown in Fig. 5a. A weakly relaxor behavior was observed and verified due to the dielectric peak corresponding to frequency dispersion,40–43 which can be attributed to the substitution of Bi3+ at the A-site and the occupancy of Mg2+ and Ta5+ at the B-site. In addition, Fig. 5b demonstrates that the change in εr with temperature is effectively suppressed, especially for the dielectric constant Δε/ε25![[thin space (1/6-em)]](https://www.rsc.org/images/entities/char_2009.gif) °C ≤ ±15% (T = −160–180 °C) and low loss tangent tan
°C ≤ ±15% (T = −160–180 °C) and low loss tangent tan![[thin space (1/6-em)]](https://www.rsc.org/images/entities/char_2009.gif) δ < 3% (T = −160–200 °C) of the 0.22BMT ceramic exhibiting excellent temperature stability and application prospects of high temperature capacitor X8R.27,36Fig. 5c depicts the function of frequency and temperature. The εr and tan
δ < 3% (T = −160–200 °C) of the 0.22BMT ceramic exhibiting excellent temperature stability and application prospects of high temperature capacitor X8R.27,36Fig. 5c depicts the function of frequency and temperature. The εr and tan![[thin space (1/6-em)]](https://www.rsc.org/images/entities/char_2009.gif) δ almost remain at the same level in the testing frequency range. The dielectric properties exhibit good frequency stability, which is conducive to energy storage in the energy storage capacitors. The above conclusions are related to the high Eb and high polarization obtained. Larger dielectric constant and ultralow loss are beneficial for enhancing Eb. Fig. 5d summarizes the Wrec and η
δ almost remain at the same level in the testing frequency range. The dielectric properties exhibit good frequency stability, which is conducive to energy storage in the energy storage capacitors. The above conclusions are related to the high Eb and high polarization obtained. Larger dielectric constant and ultralow loss are beneficial for enhancing Eb. Fig. 5d summarizes the Wrec and η![[thin space (1/6-em)]](https://www.rsc.org/images/entities/char_2009.gif) 6,8–12,14,28–39,44–59 between this work and other recently reported lead-free bulk ceramics. For example, medium Wrec and η are exhibited by BiFeO3-based and BNT-based ceramics. BaTiO3-based ceramics show relatively low Wrec and high η values, while the opposite trend is shown in AgNbO3-based and (K0.5Na0.5)NbO3-based systems. In particular, it can be seen from the Fig. 5d that an ultrahigh Wrec and η are realized simultaneously in the 0.22BMT ceramic, which are almost obviously superior to most of the other lead-free bulk ceramics reported in the literature. In addition, the 0.22BMT ceramic exhibits outstanding comprehensive properties and has a broad prospect in the practical application of capacitors.
6,8–12,14,28–39,44–59 between this work and other recently reported lead-free bulk ceramics. For example, medium Wrec and η are exhibited by BiFeO3-based and BNT-based ceramics. BaTiO3-based ceramics show relatively low Wrec and high η values, while the opposite trend is shown in AgNbO3-based and (K0.5Na0.5)NbO3-based systems. In particular, it can be seen from the Fig. 5d that an ultrahigh Wrec and η are realized simultaneously in the 0.22BMT ceramic, which are almost obviously superior to most of the other lead-free bulk ceramics reported in the literature. In addition, the 0.22BMT ceramic exhibits outstanding comprehensive properties and has a broad prospect in the practical application of capacitors.
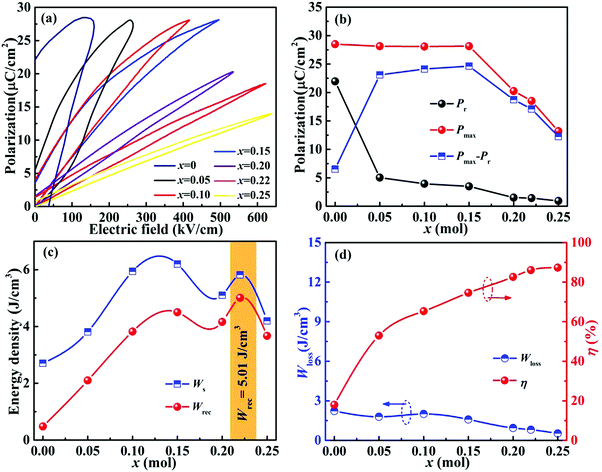
Fig. 6(a) displays the unipolar P–E loops of xBMT ceramics measured at 10 Hz under Eb. As the x-content increases, the unipolar P–E loops increase linearly, accompanied by a gradually decrease in Pr. Upon increasing the BMT content from 0.05 to 0.25, the xBMT ceramic gradually changes from relaxor AFEs to linear dielectrics, which is conducive to obtaining excellent Wrec and η. As shown in Fig. 6b, both Pmax and Pr gradually decrease, accompanied by a low Pmax–Pr (≤1.4 μC cm−2) in the 0.22BMT ceramic. Fig. 6c and d show the energy storage performances of xBMT ceramics. The values of Wrec and η significantly increase from 2.1 J cm−3 and 55% to 5.01 J cm−3 and 86.1%, respectively, upon increasing the BMT content from x = 0.05 to x = 0.22. Simultaneously achieving an ultrahigh Wrec and η in the 0.22BMT ceramic may be attributed to the highest Eb. Consequently, by introducing BMT into the NN solution, its energy storage performance is greatly enhanced.
To further understand the excellent energy storage performance of the 0.22BMT ceramic, the unipolar P–E curves are shown in Fig. 7. With the increase of the electric field, the slender P–E loops gradually extend outward in Fig. 7a. The 0.22BMT ceramics sample presents ultraslim P–E loops and smaller Pr, which indicate that the ceramics will need less energy loss during the charge and discharge processes, showing that the 0.22BMT ceramic exhibit high efficiency of ≥ 86.1%. Meanwhile, the larger Eb is clearly presented in Fig. 7b and is due to the wide band gap of high-κ insulator Ta2O5 (∼4 eV). The 0.22BMT ceramic has a wider Eg, and the electrons in the valence band do not easily jump into the conduction band, which would contribute to a high possibility of intrinsic breakdown.27 A convenient path for the charge transfer is between grains and grain boundaries, leading to a transition from the charge localization state to the charge diffusion state, which accounts for depressed interfacial polarization. It can be obtained that with the increase of the applied electric field, the value of Pmax displays a prominent enhancement from 1.822 to 18.512 μC cm−2, while the change in Pr remains very small (0.014–1.423 μC cm−2). Fig. 7c and d depicts a somewhat stable relationship among Wrec, η and the electric field, which meets the application requirements. The increase of Wrec may be attributed to the increase of Eb, as confirmed by the dielectric and the impedance spectra (Fig. 4 and 5). As expected, ultrahigh Wrec (5.01 J cm−3), Eb (627 kV cm−1) and η (86.1%) in the 0.22BMT ceramic are simultaneously achieved.
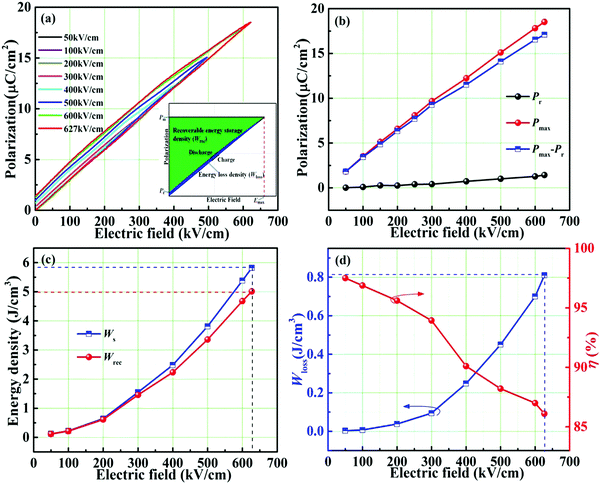 | ||
| Fig. 7 Unipolar P–E loops and energy storage properties of the 0.22BMT ceramic varied with different electric fields. | ||
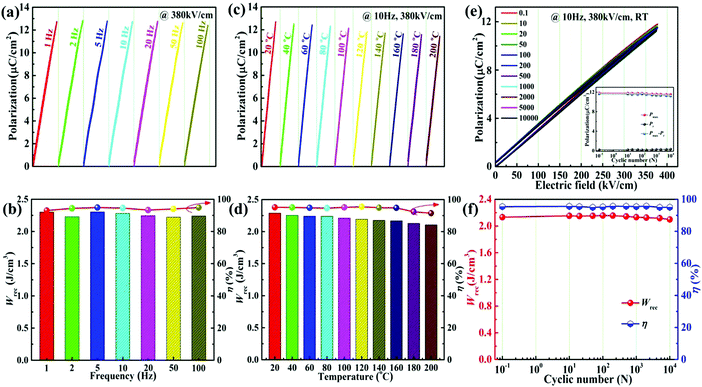
For practical applications, the stability of the frequency, temperature and fatigue is one of significant parameters for designing the energy storage capacitors. Fig. 8a demonstrates the unipolar P–E loops of the 0.22BMT ceramic from 1 to 100 Hz under 380 kV cm−1. Obviously, the very slender P–E loops illustrate that the 0.22BMT ceramic exhibits a typical linear-like relaxor ferroelectric characteristic over the wide frequency range. Fig. 8b shows that the values of Wrec range from 2.30 to 2.24 J cm−3 (i.e., a variation of Wrec < 3%) and all the corresponding η values remain above 93%. Furthermore, the stability of the frequency may be attributed to the compact microstructure of the ceramic. Fig. 8c displays the Wrec and η values as a function of different temperatures. In particular, the values of Wrec and η vary from 2.29 J cm−3 and 95.14% to 2.11 J cm−3 and 91.47% when the temperature increases from 20 °C to 200 °C, i.e., the variation is less than 8% and 4%, respectively (Fig. 8d). Moreover, the P–E loops always remain ultraslim, which may be owing to the lower Pr values in the temperature range of 20–200 °C. However, the P–E loops of the 0.22BMT ceramic change slightly with increasing temperatures, which may be due to the activation heat movement of carriers on oxygen vacancies (see Fig. S4, ESI†), leading to the rise of ionic conduction and leakage loss.23 Excellent antifatigue performance is another indispensable condition for the practical application of ceramic capacitors. Fig. 8e shows the fatigue cycles dependence of the P–E loops of the 0.22BMT ceramic. No notable change in the P–E loops in the range of 10−1–104 cycles was obtained. The values of Pmax and Pr values were stable at approximately 11.87 μC cm−2 and 0.30 μC cm−2 respectively (the inset of Fig. 8e). The dependence of the fatigue cycles on Wrec and η is shown in Fig. 8f. The ceramic exhibited excellent fatigue stability even after 104 fatigue cycles, with only a slight change in ΔWrec < 3% and Δη < 1%. All these factors are expected to increase the comprehensive energy storage properties.
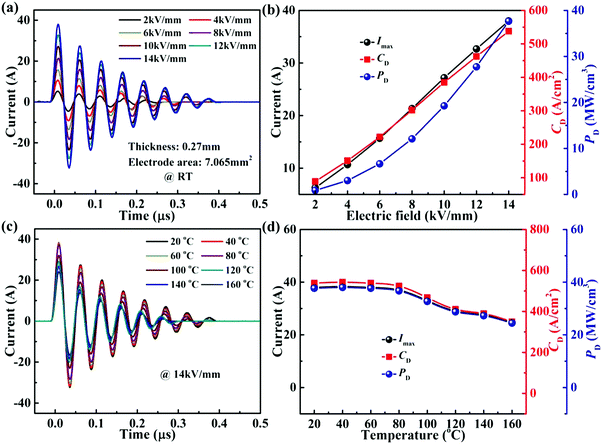
Fig. 9(a) presents the curves between the underdamped discharge electric current and time for 0.22BMT ceramics at room temperature and under the various values of E. Interestingly, the 0.22BMT ceramics exhibit the same discharging behaviours at different electric fields, and the first current peak increases linearly with the increase in the electric field strength. Fig. 9(b) displays the variation of current peak (Imax), current density (CD = Imax/S), and power density (PD = EImax/2S; S: electrode area) of as functions of the electric field. The Imax shows a significant increment (from 6.3 A to 38 A). Meanwhile, the corresponding CD and PD reached the top value of 537.9 A cm−2 and 37.7 MW cm−3 respectively at the maximum electric field of 14 kV mm−1. Fig. 9(c) exhibits the temperature dependence of the stored charge and energy release performances at a fixed electric field (14 kV mm−1). The stored charge is observed to be released more rapidly (≤0.4 μs) with the increasing temperature at various electric field strengths. The first Imax shows a slight decrement (from 38 A to 24.7 A) when the temperature rises from 20 °C to 160 °C. The thermal stability of 0.22BMT ceramics reaches a steady-state value from 20 to 100 °C, and when the temperature increases further, the values of CD and PD decrease from 467.1 A cm−2 and 32.7 MW cm−3 to 349.1 A cm−2 and 24.4 MW cm−3. The variations of Imax, CD, and PD are less than ±15% over 20–160 °C.
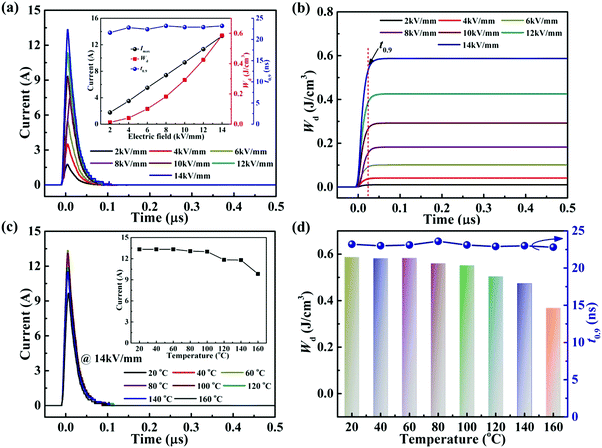
The time dependence of the discharged energy density (Wd) is calculated as:  ,26 where R is the load resistor, and V is sample volume. The t0.9 indicates the time needed to release 90% of the stored energy. The effect of the electric field on the pulsed-discharge performance of the 0.22BMT ceramics at a fixed load resistance of 202.5 Ω is given in Fig. 10a. The inset of Fig. 10a depicts the electric field dependence of t0.9, Imax, and Wd, which displays that the value of t0.9 remains stable and ultrafast time (∼23 ns) over a wide range of 2–14 kV mm−1. In addition, the Imax and Wd values depend on the electric field, increasing from 1.8 A and 0.012 J cm−3 at 2 kV mm−1 to 13.3 A and 0.587 J cm−3 at 14 kV mm−1. The overdamped discharge current waveforms of the 0.22BMT ceramics and the corresponding t0.9, Imax, and Wd in the temperature range of 20 °C to 160 °C at 14 kV mm−1 (as displayed in Fig. 10c and d). Remarkably, a temperature-induced t0.9 (∼23 ns, @ 14 kV mm−1) varying within less than 2% in the temperature range of 20–160 °C was found in the 0.22BMT ceramics. As a consequence, the charge–discharge properties (Wd ≥ 0.56 J cm−3, Imax ≥ 13 A, and t0.9 ≤ 23 ns) of the 0.22BMT ceramics from 20 °C to 100 °C under an electric field of 14 kV mm−1 are desirable for pulsed power capacitor applications. A comparison of the charge–discharge properties of many energy storage ceramics is summarized in Table S1 (ESI†). Although lead-based energy storage ceramics were reported to have an ultrahigh Wrec value, its t0.9 value is relatively low. Obviously, the 0.22BMT system possesses a very short and stable t0.9, which is superior to most bulk energy storage ceramics.
3. Conclusions
In summary, we constructed a local random field strategy to enhance the Wrec of lead-free ceramics. A novel 0.22BMT solid solution was rationally designed for achieving a large Pmax, and ultrahigh Wrec and η. As expected, an ultrahigh Wrec (∼5.01 J cm−3) and η (∼ 86.1%) were achieved in the 0.22BMT ceramics. Furthermore, with the increasing frequency (1–100 Hz) and temperature (20–200 °C), the energy storage properties of the 0.22BMT ceramic demonstrate its excellent thermal stability. In addition, the ceramic exhibited excellent fatigue stability even after 104 fatigue cycles, with only a slight change in ΔWrec < 3% and Δη < 1%. The 0.22BMT ceramic presents prominent charge–discharge performance with large CD (∼537.9 A cm−2), extremely high PD (∼37.7 MW cm−3), and ultrafast discharge rate (∼23 ns). This work provides a novel avenue for the design of high energy storage lead-free dielectric materials and broadens the applications field for NN-based ceramics.4. Experimental procedure
The experimental processes for xBMT ceramics are briefed in the supporting material.Conflicts of interest
There are no conflicts to declare.Acknowledgements
This work was supported by National Natural Science Foundation of China (No. 11664008 and 61761015), Natural Science Foundation of Guangxi (No. 2018GXNSFFA050001, 2017GXNSFDA198027 and 2017GXNSFFA198011).References
- L. Yang, X. Kong, F. Li, H. Hao, Z. Cheng, H. Liu, J. F. Li and S. Zhang, Prog. Mater. Sci., 2019, 102, 72–108 CrossRef CAS
.
- S. Kwon and W. Hackenberger, IEEE Electr. Insul. Mag., 2011, 27, 43–55 Search PubMed
.
- Z. Yao, Z. Song, H. Hao, Z. Yu, M. Cao, S. Zhang, M. T. Lanagan and H. Liu, Adv. Mater., 2017, 29, 1601727 CrossRef PubMed
.
- Z. Liu, T. Lu, J. Ye, G. Wang, X. Dong, R. Withers and Y. Liu, Adv. Mater. Sci. Technol., 2018, 3, 1800111 CrossRef
.
- O. Ellabban, H. Abu-Rub and F. Blaabjerg, Renewable Sustainable Energy Rev., 2014, 39, 748–764 CrossRef
.
- N. Luo, K. Han, F. Zhuo, L. Liu, X. Chen, B. Peng, X. Wang, Q. Feng and Y. Wei, J. Mater. Chem. C, 2019, 7, 4999–5008 RSC
.
- N. Wei, L. H. Yu, Z. T. Sun, Y. Z. Song, M. L. Wang, Z. N. Tian, Y. Xia, J. S. Cai, Y. Y. Li and L. Zhao,, ACS Nano, 2019, 13, 7517–7526 CrossRef CAS PubMed
.
- X. Chen, X. Li, H. Zhou, J. Sun, X. Li, X. Yan, C. Sun, J. Shi and F. Pang, J. Mater. Sci.: Mater. Electron., 2019, 30, 15912–15922 CrossRef CAS
.
- J. Yin, Y. Zhang, X. Lv and J. Wu, J. Mater. Chem. A, 2018, 6, 9823–9832 RSC
.
- Z. B. Pan, L. M. Yao, J. W. Zhai, K. Yang, B. Shen and H. T. Wang, ACS Sustainable Chem. Eng., 2017, 5, 4707–4717 CrossRef CAS
.
- Y. H. Huang, Y. J. Wu, W. J. Qiu, J. Li and X. M. Chen, J. Eur. Ceram. Soc., 2015, 35, 1469–1476 CrossRef CAS
.
- M. X. Zhou, R. H. Liang, Z. Y. Zhou and X. L. Dong, Inorg. Chem. Front., 2019, 6, 2148–2157 RSC
.
- N. Sun, Y. Li, Q. Zhang and X. Hao, J. Mater. Chem. C, 2018, 6, 40 Search PubMed
.
- K. Bi, M. H. Bi, Y. N. Hao, W. Luo, Z. M. Cai, X. H. Wang and Y. H. Huang, Nano Energy, 2018, 51, 513–523 CrossRef CAS
.
- Z. M. Dang, J. K. Yuan, S. H. Yao and R. J. Liao, Adv. Mater., 2013, 25, 6334–6365 CrossRef CAS PubMed
.
- X. Dong, H. Chen, M. Wei, K. Wu and J. Zhang, J. Alloys Compd., 2018, 744, 721–727 CrossRef CAS
.
- J. Gao, Y. Zhang, L. Zhao, K. Y. Lee, Q. Liu, A. Studer, M. Hinterstein, S. Zhang and J. F. Li, J. Mater. Chem. A, 2019, 7, 2225–2232 RSC
.
- M. Sharifzadeh Mirshekarloo, K. Yao and T. Sritharan, Appl. Phys. Lett., 2010, 97, 142902 CrossRef
.
- Y. Tian, L. Jin, H. Zhang, Z. Xu, X. Wei, G. Viola, I. Abrahams and H. Yan, J. Mater. Chem. A, 2017, 5, 17525–17531 RSC
.
- M. X. Zhou, R. H. Liang, Z. Y. Zhou, S. G. Yan and X. L. Dong, ACS Sustainable Chem. Eng., 2018, 6, 12755–12765 CrossRef CAS
.
- H. Qi and R. Zuo, J. Mater. Chem. A, 2019, 7, 3971–3978 RSC
.
- W. Wang, Y. P. Pu, X. Guo, R. K. Shi, Y. Shi, M. D. Yang, J. W. Li, X. Peng and Y. Li, J. Eur. Ceram. Soc., 2019, 39, 5236–5242 CrossRef CAS
.
- W. Wang, Y. P. Pu, X. Guo, T. Ouyang, Y. Shi, M. D. Yang, J. W. Li, R. K. Shi and G. Liu, Ceram. Int., 2019, 45, 14684–14690 CrossRef CAS
.
- Q. F. Zhang, Y. Dan, J. Chen, Y. M. Lu, T. Q. Yang, X. Yao and B. Y. He, Ceram. Int., 2017, 43, 11428–11432 CrossRef CAS
.
- K. Han, N. N. Luo, S. F. Mao, F. P. Zhuo, L. J. Liu, B. L. Peng, X. Y. Chen, C. Z. Hu, H. F. Zhou and Y. Z. Wei, J. Mater. Chem. A, 2019, 7, 26293–26301 RSC
.
- X. Li, X. Chen, J. Sun, M. X. Zhou and H. F. Zhou, Ceram. Int., 2020, 46, 3426–3432 CrossRef CAS
.
- X. L. Chen, X. Li, J. Sun, C. C. Sun, J. P. Shi, F. H. Pang and H. F. Zhou, Ceram. Int., 2020, 46, 2764–2771 CrossRef CAS
.
- Y. Z. Fan, Z. Y. Zhou, R. H. Liang and X. L. Dong, J. Eur. Ceram. Soc., 2019, 39, 4770–4777 CrossRef CAS
.
- M. Zhou, R. Liang, Z. Zhou and X. Dong, J. Mater. Chem. C, 2018, 6, 8528–8537 RSC
.
- W. B. Li, D. Zhou, L. X. Pang, R. Xu and H. H. Guo, J. Mater. Chem. A, 2017, 5, 19607–19612 RSC
.
- Q. Yuan, G. Li, F. Z. Yao, S. D. Cheng, Y. Wang, R. Ma, S. B. Mi, M. Gu, K. Wang, J. F. Li and H. Wang, Nano Energy, 2018, 52, 203–210 CrossRef CAS
.
- E. K. Abdel-Khalek, I. Ibrahim, T. M. Salama, A. M. Elseman and M. M. Mohamed, J. Magn. Magn. Mater., 2018, 465, 309–315 CrossRef CAS
.
- Y. Lin, D. Li, M. Mang, S. L. Zhan, Y. D. Yang, H. B. Yang and Q. B. Yuan, ACS Appl. Mater. Interfaces, 2019, 11, 36824–36830 CrossRef CAS PubMed
.
- G. C. Liu, H. Q. Fan, J. Xu, Z. Y. Liu and Y. W. Zhao, RSC Adv., 2016, 6, 48708–48714 RSC
.
- M. Zhou, R. Liang, Z. Zhou and X. Dong, J. Mater. Chem. C, 2018, 6, 8528–8537 RSC
.
- J. P. Shi, Y. J. Yu, X. L. Chen, G. F. Liu, X. Y. Jiang, J. L. Liang, J. J. Ling, M. Z. Xu and H. F. Zhou, Appl. Phys. A: Mater. Sci. Process., 2019, 125, 608 CrossRef
.
-
(a) Q. Yuan, G. Li, F.-Z. Yao, S.-D. Cheng, Y. Wang, R. Ma, S.-B. Mi, M. Gu, K. Wang, J. F. Li and H. Wang, Nano Energy, 2018, 52, 203–210 CrossRef CAS
; (b) Z. Yang, F. Gao, H. Du, L. Jin, L. Yan, Q. Hu, Y. Yu, S. Qu, X. Wei, Z. Xu and Y. J. Wang, Nano Energy, 2019, 58, 768–777 CrossRef CAS
.
- Z. T. Yang, H. L. Du, S. B. Qu, Y. D. Hou, H. Ma, J. F. Wang, J. Wang, X. Y. Wei and Z. Xu, J. Mater. Chem. A, 2016, 4, 13778–13785 RSC
.
- H. Qi and R. Zuo, J. Mater. Chem. A, 2019, 7, 3971–3978 RSC
.
- X. Chen, J. Chen, D. Ma, L. Fang and H. Zhou, Ceram. Int., 2015, 41, 2081–2088 CrossRef CAS
.
- X. Chen, X. Li, H. Zhou, J. Sun, X. Li, X. Yan, C. Sun and J. Shi, J. Adv. Ceram., 2019, 8, 427–437 CrossRef CAS
.
- X. Chen, X. Li, X. Yan, G. Liu and H. Zhou, J. Electron. Mater., 2018, 47, 2576–2583 CrossRef CAS
.
- J. Chen, X. Chen, F. He, Y. Wang, H. Zhou and L. Fang, J. Electron. Mater., 2014, 43, 1112–1118 CrossRef CAS
.
- M. Zhou, R. Liang, Z. Zhou and X. Dong, Ceram. Int., 2019, 45, 3582–3590 CrossRef CAS
.
- L. Zhang, Y. Pu and M. Chen, J. Alloys Compd., 2019, 775, 342–347 CrossRef CAS
.
- Y. Yang, H. Wang, L. Bi, Q. Zheng, G. Fan, W. Jie and D. Lin, J. Eur. Ceram. Soc., 2019, 39, 3051–3056 CrossRef CAS
.
- J. Wu, A. Mahajan, L. Riekehr, H. Zhang, B. Yang, N. Meng, Z. Zhang and H. Yan, Nano Energy, 2018, 50, 723–732 CrossRef CAS
.
- Y. Wu, Y. Fan, N. Liu, P. Peng, M. Zhou, S. Yan, F. Cao, X. Dong and G. Wang, J. Mater. Chem. C, 2019, 7, 6222–6230 RSC
.
- T. Shao, H. Du, H. Ma, S. Qu, J. Wang, J. Wang, X. Wei and Z. Xu, J. Mater. Chem. A, 2017, 5, 554–563 RSC
.
- B. Y. Qu, H. L. Du and Z. T. Yang, J. Mater. Chem. C, 2016, 4, 1795–1803 RSC
.
- X. L. Gao, Y. Li, J. W. Chen, C. Yuan, M. Zeng, A. H. Zhang, X. S. Gao, X. B. Lu, Q. L. Li and J. M. Liu, J. Eur. Ceram. Soc., 2019, 39, 2331–2338 CrossRef CAS
.
- D. Wang, Z. Fan, W. Li, D. Zhou, A. Feteira, G. Wang, S. Murakami, S. Sun, Q. Zhao, X. Tan and I. M. Reaney, ACS Appl. Energy Mater., 2018, 1, 4403–4412 CrossRef CAS
.
- D. G. Zheng and R. Z. Zuo, J. Eur. Ceram. Soc., 2017, 37, 413–418 CrossRef CAS
.
- H. G. Yang, H. Qi and R. Z. Zuo, J. Eur. Ceram. Soc., 2019, 39, 2673–2679 CrossRef CAS
.
- L. Zhao, J. Gao, Q. Liu, S. Zhang and J. F. Li, ACS Appl. Mater. Interfaces, 2018, 10, 819–826 CrossRef CAS PubMed
.
- L. Zhao, Q. Liu, S. Zhang and J. F. Li, J. Mater. Chem. C, 2016, 4, 8380–8384 RSC
.
- J. Ye, G. Wang, M. Zhou, N. Liu, X. Chen, S. Li, F. Cao and X. Dong, J. Mater. Chem. C, 2019, 7, 5639–5645 RSC
.
- M. X. Zhou, R. H. Liang, Z. Y. Zhou and X. L. Dong, J. Mater. Chem. A, 2018, 6, 17896–17904 RSC
.
- Z. Yang, H. Du, L. Jin, Q. Hu, S. Qu, Z. Yang, Y. Yu, X. Wei and Z. Xu, J. Eur. Ceram. Soc., 2019, 39, 2899–2907 CrossRef CAS
.
Footnote |
| † Electronic supplementary information (ESI) available. See DOI: 10.1039/c9tc06711f |
| This journal is © The Royal Society of Chemistry 2020 |

