 Open Access Article
Luminescence and luminescence quenching of K2Bi(PO4)(MoO4):Sm3+ phosphors for horticultural and general lighting applications†
Julija
Grigorjevaite
a,
Egle
Ezerskyte
a,
Juraj
Páterek
 b,
Sebastien
Saitzek
 c,
Akvilė
Zabiliūtė-Karaliūnė
d,
Pranciškus
Vitta
d,
David
Enseling
e,
Thomas
Jüstel
 e and
Arturas
Katelnikovas
 *a
*a
aInstitute of Chemistry, Faculty of Chemistry and Geosciences, Vilnius University, Naugarduko 24, LT-03225 Vilnius, Lithuania. E-mail: arturas.katelnikovas@chf.vu.lt
bDepartment of Optical Materials, Institute of Physics of the Czech Academy of Sciences, Cukrovarnická 10/112, 162 00 Praha 6, Czech Republic
cUniv. Artois, CNRS, Centrale Lille, Univ. Lille, UMR 8181 – UCCS – Unité de Catalyse et Chimie du Solide, F-62300 Lens, France
dFaculty of Physics, Institute of Photonics and Nanotechnology, Vilnius University, Saulėtekio al 3, LT-10257 Vilnius, Lithuania
eDepartment of Chemical Engineering, Münster University of Applied Sciences, Stegerwaldstr. 39, D-48565 Steinfurt, Germany
First published on 22nd July 2020
Abstract
The purpose of this study is to investigate the optical properties of Sm3+ doped K2Bi(PO4)(MoO4) phosphors as possible candidates for application in light emitting diodes (LEDs) for horticultural and general lighting applications. Sm3+ doped phosphors with 0.5%, 1%, 2.5%, 5%, 10%, 25%, 50%, 75% and 100% Sm3+ have been prepared by solid state reaction method. The synthesized materials were investigated by X-ray diffraction (XRD) and scanning electron microscopy (SEM). The room temperature (RT) reflection, excitation, and emission spectra, photoluminescence (PL) decay curves, as well as temperature dependent emission and excitation spectra and PL decay curves were measured and discussed. Moreover, quantum efficiencies, and lumen equivalents (LE) were determined and discussed. The prepared K2Bi(PO4)(MoO4):Sm3+ phosphor samples show moderate quantum efficiency, high colour purity, and a high quenching temperature. These properties are required for phosphors if they are under consideration for application in LEDs and other areas. It was also shown, that the PL emission of the phosphor well matches the absorption of the main plant pigments thus making it a good candidate for horticultural lighting applications. Using this phosphor and a near-UV LED a phosphor-converted LED (pcLED) prototype, meeting the photophysiological needs of plants, was designed. Supplementing the prototype with a green or lime LED the colour rendering index and luminous efficacy of radiation of the prototype is greatly increased thus making it more efficient and pleasant for people present at the greenhouse.
1. Introduction
The discovery of efficient blue light emitting (In,Ga)N diode by S. Nakamura in 19911 started the era of solid state lighting (SSL). The blue light emitting (In,Ga)N chip usually is combined with the YAG:Ce (Y3Al5O12:Ce3+) phosphor emitting in yellow spectral range and such device yields bluish white light due to lack of intensity in the red spectral region. It is considered that for household applications the white LEDs should emit warm-white light (colour temperature between 2700 and 3000 K) which resembles the incandescent light sources.2 To increase the fraction of red light, usually Eu2+ activated nitride phosphors such as (Ba,Sr,Ca)2Si5N8:Eu2+ or more commonly (Sr,Ca)AlSiN3:Eu2+ are added.3 However, synthesis of these nitride phosphors requires advanced techniques (protective atmosphere, high synthesis temperature, reducing atmosphere, etc.). Besides, Eu2+ ions in these nitride matrices emit broad spectra, which extends to the deep red spectral region where the human eye is very insensitive. Thus, a large part of emission energy is wasted and the luminous efficacy of such light sources decreases. According to Zukauskas et al.4 the ideal red-emitting phosphor should possess a peak emission around 655 nm with FWHM < 30 nm in order to obtain light sources with 3500 K colour temperature and high colour rendering index.With constant development of (In,Ga)N semiconductor chips the near-UV emitting LEDs become more and more efficient.5 This has opened an alternative way to produce white light, i.e. combination of near-UV emitting LED with a blend of blue, green and red emitting phosphors. There are many more phosphors that can be excited by the near-UV radiation if compared to the blue light. Therefore, this approach is somewhat advantageous. Besides, the efficient blue-emitting (BaMgAl10O17:Eu2+)6 and green-emitting ((Ba,Sr)2SiO4:Eu2+ and (Ba,Sr,Ca)Si2O2N2:Eu2+)7,8 phosphors already exist and are well developed. Therefore, the remaining issue is finding the efficient, thermally stable and low cost red emitting phosphor. Eu3+ and Mn4+ doped phosphors fulfill these requirements and are receiving lots of attention.9,10 However, Sm3+ doped inorganic phosphors are an interesting alternative to Eu3+ and Mn4+ ions since they exhibit a strong emission at around 650 nm and can be excited with near-UV radiation. On the other hand, Sm3+ ions usually possess low absorption strength due to spin and parity forbidden character of their intraconfigurational [Xe]4f5 → [Xe]4f5 transitions.11,12 Some host matrixes such as molybdates, tungstates, vanadates are known to increase the absorption strength of rare earth ions due to overlapping of their low lying charge transfer (CT) band13 with 4f levels of Sm3+ ions. Furthermore, the rare earth doped phosphors based on these host matrices gain lots of attention for application in lasers,14 up-converters,15 security pigments,16etc.
One of the feasible applications of Sm3+ doped ions are phosphor-converted LEDs (pcLEDs) for greenhouse lighting. The growing human population and limited natural resources require a different attitude towards the crop growth such as, e.g., vertical farming. By applying hydroponics, aeroponics and being designed within skyscrapers, vertical farms can save land, water, and energy.17 However, due to the vertical structure and the closed environment such farms require artificial lighting. Up to date, the most widely used luminaires for greenhouse lighting are high pressure sodium (HPS) lamps.18 However, LEDs are promising light sources and were shown to be superior in terms of luminous efficiency, electricity usage, and life span if compared to HPS and compact fluorescent (CF) lamps.19 The pcLEDs, containing far-red Cr3+ doped gallium garnet, as well as Bi3+ doped near-UV and Mn4+ doped far-red Ca3Al4ZnO10, La(MgTi)1/2O3:Mn4+, Ba3GdNa(PO4)F:Eu2+ and Ba3CaK(PO4)3:Eu2+,Mn2+ phosphors, have already been proposed for horticultural applications.20–24 The reason Sm3+ doped phosphor are so attractive for the greenhouse lighting is the fact that they exhibit PL in spectral regions matching the absorption of plant pigments such as chlorophylls a and b as well as phytochrome red (Pr), and far-red (Pfr) residing in the deep-blue (400–460 nm), red (600–680 nm), and far-red (700–740 nm) spectral regions.25 Another important feature of Sm3+ doped phosphors is the aforementioned band in the deep-red region (around 650 nm), which increases the colour rendition properties. For this reason, the pcLED containing K2Bi(PO4)(MoO4):Sm3+ phosphor could be used for both: horticultural and general lighting. This is of particular importance in situations when the farm staff or botanical garden visitors are present at the greenhouse, as this kind of pcLED supplemented with a green spectral component could yield significantly higher colour rendering index (Ra) and LE values than common greenhouse lighting.
In this work, we investigated phosphors according to the composition K2Bi(PO4)(MoO4):Sm3+ as potential candidates for near-UV LEDs. The synthesized phosphors possessed excellent colour saturation, high LE values, and moderate quantum yields. These materials also possessed high thermal quenching temperatures which is a huge benefit for practical application in pcLED for horticultural and general lighting.
2. Experimental
Herewith described K2Bi(PO4)(MoO4):Sm3+ (where Sm3+ concentration is 0.5%, 1%, 2.5%, 5%, 10%, 25%, 50%, 75% and 100%) phosphors were synthesized by high temperature solid-state reaction technique. The starting materials K2CO3 (99+% Acros Organics), Bi2O3 (99.9% Acros Organics), Sm2O3 (99.99% Tailorlux), MoO3 (99+% Acros Organics), and NH4H2PO4 (99% Reachem Slovakia) were weighed in stoichiometric proportions and thoroughly blended in an agate mortar with some acetone. The blend of starting materials was transferred to a porcelain crucible capped with the lid and then annealed at 600 °C for 10 h in air three times. The resulting powder was reground after each annealing. Before the synthesis Sm2O3 was annealed at 900 °C for 2 h in air, whereas K2CO3 was dried at 170 °C for 5 h in air to remove absorbed moisture and CO2.The phase purity of the synthesized phosphors powders was checked by XRD. The XRD patterns were recorded from 5° ≤ 2θ ≤ 80° using Ni-filtered Cu Kα radiation on a Rigaku MiniFlexII diffractometer working in Bragg–Brentano focusing geometry. The scanning speed and step width and was 5° min−1 and 0.02°, respectively.
For the Rietveld refinement, XRD measurements were performed using the Ultima IV – Rigaku diffractometer working in Bragg–Brentano focusing geometry. The XRD patterns were collected by scanning at intervals of 0.01° in the 2θ range from 5° to 100° (integration time 5 s) using Cu Kα radiation (1.5406 Å). The Rietveld refinement technique was used to analyse the XRD data assuming that K2Bi(PO4)(MoO4):Sm3+ has an orthorhombic structure with Ibca (#73) space group. Indeed, the structures of K2Bi(PO4)(MoO4)26 and K2Sm(PO4)(MoO4)27 have already been solved and both present an isostructural form with same Ibca space group. The FullProf Suite program was28 applied to refine the structural model and the peak profiles were calculated using the Thompson-Cox Hastings pseudo-Voigt function.29
Bruker ALPHA ATR spectrometer (with 4 cm−1 resolution) was used to record the infrared spectra of the prepared materials within the 3000–400 cm−1 range.
FE-SEM Hitachi SU-70 scanning electron microscope was used to take SEM images of prepared phosphor powders.
RT reflection spectra, as well as RT and temperature dependent (77–500 K) excitation and emission spectra, and PL decay curves were recorded on an Edinburgh Instruments FLS980 spectrometer. The detailed description of the employed experimental setup is given in our previous publication.30
The external quantum efficiencies (EQE) were determined by an integrating sphere method. The entire experiment can be summarized by the following equation:30
 | (1) |
 and
and  are integrated emission intensities of the phosphor sample and Teflon, respectively.
  and
and  are the integrated reflectance of the phosphor sample and Teflon, respectively. Nem is the number of emitted photons and Nabs is the number of absorbed photons. The EQE for each sample was measured three times to collect some statistical data.
The pcLED prototype was made of a commercial green (LUMILEDS, 530 nm), lime (LUMILEDS, 540 nm peak wavelength), and near-UV (Kingbright KTDS-3534UV405B, 405 nm peak wavelength) LEDs as well as a remote silicone-phosphor converter. The near-UV LED was soldered to a custom-made PCB board with an attached white polyvinyl chloride foam (Simopor, SIMONA) cone shaped collimator. Six remote light converters were made by mixing different concentrations (20 and 30 wt%) of the K2Bi(PO4)(MoO4):5%Sm3+ phosphor powder with transparent silicone (Dowsil™). The mixture was shaped within disk shaped poly(methyl methacrylate) moulds of different thickness (1, 2, and 3 mm). Afterwards, different phosphor converters were used to cover the collimator in order to attain the desired pcLED spectral power distribution (SPD). For the final prototype the 3 mm converter with 30 wt% phosphor concentration was used, so as to obtain SPDs with a CCT value close to 3000 K. The additional lime and green LEDs were mounted on a separate PCB board and were used to increase the colour quality of the resulting SPD.
All measurements were performed at room temperature and ambient pressure in air unless specified otherwise.
3. Results and discussion
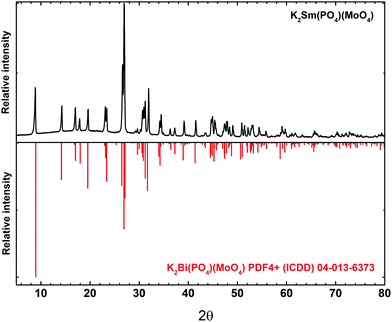
The K2Bi(PO4)(MoO4) host matrix adopts an orthorhombic crystal structure with the Ibca (#73) space group.26 The structure is constructed by PO4 and MoO4 tetrahedra, and K+ and Bi3+ polyhedrons. Both, Bi3+ and K+, ions are eightfold-coordinated. The phase purity of all the synthesized samples was investigated by recording powder XRD patterns. The XRD pattern of K2Sm(PO4)(MoO4) is shown in Fig. 1. The pattern of the synthesized sample is in good agreement with the reference pattern of K2Bi(PO4)(MoO4) (PDF4+ (ICDD) 04-013-6373). Due to the similar ionic radius and the same charge it is expected that Sm3+ ions occupy Bi3+ sites. As expected, the position of reflexes slightly shifted towards higher 2θ values if Bi3+ ions were replaced by smaller Sm3+ ions (see Fig. S1, ESI†). All of the synthesized K2Bi(PO4)(MoO4):Sm3+ phosphors were single phase compounds regardless the Sm3+ concentration (see Fig. S2, ESI†). XRD patterns show that a solid solution forms at any Bi3+/Sm3+ ratio which is in line with Vegard's law.31 This law predicts that a complete solid solution can be obtained if the difference of cations size is less than 15%. In the present case, this condition in respected because the ionic radii of cations are 1.17 Å and 1.079 Å for VIIIBi3+ and VIIISm3+, respectively.32The morphological features of K2Bi(PO4)(MoO4):Sm3+ powders were investigated by taking SEM images. The SEM images under different magnification of K2Bi(PO4)(MoO4):50%Sm3+ sample are given in Fig. 2. The powder particles consist of smaller crystallites possessing a rod-like shape. Another interesting feature is that there are very little or even no dust particles on top of the larger particles. This indicated the high quality of the prepared powders, because no washing of the obtained samples was performed. Moreover, no difference in particle morphology or size was observed with varying the Sm3+ content.
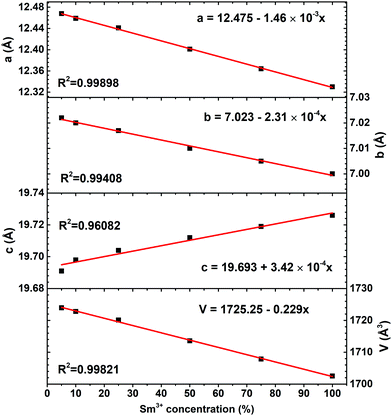
Rietveld refinement was performed in order to evaluate to which extent the Sm3+ substitution for Bi3+ influences the lattice parameters. Rietveld refinement of K2Sm(PO4)(MoO4) powder XRD pattern is shown in Fig. S3 (ESI†). It is obvious, that measured and calculated patterns match very well. The calculated lattice parameters a, b, c, and V as a function of Sm3+ concentration are given in Fig. 3. The increasing samarium concentration results in a linear (R2 > 0.994) decrease of lattice parameters a, b, and V. However, the lattice parameter c increase with increasing Sm3+ concentration. These results demonstrate that the K2Bi(PO4)(MoO4) unit cell lengthens along c-axis when Bi3+ is substituted by Sm3+ ions. This is also supported by the shift of the respective reflexes in the XRD patterns of K2Bi(PO4)(MoO4):Sm3+ phosphors, which are shown in Fig. S1 (ESI†). Furthermore, the calculated unit cell parameters of K2Bi(PO4)(MoO4) doped with Sm3+ are tabulated in Table S1 (ESI†). Even though some changes in lattice parameters were observed, the overall decrease/increase of lattice parameters is small: Δa, Δb, Δc, and ΔV being 1.12%, 0.30%, 0.18%, and 1.24%, respectively. The bismuth ions are in a (a, b) plane of the structure. Replacing it with a smaller samarium ion implies that the a and b parameters decrease, as observed.
The IR spectra of an undoped K2Bi(PO4)(MoO4) sample and samples doped with 25%, 50%, 75% and 100% Sm3+ are shown in Fig. S4 (ESI†). All IR spectra consist of several absorption bands in the range of 400–1100 cm−1. The three sharp absorption bands at 650–450 cm−1 are attributed to the PO4 bending vibrations. The strong absorption band at 900–700 cm−1 are due to Mo–O stretching vibrations in MoO4 tetrahedrons, whereas strong absorption bands at 935 and 1045 cm−1 can be ascribed to symmetric and asymmetric vibrations of PO4 tetrahedrons, respectively.26 It is also interesting note that there are some significant changes in IR spectra when Bi3+ ions are replaced by Sm3+ ions. For instance, the absorption band at 1045 cm−1 shifts to 1075 cm−1 if Bi3+ ions are fully replaced by Sm3+ ions. Similar shift to higher energies was observed for bands at 520, 555, and 585 cm−1 (in Bi-compound) which moved to 530, 570, and 615 cm−1, respectively (in Sm-compound). Moreover, the absorption band at 935 cm−1 shifts to 960 cm−1 if Bi3+ are fully replaced by Sm3+. When 25% Sm3+ are introduced into the host lattice an additional weak absorption band at 960 cm−1 appears (see Fig. S4b, ESI†). With further increase of Sm3+ concentration, the intensity of absorption band at 960 cm−1 increased, whereas the intensity of absorption band at 935 cm−1 decreased and finally vanished in Sm compound. The parallel case was observed for the absorption bands at 780 and 725 cm−1 (in Bi-compound). The intensity of the former one gradually increased with increasing Sm3+. Contrary, the intensity of the latter one decreased with increasing Sm3+ concentration and completely disappeared in fully Sm3+ substituted compound. This leads to a conclusion that the energy of PO4 and MoO4 vibrations increases if heavier Bi3+ ions are replaced by the lighter Sm3+ ions. Similar behaviour of IR spectra were also observed in other isostructural compounds.5,30
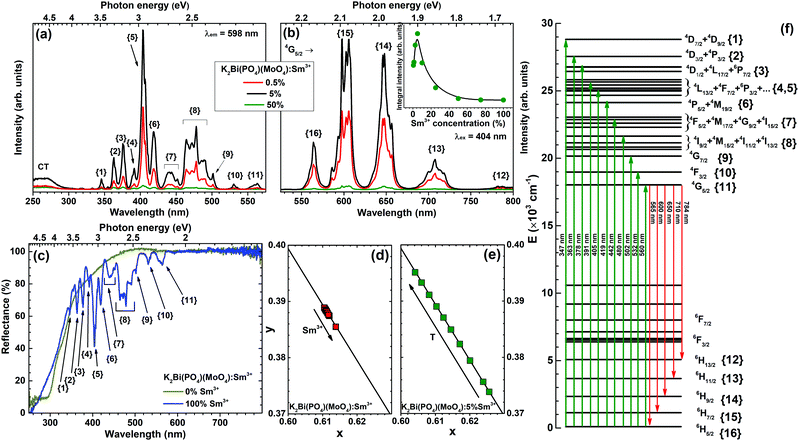
The excitation spectra of K2Bi(PO4)(MoO4) doped with 0.5%, 5% and 50% Sm3+ were measured by monitoring emission at 598 nm and are given in Fig. 4(a). All spectra contain a broad band in the range of 250–300 nm. This band can be attributed to the CT transition from oxygen to samarium. There are typical sets of excitation lines of Sm3+ transitions in the range of 300–570 nm, corresponding to the transition within the [Xe]4f5 configuration from ground level 6H5/2 to the higher energy levels of Sm3+ ion: 363 nm (4D3/2 + 4P3/2), 378 nm (4D1/2 + 4L17/2 + 6P7/2), 390–405 nm (4L13/2 + 4F7/2 + 6P3/2 + 6K11/2 + 4M21/2 + 4L15/2), 480 nm (4I9/2 + 4M15/2 + 4I11/2 + 4I13/2).33 The schematic representation of observed Sm3+ optical transitions in reflection, excitation, and emission spectra are given in Fig. 4(f) for better visualization.
The body colour of undoped K2Bi(PO4)(MoO4) was yellowish and this is in line with the reflection spectrum shown in Fig. 4(c). The yellowish body colour originates from the slight absorption in the range of 360–480 nm by the undoped sample. The absorption in the UV range is caused by an O2− → Mo6+ charge transfer related to the host matrix. The body colour of K2Sm(PO4)(MoO4), in turn, was even more yellowish, due to rather strong absorption of Sm3+ ions in the blue and near-UV spectral region. All these absorption lines originate from 6H5/2 ground state level to the excited levels of Sm3+ ions. Moreover, these absorption lines match well with the ones observed in excitation spectra, which clearly shows that K2Bi(PO4)(MoO4):Sm3+ phosphors can be efficiently excited in the blue and near-UV spectral region, where the strongest emission of the most efficient LED chips is observed. The reflectance at longer (600–800 nm) wavelengths for both undoped and fully Sm3+ substituted compounds is close to unity, which shows a high brilliance of the samples. In order to calculate the optical band gap of synthesized compounds, a Tauc plot was derived from the reflection spectra by employing the Kubelka–Munk function.34 It turned out that the optical band gap is similar regardless of the Sm3+ concentration and was 327 nm (3.79 eV) and 313 nm (3.97 eV) for the undoped and completely Sm3+ substituted compound, respectively.
There are five main groups of emission peaks of Sm3+ in emission spectra (λex = 404 nm) of K2Bi(PO4)(MoO4):Sm3+ (Fig. 4(b)). All these lines originate from transitions from 4G5/2 level to: 6H5/2 (ca. 565 nm), 6H7/2 (ca. 600 nm), 6H9/2 (ca. 650 nm), 6H11/2 (ca. 710 nm), and 6H13/2 (ca. 784 nm) states of the Sm3+ ion, respectively. The emission lines for these transitions are very broad and resemble bands rather than sharp lines. This is due to electron–phonon interaction, that causes line broadening, therefore, the lines are not well resolved at room temperature. This is not, however, the case in emission spectra recorded at 77 K temperature as shown in Fig. 5(b). This fine splitting of the single transition to several components is caused by the crystal field generated by O2− ligands acting on the Sm3+ central ion. Since Sm3+ ions possess half-integer spin, each 2S+1LJ multiplet is split up into J + 1/2 Stark sublevels.33,35 Additionally, the inset in Fig. 4(b) demonstrates that the emission intensity achieved its maximum value for the sample doped with 5% Sm3+. When the Sm3+ concentration is higher than 5%, the emission intensity decreases. It is well-known that a cross-relaxation processes between two adjacent Sm3+ ions are responsible for the quenching.36 Several transitions of one Sm3+ ion can resonate with transitions of another Sm3+ ion in close proximity leading to the non-radiative decay to the ground state of both ions. These transitions can be written as:
| 4G5/2 + 6H5/2 → 6F11/2 + 6F5/2 |
| 4G5/2 + 6H5/2 → 6F9/2 + 6F9/2 |
| 4G5/2 + 6H5/2 → 6F7/2 + 6F11/2 |
| Sm3+ (D) | Sm3+ (A) | ||
|---|---|---|---|
| Transition | ΔE (cm−1) | Transition | ΔE (cm−1) |
| 4G5/2 → 6F11/2 | 7450 | 6H5/2 → 6F5/2 | 7050 |
| 4G5/2 → 6F9/2 | 8850 | 6H5/2 → 6F9/2 | 9090 |
| 4G5/2 → 6F7/2 | 10![[thin space (1/6-em)]](https://www.rsc.org/images/entities/char_2009.gif) 020 020 |
6H5/2 → 6F11/2 | 10![[thin space (1/6-em)]](https://www.rsc.org/images/entities/char_2009.gif) 480 480 |
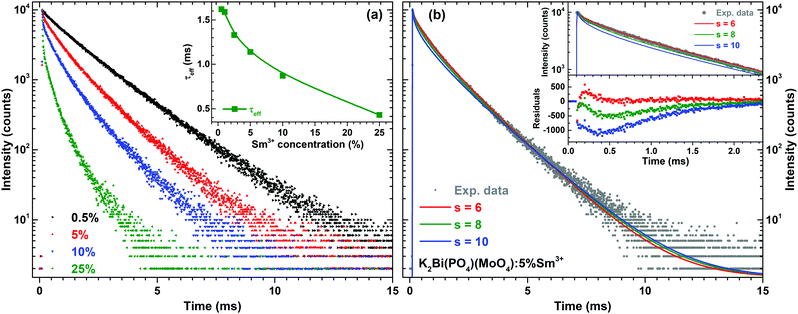
The PL decay curves for 4G5/2 → 6H7/2 transition (598 nm) of K2Bi(PO4)(MoO4):Sm3+ specimens with different Sm3+ concentrations are depicted in Fig. 6(a). In order to calculate the effective PL lifetime values, the following equation has been used:38
 | (2) |
In order to understand the interaction between Sm3+ ions, the Inokuti–Hirayama (IH) model of PL decay kinetics was applied to decay curves measured on a series of K2Bi(PO4)(MoO4):Sm3+ powder phosphors. The PL decay curves were fitted with a function defined by the IH model:40
 | (3) |
 . Concerning these criteria, fits obtained for s = 8 repeatedly showed slightly better results. However, the differences between fits are too small and none of the types of interaction can be objectively distinguished as the dominant one. All types of interaction between Sm3+ ions are reported also in literature – dd,41 dq,42 and qq43 – and in some cases migration of the excitation energy among Sm3+ ions was reported too. To examine the presence of migration in our system the generalized Yokota–Tanimoto model44 was employed. This model extends the IH function40 for the temporal evolution of decay kinetics by terms describing the migration of excitation energy. Hence, if migration among Sm3+ ions was present in our system, a better agreement to experimental data than that obtained by the IH model would be found. No such results were observed. Therefore, it is supposed that migration does not occur in the examined range of Sm3+ concentration in K2Bi(PO4)(MoO4):Sm3+.
The Sm3+ concentration dependent colour points of K2Bi(PO4)(MoO4):Sm3+ samples were calculated from the room temperature emission spectra and are given in Fig. 4(d). All colour points are located directly on the edge of CIE 1931 colour space diagram which demonstrates an excellent colour purity. The colour points slightly shift downwards along the edge of the CIE 1931 colour space diagram upon increasing the Sm3+ concentration. This shift of colour points can be attributed to the self-absorption of the 4G5/2 → 6H5/2 luminescent band. The increase of Sm3+ concentration leads to stronger self-absorption, thus the relative intensity of 4G5/2 → 6H5/2 emission decrease resulting in stronger relative intensity in orange and red spectral regions. The exact calculated colour coordinates in both CIE 1931 and CIE 1976 format are given in Table S2 (ESI†) together with lumen equivalent values LE (lm Wopt−1). The calculated LE values are relatively insensitive to the change of the Sm3+ concentration and are around 270 lm Wopt−1. This value surpasses or is at least very close to that of other orange to red emitting commercial or in scientific literature reported phosphors, such as Sr2Si5N8:Eu2+ (λem = 620 nm, LE = 240 lm Wopt−1), CaAlSiN3:Eu2+ (λem = 650 nm, LE = 150 lm Wopt−1), CaS:Eu2+ (λem = 650 nm, LE = 85 lm Wopt−1),45 K2Bi(PO4)(MoO4):Eu3+, (λem = 615 nm, LE = 200 lm Wopt−1),5 Li3Ba2La3(MoO4)8:Sm3+ (λem = 645 nm, LE = 212 lm Wopt−1),46 Li3Ba2La3(MoO4)8:Eu3+, (λem = 615 nm, LE = 312 lm Wopt−1),4 Y2Mo4O15:75%Eu3+ (λem = 613 nm, LE = 242 lm Wopt−1),47 or Eu2Mo4O15 (λem = 618 nm, LE = 208 lm Wopt−1).13
Another important feature of the phosphors for practical application is colour coordinate stability at high temperatures. The colour coordinates in the CIE 1931 and CIE 1976 colour space diagrams of 5% Sm3+ doped sample as a function of temperature are tabulated in Table S5 (ESI†). The graphical representation of the change in CIE 1931 coordinates of K2Bi(PO4)(MoO4):5%Sm3+ sample as a function temperature is shown in Fig. 4(e). The colour coordinates remain on the edge of CIE 1931 colour space diagram in the temperature range of 77–500 K. This shows that emission does not lose the colour purity in this temperature range. Besides, the colour coordinates shift to the orange region with increasing temperature. This finding is attributed to the emission line broadening at elevated temperatures. Calculation of colour coordinates involves the photopic human eye sensitivity curve with the maximum at ca. 555 nm (matches 4G5/2 → 6H5/2 emission). The human eye is also very sensitive to the orange light (4G5/2 → 6H7/2 transition at ca. 600 nm). The sensitivity of the human eye for the deep red colour, however, is very low. Therefore, the line broadening at this spectral region has very little impact on colour coordinate. In this sense, the emission line broadening in green and orange spectral regions will impact the colour coordinate more significantly. This is exactly what was observed for our samples. Moreover, this shift is close to linearity, which enables these materials to eventually work as a luminescent temperature sensor.
Temperature-dependent emission spectra in the range from 77 to 500 K for the 5% Sm3+ sample were recorded and are presented in Fig. 5(a). At 77 K temperature the emission spectrum is well resolved and the sharp lines from Stark components are visible. At a temperature of 500 K the peaks are so much broadened that they are not distinguishable anymore. The emission intensity decreases at elevated temperatures, the phenomenon is known as thermal quenching. The thermal quenching TQ1/2 value (temperature at which the phosphor loses half of its efficiency) and thermal quenching activation energy (EA) can be determined from the temperature dependent integrated emission spectra employing a Fermi–Dirac model.48–50
 | (4) |
 | (5) |
The temperature dependent PL decay curves of the sample with 5% Sm3+ were recorded in order to understand the thermal quenching process. The temperature dependent decay curves are depicted in Fig. S5 (ESI†). It is clear that the temperature has not a significant effect on the decay curves shape; therefore, the PL decay curves recorded at 77 and 500 K are only shown. From every temperature dependent PL decay curve, the effective PL lifetime values were calculated and are given in Fig. 5(c). The effective PL lifetime values slightly increase from 1.11 ms to 1.23 ms with increasing temperature from 77 to 500 K. The exact temperature dependent effective PL lifetime values are listed in Table S6 (ESI†).
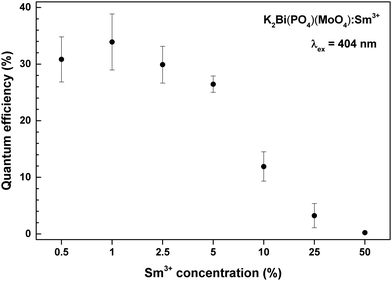
One of the most important factors determining the practical value of the phosphors is the external quantum efficiency. Calculated external quantum efficiencies upon 404 nm excitation are shown in Fig. 7. The external quantum efficiency can be expressed as:4
| EQE = IQE × ηesc | (6) |
One of the ways to increase the absorption is preparing the ceramics from the phosphors. This approach results in a longer path of excitation radiation and thus yields its stronger absorption. The ceramic disks with diameter of 8 mm and thicknesses of 0.52, 0.8, and 1.31 mm were prepared from 5% Sm3+ doped sample by pressing the powder at 30 kN force in a uniaxial press and annealing the disks at 600 °C for 2 h in air. Then these ceramic disks were placed on the top of 375 and 400 nm LEDs and the emission spectra of the obtained light source were recorded. The emission spectra of K2Bi(PO4)(MoO4):5%Sm3+ ceramic discs excited with 375 nm and 400 nm LEDs are given in Fig. 8(b) and (d), respectively. The emission spectra were normalized to the strongest Sm3+ emission line (at 597 nm) in order to better observe the changing absorption of ceramic disks with increasing the thickness. The emission spectra of 375 and 400 nm LEDs were also measured and are represented in Fig. 8(a) and (c), respectively.
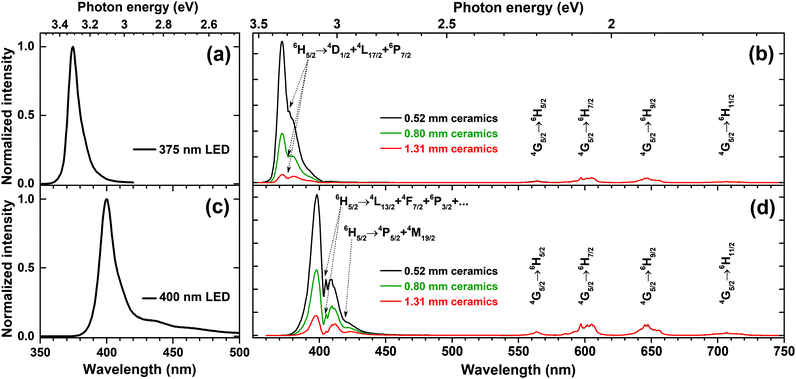 | ||
| Fig. 8 Emission spectra of (a) 375 nm LED, (c) 400 nm LED. Emission spectra of K2Bi(PO4)(MoO4):5%Sm3+ ceramic discs excited with (b) 375 nm LED, and (d) 400 nm LED. | ||
The obtained results indicate that the absorption of ceramic disks increases with thickness. However, some light from LED still passed through the prepared ceramic disks regardless the thickness of disks. It was also observed that the emission spectrum of the LEDs changed considerably after passing the disk. This clearly demonstrates that 375 and 400 nm emitting LEDs are suitable for excitation of K2Bi(PO4)(MoO4):5%Sm3+ ceramic disks. It is also evident that 400 nm LED emission is absorbed stronger since there are more absorption lines of K2Bi(PO4)(MoO4):Sm3+ samples in this spectral region as was already shown in Fig. 4(c).
Fig. 9 demonstrates the calculated colour coordinates of 375 and 400 nm emitting LEDs and light sources obtained by combining these LEDs with various thickness ceramic disks of K2Bi(PO4)(MoO4):5%Sm3+ specimen. In both cases, the pure orange-red light cannot be obtained since the colour coordinates are inside the CIE 1931 colour space diagram. This is due to the fact that some LED emission still passes through the disk and the combination of violet and orange colours is obtained. Increasing the thickness of ceramics placed on the 375 nm emitting LED leads to a shift of colour coordinate towards the edge of CIE 1931 diagram and this correlates well with the increasing absorption of LED emission. All colour coordinates of this light source are in the orange-red spectral region. However, different results were obtained for ceramic disks placed on top of the 400 nm emitting LED. In this case, the colour coordinates moved from blue to purple and, finally, to the pink region of CIE 1931 colour space. Thus the light sources with various colours can be obtained by selecting the appropriate thickness of ceramic disks.
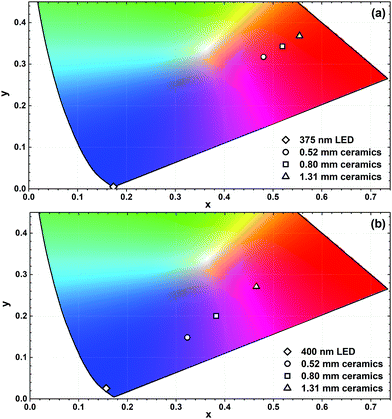 | ||
| Fig. 9 Fragments of the CIE 1931 colour space diagram with colour coordinates of K2Bi(PO4)(MoO4):5%Sm3+ ceramic disks combined with 375 nm (a) and 400 nm (b) emitting LEDs. | ||
The properties of a pcLED prototype
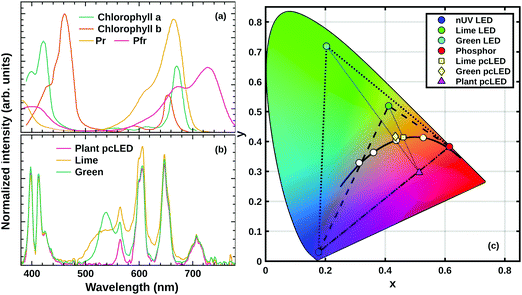
Fig. 10 demonstrates the eligibility for horticultural applications and the chromaticity coordinates of the proposed horticultural pcLEDs. Fig. 10(a) shows the absorption spectra of the main plant pigments: chlorophylls a and b,18 as well as phytochromes Pr and Pfr.54 The magenta curve in Fig. 10(b) shows the proposed pcLED SPD for the illumination of plants at greenhouses. The SPD of the prototype consists of the spectral component in the near-UV region, arising from LED electroluminescence, and sharp phosphor PL bands in the yellow, red, deep-red and far-red spectral regions. The unusual near-UV LED emission shape with two peaks is caused by the absorption of the K2Bi(PO4)(MoO4):5%Sm3+ phosphor. Fig. 10(a) and (b) demonstrate the good match between the absorption spectra of the plant pigments and the SPD of the pcLED, which makes Sm3+ doped K2Bi(PO4)(MoO4) phosphor a good candidate for horticultural applications. The spectral and colour properties of the proposed SPD is given in Table 2. The Duv value presented in the table is defined as the closest distance between the chromaticity of the test light source and the black-body radiation (Planckian locus) in the CIE (u′, 2/3v′) coordinates. It may attain positive or negative values for the test source chromaticity being above or below the Planckian locus, respectively.55 The sources of light are considered white if their chromaticity does not deviate from the Planckian locus more than Duv = ±0.006.56 It is seen in Table 2 that the SPD of the pcLED for plants has a Duv of 0.038, which is significantly greater than ±0.006 meaning that it is not considered as white light. Besides, it is characterized by a particularly poor colour rendering index Ra, which is equal to 35. This is due to the absence of a spectral component in the green spectral region. Such lighting conditions might cause discomfort for people working in greenhouses or a bad visual experience for visitors in botanical gardens. The suggested solution to this problem is the use of supplementary green or lime LEDs which are to be switched on only in the presence of people. If the right amount of the supplementary light is chosen, the chromaticity coordinates of the resulting SPD are situated close to the Planckian locus and, thus, the white light is obtained. The SPDs of pcLED prototypes containing the additional green and lime spectral components are presented in Fig. 10(b) and labelled as Green and Lime, respectively. Their spectral properties are given in Table 2. It is evident that both prototypes have Duv values less than ±0.006 and can be considered as white light sources. It is also seen that pcLED + Lime is characterized by a higher LE value, as well as better colour rendering properties than pcLED + Green. However, pcLED + Green has higher CCT value. It is important to note, that for different excitation to phosphor PL light ratios, the resulting SPDs would be characterized by different spectral properties. The 1931 CIE chromaticity diagram depicted in Fig. 10(c) presents the chromaticity coordinates of the proposed pcLED prototypes for plants without (magenta triangle) and with supplementary lime (yellow square) and green (yellow diamond) LEDs. Diagram also shows the xy coordinates of K2Bi(PO4)(MoO4):5%Sm3+ phosphor (red circle), near-UV (blue circle), green (cyan circle), and lime (green circle) LEDs. The dashed and dotted triangles, present the possible chromaticities of light sources supplemented with lime and green LEDs, respectively.| Light source | CCT, K | D uv | R a | LE, lm W−1 |
|---|---|---|---|---|
| pcLED for plants | — | 0.0382 | 44 | 166 |
| pcLED + lime | 2716 | 0.0012 | 79 | 274 |
| pcLED + green | 3151 | 0.0055 | 76 | 243 |
It is important to note, that some plants also require blue light with a peak around 450 nm matching the absorption spectrum of plant pigments carotenoids.19,25 Under such circumstances, the proposed pcLED can be easily supplemented with a blue direct emission InGaN LED. The schematic representation of the prepared pcLED prototype is given in Fig. S6 (ESI†).
4. Conclusions
In summary, single phase K2Bi(PO4)(MoO4):Sm3+ phosphors were prepared by solid state reaction at a moderate temperature of 600 °C with a Sm3+ content up to 100%. Samples showed bright orange-red luminescence under near-UV excitation. These materials possess excellent colour purity and thermal stability as well as a moderate quantum yield (34% for the 1% Sm3+ doped sample). The low absorption of samples with small Sm3+ concentrations can be overcome with preparation of ceramic disks, which increases the path length of the excitation radiation. All the mentioned features make our synthesized phosphors promising candidates for application in (In,Ga)N LED as a red-emitting component or for luminescent temperature sensors. Finally, analyses of decay curves of K2Bi(PO4)(MoO4):Sm3+ samples by IH model showed that IH function can be applied to the experimental data quite well; however, the dominant mechanism of the energy transfer is hard to identify. The SPD of the designed pcLED prototype matches well the absorption spectra of the main plant pigments – chlorophylls a and b, and phytochromes Pr, Pfr. Moreover, the supplementation of the prototype with a green or lime LEDs greatly increases its colour rendition properties and LE value, which could be very useful for the greenhouse staff or its visitors.Author contributions
J. G. and E. E. prepared the samples and performed luminescence measurements. S. S. performed the XRD measurements and Rietveld refinement. D. E. and T. J. performed temperature dependent measurements. J. P. performed IH calculations. A. Z.-K. and P. V. designed the pcLED prototype. A. Z.-K. characterized the optical and chromatic properties of the prototype and analysed the results. A. K. initialized the study. A. K. and J. G. wrote the manuscript draft. A. Z.-K. contributed to the manuscript draft. All authors discussed the obtained results and reviewed the manuscript.Data availability
All data generated or analysed during this study are included in this published article (and its ESI†).Conflicts of interest
The authors declare no competing interests.Acknowledgements
The authors gratefully thank Rokas Vargalis (Vilnius University) for taking SEM images. This research was funded by a grant (No. S-MIP-17-48) from the Research Council of Lithuania.References
- S. Nakamura, Jpn. J. Appl. Phys., 1991, 30, L1705–L1707 CrossRef.
- M. Born and T. Jüstel, Chem. Unserer Zeit, 2006, 40, 294–305 CrossRef CAS.
- R. Mueller-Mach, G. Mueller, M. R. Krames, H. A. Hoppe, F. Stadler, W. Schnick, T. Juestel and P. Schmidt, Phys. Status Solidi A, 2005, 202, 1727–1732 CrossRef CAS.
- A. Katelnikovas, J. Plewa, S. Sakirzanovas, D. Dutczak, D. Enseling, F. Baur, H. Winkler, A. Kareiva and T. Jüstel, J. Mater. Chem., 2012, 22, 22126–22134 RSC.
- J. Grigorjevaite and A. Katelnikovas, ACS Appl. Mater. Interfaces, 2016, 8, 31772–31782 CrossRef CAS PubMed.
- H. Bechtel, T. Jüstel, H. Gläser and D. U. Wiechert, J. Soc. Inf. Disp., 2002, 10, 63–67 CrossRef.
- M. A. Lim, J. K. Park, C. H. Kim, H. D. Park and M. W. Han, J. Mater. Sci. Lett., 2003, 22, 1351–1353 CrossRef CAS.
- V. Bachmann, C. Ronda, O. Oeckler, W. Schnick and A. Meijerink, Chem. Mater., 2009, 21, 316–325 CrossRef CAS.
- D. Chen, Y. Zhou and J. Zhong, RSC Adv., 2016, 6, 86285–86296 RSC.
- S. Ye, F. Xiao, Y. X. Pan, Y. Y. Ma and Q. Y. Zhang, Mater. Sci. Eng., R, 2010, 71, 1–34 CrossRef.
- S. Sakirzanovas, A. Katelnikovas, D. Dutczak, A. Kareiva and T. Justel, J. Lumin., 2011, 131, 2255–2262 CrossRef CAS.
- G. Blasse and B. C. Grabmaier, Luminescent Materials, Springer-Verlag, Berlin, 1994 Search PubMed.
- M. Janulevicius, J. Grigorjevaite, G. Merkininkaite, S. Sakirzanovas and A. Katelnikovas, J. Lumin., 2016, 179, 35–39 CrossRef CAS.
- E. V. Zharikov, C. Zaldo and F. Díaz, MRS Bull., 2011, 34, 271–276 CrossRef.
- F. Cheng, Z. Xia, X. Jing and Z. Wang, Phys. Chem. Chem. Phys., 2015, 17, 3689–3696 RSC.
- L. Liang, C. Chen, Z. Lv, M. Xie, Y. Yu, C. Liang, Y. Lou, C. Li and Z. Shi, J. Lumin., 2019, 206, 560–564 CrossRef CAS.
- D. Despommier, Trends Biotechnol., 2013, 31, 388–389 CrossRef CAS PubMed.
- D. Singh, C. Basu, M. Meinhardt-Wollweber and B. Roth, Renewable Sustainable Energy Rev., 2015, 49, 139–147 CrossRef CAS.
- E. Taulavuori, K. Taulavuori, J. K. Holopainen, R. Julkunen-Tiitto, C. Acar and I. Dincer, J. Sci. Food Agric., 2017, 97, 5059–5064 CrossRef CAS PubMed.
- A. Zabiliute-Karaliune, H. Dapkus, R. P. Petrauskas, S. Butkute, A. Zukauskas and A. Kareiva, Lith. J. Phys., 2015, 55, 200–207 Search PubMed.
- Z. Zhou, Y. Zhong, M. Xia, N. Zhou, B. F. Lei, J. Wang and F. F. Wu, J. Mater. Chem. C, 2018, 6, 8914–8922 RSC.
- Z. Zhou, J. Zheng, R. Shi, N. Zhang, J. Chen, R. Zhang, H. Suo, E. M. Goldys and C. Guo, ACS Appl. Mater. Interfaces, 2017, 9, 6177–6185 CrossRef CAS PubMed.
- J. Chen, N. Zhang, C. Guo, F. Pan, X. Zhou, H. Suo, X. Zhao and E. M. Goldys, ACS Appl. Mater. Interfaces, 2016, 8, 20856–20864 CrossRef CAS PubMed.
- J. Xiang, J. Zheng, Z. Zhou, H. Suo, X. Zhao, X. Zhou, N. Zhang, M. S. Molokeev and C. Guo, Chem. Eng. J., 2019, 356, 236–244 CrossRef CAS.
- M. S. McDonald, Photobiology of Higher Plants, J. Wiley, Chichester, England, 2003 Search PubMed.
- I. V. Zatovsky, K. V. Terebilenko, N. S. Slobodyanik, V. N. Baumer and O. V. Shishkin, J. Solid State Chem., 2006, 179, 3550–3555 CrossRef CAS.
- D. Zhao, F. Li, W. Cheng and H. Zhang, Acta Crystallogr., Sect. E: Struct. Rep. Online, 2009, 65, i78 CrossRef CAS PubMed.
- J. Rodríguez-Carvajal, Phys. B, 1993, 192, 55–69 CrossRef.
- P. Thompson, D. E. Cox and J. B. Hastings, J. Appl. Crystallogr., 1987, 20, 79–83 CrossRef CAS.
- J. Grigorjevaite, E. Ezerskyte, A. Minderyte, S. Stanionyte, R. Juskenas, S. Sakirzanovas and A. Katelnikovas, Materials, 2019, 12, 3275 CrossRef CAS PubMed.
- R. C. Ropp, Luminescence and the Solid State, Elsevier, Amsterdam, 2nd edn, 2004 Search PubMed.
- R. D. Shannon, Acta Crystallogr., Sect. A: Cryst. Phys., Diffr., Theor. Gen. Crystallogr., 1976, 32, 751–767 CrossRef.
- J. B. Gruber, B. Zandi and M. F. Reid, Phys. Rev. B: Condens. Matter Mater. Phys., 1999, 60, 15643–15653 CrossRef CAS.
- P. Kubelka, J. Opt. Soc. Am., 1948, 38, 448–457 CrossRef CAS PubMed.
- A. Kumar, D. K. Rai and S. B. Rai, Spectrochim. Acta, Part A, 2003, 59, 917–925 CrossRef.
- T. Luxbacher, H. P. Fritzer and C. D. Flint, J. Phys.: Condens. Matter, 1995, 7, 9683 CrossRef CAS.
- W. T. Carnall, H. Crosswhite and H. M. Crosswhite, Energy Level Structure and Transition Probabilities in the Spectra of the Trivalent Lanthanides in LaF3, Argonne National Laboratory Report, Lemont, IL, 1977 Search PubMed.
- F. Lahoz, I. R. Martín, J. Méndez-Ramos and P. Núñez, J. Chem. Phys., 2004, 120, 6180–6190 CrossRef CAS PubMed.
- H. M. Ha, T. T. Q. Hoa, L. V. Vu and N. N. Long, Int. J. Mater. Sci. Appl., 2016, 5, 284–289 CAS.
- M. Inokuti and F. Hirayama, J. Chem. Phys., 1965, 43, 1978–1989 CrossRef CAS.
- P. Solarz and W. Ryba-Romanowski, Phys. Rev. B: Condens. Matter Mater. Phys., 2005, 72, 075105 CrossRef.
- M. Malinowski, B. Jacquier, G. Boulon and W. Woliński, J. Lumin., 1988, 39, 301–311 CrossRef CAS.
- K. K. Mahato, D. K. Rai and S. B. Rai, Solid State Commun., 1998, 108, 671–676 CrossRef CAS.
- I. R. Martín, V. D. Rodríguez, U. R. Rodríguez-Mendoza, V. Lavín, E. Montoya and D. Jaque, J. Chem. Phys., 1999, 111, 1191–1194 CrossRef.
- C. R. Ronda, Luminescence: from Theory to Applications, Wiley-VCH, Weinheim, 2008 Search PubMed.
- F. Baur, A. Katelnikovas, S. Sakirzanovas, R. Petry and T. Jüstel, Z. Naturforsch. B, 2014, 69, 183–192 CAS.
- M. Janulevicius, P. Marmokas, M. Misevicius, J. Grigorjevaite, L. Mikoliunaite, S. Sakirzanovas and A. Katelnikovas, Sci. Rep., 2016, 6, 26098 CrossRef CAS PubMed.
- F. Baur, F. Glocker and T. Jüstel, J. Mater. Chem. C, 2015, 3, 2054–2064 RSC.
- J. Ueda, P. Dorenbos, A. J. J. Bos, A. Meijerink and S. Tanabe, J. Phys. Chem. C, 2015, 119, 25003–25008 CrossRef CAS.
- M. Muller, S. Fischer and T. Justel, RSC Adv., 2015, 5, 67979–67987 RSC.
- D. R. Lide and W. M. Mickey Haynes, CRC Handbook of Chemistry and Physics, 90th Edition (CD-ROM Version 2010), CRC Press/Taylor and Francis, Boca Raton, FL, 2009 Search PubMed.
- J.-J. Huang, H.-C. Kuo and S.-C. Shen, Nitride semiconductor light-emitting diodes (LEDs): materials, technologies and applications, Woodhead Publishing, Oxford, 2014 Search PubMed.
- S. H. Lee, J. I. Choi, Y. J. Kim, J. K. Han, J. Ha, E. Novitskaya, J. B. Talbot and J. McKittrick, Mater. Charact., 2015, 103, 162–169 CrossRef CAS.
- R. D. Vierstra and P. H. Quail, Biochemistry, 1983, 22, 2498–2505 CrossRef CAS.
- Y. Ohno, Leukos, 2014, 10, 47–55 CrossRef.
- N. E. M. Association, 2008, ANSI C78.377-2008.
Footnote |
| † Electronic supplementary information (ESI) available: XRD patterns; Rietveld refinement data; IR spectra; PL decay curves; Sm3+ concentration dependent unit cell parameters; CIE 1931 and CIE 1976 colour coordinates; PL lifetime values; IH decay curve fit parameters; drawing of designed pcLED prototype. See DOI: 10.1039/d0ma00369g |
| This journal is © The Royal Society of Chemistry 2020 |

