High-throughput wastewater analysis for substance use assessment in central New York during the COVID-19 pandemic
Received
28th August 2020
, Accepted 14th October 2020
First published on 15th October 2020
Abstract
Wastewater entering sewer networks represents a unique source of pooled epidemiological information. In this study, we coupled online solid-phase extraction with liquid chromatography-high resolution mass spectrometry to achieve high-throughput analysis of health and lifestyle-related substances in untreated municipal wastewater during the coronavirus disease 2019 (COVID-19) pandemic. Twenty-six substances were identified and quantified in influent samples collected from six wastewater treatment plants during the COVID-19 pandemic in central New York. Over a 12 week sampling period, the mean summed consumption rate of six major substance groups (i.e., antidepressants, antiepileptics, antihistamines, antihypertensives, synthetic opioids, and central nervous system stimulants) correlated with disparities in household income, marital status, and age of the contributing populations as well as the detection frequency of severe acute respiratory syndrome coronavirus 2 (SARS-CoV-2) RNA in wastewater and the COVID-19 test positivity in the studied sewersheds. Nontarget screening revealed the covariation of piperine, a nontarget substance, with SARS-CoV-2 RNA in wastewater collected from one of the sewersheds. Overall, this proof-of-the-concept study demonstrated the utility of high-throughput wastewater analysis for assessing the population-level substance use patterns during a public health crisis such as COVID-19.
Environmental significance
Wastewater surveillance has been increasingly implemented worldwide for monitoring population-level substance use trends. Our study demonstrates the application of online solid-phase extraction and liquid chromatography-high resolution mass spectrometry for high-throughput screening of pharmaceuticals and lifestyle chemicals in municipal wastewater for substance use assessment in sewersheds experiencing the coronavirus pandemic.
|
Introduction
Wastewater-based epidemiology (WBE) is an evidence-based approach for monitoring infectious disease outbreaks,1–3 substance use trends,4–6 and antimicrobial resistance spread at the community scale.7,8 Since the onset of the coronavirus pandemic in 2019, research groups worldwide have demonstrated the feasibility and scalability of monitoring severe acute respiratory syndrome coronavirus 2 (SARS-CoV-2) in wastewater or sludge to track and/or predict the transmission and control of SARS-CoV-2 in sewered communities.9–24 Given the widespread efforts on wastewater sampling brought by these SARS-CoV-2 surveillance platforms, co-analysis of human biomarkers in wastewater for substance use assessment represents an attractive strategy to gain additional insights into population behavior and health status underlying the susceptibility to coronavirus disease 2019 (COVID-19) and its adverse outcomes. Indeed, recent reviews and meta-analyses have highlighted common risk factors for COVID-19 and substance use.25–27 For example, comorbidities associated with substance use disorders (e.g., cardiovascular, metabolic, pulmonary, and respiratory diseases) are known to exacerbate COVID-19 mortality and related health outcomes.28–31 Meanwhile, socioeconomic disparities in health exert a disproportionate impact on the severity of COVID-19 in certain racial and ethnic minority populations (e.g., African-American)32–34 and disadvantaged communities,35–37 particularly those having a higher prevalence of substance use disorders.25 Furthermore, COVID-related non-pharmaceutical interventions (e.g., lockdowns) and pharmacologic treatments may in turn contribute to changes in substance use behaviors.38–41 For instance, emergency medical services data in Kentucky and Virginia showed increases in opioid overdose rates during the early months of the pandemic,42,43 while longitudinal wastewater data in South Australia suggested a decline in alcohol consumption due to social distancing and isolation measures.44 Collectively, these studies underscore the importance of substance use assessment by means of wastewater analysis to complement clinical and sociodemographic data for characterizing risk drivers of COVID-19 at the population level.
In this proof-of-concept study, we combined online solid-phase extraction (online SPE) with liquid chromatography-high resolution mass spectrometry (LC-HRMS) to enable high-throughput screening of pharmaceuticals and lifestyle chemicals in untreated municipal wastewater sampled from central New York during the COVID-19 pandemic. Online SPE automates wastewater extraction, preconcentration, and large-volume injections, and has been applied for the rapid analysis of illicit and prescription drugs in several WBE studies.45–49 LC-HRMS streamlines target screening of known substances as well as wide-scope screening of emerging or unknown substances in wastewater.50,51 For example, recent WBE studies have implemented data-driven prioritization strategies based on suspect screening, and to a lesser extent, nontarget screening to identify new psychoactive substances, widely consumed illicit drugs, and their unknown metabolites in wastewater.52–56 Our specific objectives of this study were to (i) estimate the population-level consumption rates of common health and lifestyle-related substances in untreated wastewater collected from six sewersheds in central New York; (ii) explore the relationships between the consumption rates of representative substance groups and sociodemographics and COVID-19 prevalence in the studied sewersheds; and (iii) develop a nontarget screening workflow to prioritize unknown substances that covaried with SARS-CoV-2 RNA in wastewater for follow-up investigations.
Materials and methods
Chemicals and reagents
Methanol (LC-MS grade), water (LC-MS grade), acetonitrile (LC-MS grade), and formic acid solution (LC-MS grade) were supplied by Fisher Scientific (Waltham, MA). Unlabeled reference standards and isotope-labeled internal standards were purchased from Sigma-Aldrich (St. Louis, MO), Toronto Research Chemicals (Toronto, Ontario), C/D/N Isotopes (Pointe-Claire, Quebec), and Cambridge Isotope Laboratories (Tewksbury, MA) as high-purity substances or concentrated solutions and stored following manufacturers' recommendations.
Wastewater sampling
Over the course of this study, twelve batches of 24 h flow-proportional composite influent wastewater samples were collected weekly between April 29 and July 15, 2020 from six municipal wastewater treatment plants (WWTPs A–F; Table 1) in central New York under dry weather conditions. Our sampling followed the rising and falling COVID-19 prevalence in the study region where the daily number of laboratory-confirmed positive COVID-19 cases peaked in late May 2020.57 Note that samples were only collected in the middle of the week due to the lack of personnel availability and laboratory accessibility on weekends. WWTPs A–F connect to sewer networks that primarily consist of gravity sewers. The average sewer transit times for these sewer networks ranged from 1.2 to 4.4 h with a mean of 2.6 ± 1.5 h, which resembled the estimated median transit time of 3.3 h for WWTPs of varying sizes across the U.S.58 Together, these six WWTPs serve a total population of ∼396![[thin space (1/6-em)]](https://www.rsc.org/images/entities/char_2009.gif) 300 in urban and suburban areas of central New York. Upon collection, samples were first transported on ice to Biosafety Level 3 laboratories at SUNY-Upstate Medical University for SARS-CoV-2 RNA analysis as detailed in Green et al.59 Split samples (∼40 mL) were frozen in the dark at −20 °C and processed at Syracuse University for online SPE-LC-HRMS analysis as soon as practically possible. General operational (e.g., average daily flow rates) and wastewater quality parameters (e.g., pH and temperature) were provided by WWTP personnel when applicable. Nine 24 h composite influent wastewater samples collected from WWTP A over the year of 2018 and archived at −20 °C were also analyzed in this study for comparison with the 2020 samples.
300 in urban and suburban areas of central New York. Upon collection, samples were first transported on ice to Biosafety Level 3 laboratories at SUNY-Upstate Medical University for SARS-CoV-2 RNA analysis as detailed in Green et al.59 Split samples (∼40 mL) were frozen in the dark at −20 °C and processed at Syracuse University for online SPE-LC-HRMS analysis as soon as practically possible. General operational (e.g., average daily flow rates) and wastewater quality parameters (e.g., pH and temperature) were provided by WWTP personnel when applicable. Nine 24 h composite influent wastewater samples collected from WWTP A over the year of 2018 and archived at −20 °C were also analyzed in this study for comparison with the 2020 samples.
Table 1 Sewershed and sociodemographic characteristics
|
|
A |
B |
C |
D |
E |
F |
|
Calculated using the linear distance method as described by Kapo et al.58 by dividing the average distances between the population density polygon centroids and the coordinate of a given WWTP by an average sewage flow velocity of 0.6 m s−1 (personal communication with the sewer maintenance superintendent118).
Extracted from the 2014–2018 American Community Survey as estimates ± margins of error.
Including American Indian and Alaska Native alone, Native Hawaiian and other Pacific Islander alone, and some other race alone.
Including Master's degree, Doctorate degree, and professional school.
|
| WWTP average capacity (million gallons per day) |
84.2 |
9.0 |
7.0 |
3.0 |
10.0 |
6.5 |
| Sewershed area (km2) |
347.3 |
125.6 |
40.5 |
80.8 |
155.8 |
127.4 |
| Sewer transit timea (hours) |
2.5 ± 1.3 (0.5–7.5) |
1.8 ± 0.9 (0.5–3.1) |
1.2 ± 0.4 (0.7–1.7) |
4.4 ± 2.3 (0.8–7.8) |
3.5 ± 1.3 (1.1–5.3) |
2.5 ± 1.3 (0.2–4.5) |
| Sewered populationb |
239032 ± 3739 |
30058 ± 1352 |
26138 ± 1132 |
11849 ± 812 |
50084 ± 1486 |
39123 ± 1409 |
|
|
Gender
|
| Male |
47.6 ± 0.9% |
49.7 ± 2.8% |
49.9 ± 2.7% |
49.4 ± 3.9% |
48.1 ± 1.8% |
47.9 ± 2.2% |
| Female |
52.4 ± 1.0% |
50.3 ± 2.5% |
50.1 ± 2.5% |
50.6 ± 3.9% |
51.9 ± 1.7% |
52.1 ± 2.2% |
|
|
Age group
(years)
|
| <18 |
20.8 ± 1.6% |
19.9 ± 4.8% |
22.1 ± 5.0% |
23.5 ± 7.5% |
21.3 ± 3.4% |
20.6 ± 3.9% |
| 18–24 |
14.2 ± 1.2% |
6.0 ± 2.5% |
7.1 ± 2.8% |
5.9 ± 3.4% |
6.6 ± 1.8% |
9.8 ± 2.6% |
| 25–34 |
14.6 ± 0.9% |
12.8 ± 2.7% |
13.3 ± 2.7% |
13.0 ± 4.1% |
13.8 ± 1.9% |
9.3 ± 1.8% |
| 35–44 |
10.5 ± 0.7% |
12.3 ± 2.7% |
12.1 ± 2.5% |
13.0 ± 4.2% |
12.2 ± 1.7% |
11.3 ± 2.0% |
| 45–54 |
12.2 ± 0.8% |
15.0 ± 2.8% |
14.6 ± 2.6% |
16.4 ± 4.2% |
15.7 ± 1.9% |
12.9 ± 2.1% |
| 55–64 |
12.3 ± 0.9% |
15.5 ± 3.2% |
13.7 ± 2.8% |
16.4 ± 4.9% |
14.2 ± 2.0% |
15.8 ± 2.7% |
| 65–69 |
4.7 ± 0.5% |
6.1 ± 1.5% |
5.9 ± 1.6% |
4.9 ± 2.1% |
5.5 ± 1.1% |
6.2 ± 1.4% |
| ≥70 |
10.7 ± 1.0% |
12.4 ± 3.3% |
11.2 ± 3.1% |
6.9 ± 3.6% |
10.7 ± 2.1% |
14.1 ± 3.0% |
|
|
Race/ethnicity
|
| White |
70.9 ± 1.3% |
95.3 ± 4.5% |
92.5 ± 4.3% |
96.3 ± 6.8% |
92.3 ± 2.9% |
84.5 ± 3.4% |
| Black or African American |
17.8 ± 0.9% |
1.9 ± 1.5% |
2.8 ± 1.1% |
1.4 ± 1.0% |
2.9 ± 1.1% |
6.3 ± 1.6% |
| Asian |
4.6 ± 0.4% |
0.8 ± 0.5% |
1.8 ± 0.7% |
1.2 ± 1.0% |
1.8 ± 0.5% |
5.5 ± 1.3% |
| Otherc |
2.3 ± 0.3% |
0.4 ± 0.4% |
0.6 ± 0.5% |
0.0 ± 0.5% |
0.8 ± 0.4% |
1.6 ± 0.6% |
| Non-hispanic/latino |
93.5 ± 1.5% |
97.4 ± 4.4% |
96.6 ± 4.4% |
97.7 ± 6.3% |
97.1 ± 2.9% |
96.9 ± 3.5% |
| Hispanic/Latino |
6.5 ± 0.5% |
2.6 ± 1.1% |
3.4 ± 1.2% |
2.3 ± 2.1% |
2.9 ± 0.8% |
3.1 ± 0.8% |
|
|
Marital status
|
| Never married |
44.3 ± 1.4% |
26.7 ± 3.4% |
29.7 ± 3.4% |
24.0 ± 4.5% |
28.0 ± 2.3% |
28.3 ± 2.9% |
| Now married |
39.0 ± 1.0% |
56.7 ± 3.2% |
55.2 ± 3.2% |
62.2 ± 5.5% |
54.7 ± 2.2% |
56.1 ± 2.8% |
| Widowed |
6.4 ± 0.4% |
5.4 ± 1.3% |
4.7 ± 1.2% |
5.1 ± 1.7% |
5.8 ± 0.9% |
6.9 ± 1.1% |
| Divorced |
10.3 ± 0.6% |
11.2 ± 1.9% |
10.4 ± 1.8% |
8.7 ± 2.6% |
11.5 ± 1.4% |
8.7 ± 1.4% |
|
|
Education attainment
|
| Below/some high school |
12.0 ± 1.5% |
5.1 ± 3.0% |
5.6 ± 3.3% |
5.8 ± 4.6% |
5.8 ± 2.4% |
5.5 ± 2.9% |
| High school |
26.9 ± 1.1% |
26.6 ± 2.9% |
25.8 ± 3.0% |
25.1 ± 4.7% |
27.0 ± 2.1% |
16.3 ± 2.0% |
| Some college |
18.5 ± 0.9% |
19.2 ± 3.0% |
16.5 ± 2.5% |
22.1 ± 4.9% |
17.6 ± 1.8% |
14.8 ± 2.0% |
| Associate's |
11.3 ± 0.5% |
14.5 ± 1.8% |
13.9 ± 1.7% |
14.7 ± 2.5% |
14.3 ± 1.2% |
8.5 ± 1.2% |
| Bachelor's |
17.7 ± 0.7% |
19.7 ± 1.9% |
22.1 ± 2.0% |
18.3 ± 2.9% |
22.6 ± 1.5% |
24.9 ± 1.9% |
| Graduate/professionald |
13.6 ± 0.6% |
14.9 ± 1.8% |
16.1 ± 1.8% |
14.0 ± 2.4% |
12.7 ± 1.1% |
30.0 ± 2.2% |
|
|
Household income
|
| Below/near poverty |
21.3 ± 1.4% |
9.0 ± 3.0% |
8.4 ± 2.9% |
14.2 ± 6.3% |
9.7 ± 2.2% |
10.6 ± 2.8% |
| Low income |
24.5 ± 1.9% |
21.8 ± 5.5% |
19.2 ± 5.5% |
15.9 ± 9.1% |
17.9 ± 3.6% |
16.4 ± 4.3% |
| Middle class |
47.0 ± 2.9% |
56.3 ± 9.6% |
61.0 ± 9.9% |
54.7 ± 14.6% |
60.3 ± 6.9% |
51.7 ± 7.9% |
| High income |
7.2 ± 0.7% |
12.9 ± 2.8% |
11.4 ± 2.5% |
15.2 ± 4.1% |
12.1 ± 1.8% |
21.3 ± 2.9% |
Sample analysis
Prior to instrumental analysis, 10 mL of raw wastewater samples were spiked with a mixture of isotope-labeled chemicals as internal standards (200 ng L−1 each) and filtered by 0.22 μm Millex-GP polyethersulfone syringe filters into Chromacol autosampler vials. Samples were then analyzed in duplicate by a Thermo Scientific EQuan MAX Plus online SPE system hyphenated with a Vanquish Flex ultra-high-performance liquid chromatograph and an LTQ-Orbitrap XL hybrid ion trap-Orbitrap high resolution mass spectrometer. Briefly, 1 mL of each sample was loaded from a 5 mL stainless steel sample loop onto a Hypersil GOLD aQ C18 trap column (20 × 2.1 mm i.d., 12 μm particle size) for analyte preconcentration. The trap column was washed with acidified water (amended with 0.1% v/v formic acid) to remove inorganics and subsequently eluted with the analytical pump gradient. The eluted analytes were transferred to a Hypersil GOLD C18 analytical column (100 × 2.1 mm i.d., 3 μm particle size) running acidified water and methanol as the mobile phases (both amended with 0.1% v/v formic acid) for chromatographic separation. The trap and analytical columns were then re-equilibrated to their starting conditions prior to the next injection. High-resolution accurate mass screening was performed using positive and negative electrospray ionization in separate runs following instrumental settings described in our recent work.60 The total analysis time for each sample was 36 minutes.
Suspect screening was performed in TraceFinder 4.1 (Thermo Scientific) with predefined peak filtering criteria using an in-house database containing compound-specific information for most frequently used pharmaceuticals and lifestyle chemicals (including their stable metabolites) in the study region. Full scan triggered data-dependent tandem mass (dd-MS2) spectra of suspect compounds were interrogated against reference spectra in the mzCloud mass spectral library61 using Compound Discoverer 3.1 (Thermo Scientific). Suspect compounds with an mzCloud match factor of >30 were selected for further confirmation. Twenty-six substances were confirmed in 100% wastewater samples based on the match of their chromatographic retention times and dd-MS2 spectra to those of authentic reference standards. Target quantification of these 26 confirmed compounds was performed using 14-point calibration curves (i.e., 0.1–5000 ng L−1) with reference to their isotope-labeled analogues (Table 2). Good linearity (R2 = 0.992–0.999) was established for the calibration curves of all target compounds. Limits of quantification for target compounds were determined in pooled wastewater (i.e., prepared by mixing equal volumes of WWTP A–F samples) to account for matrix effects (Table 2). Calibration standards were run with each sample sequence to evaluate within- and between-run accuracy and precision. Solvent blanks were run to check for potential cross-contamination following the analysis of highly concentrated standards.
Table 2 Online SPE-LC-HRMS method performance for target substances
| Target substance |
CAS |
Adduct |
Exact mass (m/z) |
Diagnostic fragment (m/z) |
RTa (min) |
LOQb (ng L−1) |
ILISc |
|
Retention time.
Limit of quantification determined in pooled wastewater (i.e., prepared by mixing equal volumes of WWTP A–F samples).
Isotope-labeled internal standard.
2-Ethylidene-1,5-dimethyl-3,3-diphenylpyrrolidine.
Nontarget substance.
|
| Acetaminophen |
103-90-2 |
[M + H]+ |
152.0706 |
126.0100 |
4.74 |
0.3 |
Acetaminophen-d3 |
| Amphetamine |
300-62-9 |
[M + H]+ |
136.1121 |
119.0859 |
6.22 |
1.2 |
Amphetamine-d10 |
| Atenolol |
29122-68-7 |
[M + H]+ |
267.1703 |
190.0851 |
4.35 |
12 |
Atenolol-d7 |
| Caffeine |
58-08-2 |
[M + H]+ |
195.0877 |
138.0656 |
6.58 |
1.1 |
Caffeine-d9 |
| Carbamazepine |
298-46-4 |
[M + H]+ |
237.1022 |
194.0955 |
11.79 |
6.6 |
Carbamazepine-d10 |
| Cimetidine |
51481-61-9 |
[M + H]+ |
253.1230 |
159.0690 |
4.57 |
7.5 |
Cimetidine-d3 |
| Diphenhydramine |
58-73-1 |
[M + H]+ |
256.1696 |
224.0828 |
10.44 |
6.8 |
Diphenhydramine-d3 |
| Ephedrine |
299-42-3 |
[M + H]+ |
166.1226 |
148.1156 |
5.42 |
15 |
Ephedrine-d3 |
| Gabapentin |
60142-96-3 |
[M + H]+ |
172.1332 |
154.1221 |
6.15 |
0.4 |
Gabapentin-d10 |
| Lamotrigine |
84057-84-1 |
[M + H]+ |
256.0151 |
210.9816 |
8.44 |
4.0 |
Lamotrigine-13C, 15N4 |
| Levetiracetam |
102767-28-2 |
[M + H]+ |
171.1128 |
126.0908 |
5.62 |
8.0 |
Levetiracetam-d6 |
| Lidocaine |
137-58-6 |
[M + H]+ |
235.1805 |
234.1846 |
6.93 |
1.0 |
Lidocaine-d10 |
| Methamphetamine |
537-46-2 |
[M + H]+ |
150.1277 |
91.0538 |
6.44 |
4.3 |
Methamphetamine-d8 |
| Methocarbamol |
532-03-6 |
[M + H]+ |
242.1023 |
163.0748 |
8.75 |
32 |
Methocarbamol-d3 |
| Metoprolol |
51384-51-1 |
[M + H]+ |
268.1907 |
191.1058 |
8.00 |
2.2 |
Metoprolol-d7 |
| Phentermine |
122-09-8 |
[M + H]+ |
150.1277 |
133.1006 |
7.28 |
7.6 |
Phentermine-d5 |
| Pregabalin |
148553-50-8 |
[M + H]+ |
160.1332 |
142.1221 |
6.13 |
8.9 |
Pregabalin-d6 |
| Sulfamethoxazole |
723-46-6 |
[M + H]+ |
254.0594 |
156.0107 |
7.44 |
6.6 |
Sulfamethoxazole-d4 |
| Tramadol |
27203-92-5 |
[M + H]+ |
264.1958 |
246.1840 |
7.57 |
3.4 |
Tramadol-13C, d3 |
| Trimethoprim |
738-70-5 |
[M + H]+ |
291.1452 |
230.1152 |
6.26 |
9.2 |
Trimethoprim-d9 |
| Venlafaxine |
93413-69-5 |
[M + H]+ |
278.2115 |
260.2000 |
9.78 |
3.0 |
Venlafaxine-d6 |
| Benzoylecgonine |
519-09-5 |
[M + H]+ |
290.1387 |
168.1012 |
7.63 |
2.9 |
Benzoylecgonine-d3 |
| EDDPd |
30223-73-5 |
[M + H]+ |
278.1903 |
249.1502 |
10.30 |
4.5 |
EDDP-d3 |
| Hydroxybupropion |
92264-81-8 |
[M + H]+ |
256.1099 |
238.0985 |
8.76 |
3.6 |
Hydroxybupropion-d6 |
| Ritalinic acid |
19395-41-6 |
[M + H]+ |
220.1332 |
84.0804 |
7.52 |
1.0 |
Ritalinic acid-d10 |
| Sucralose |
56038-13-2 |
[M + FA]− |
441.0128 |
395.0071 |
7.15 |
25 |
Sucralose-d6 |
| Piperinee |
94-62-2 |
[M + H]+ |
286.1438 |
201.0539 |
15.41 |
4.4 |
Metolachlor-d6 |
Nontarget screening was conducted with WWTP A wastewater samples exhibiting a characteristic time trend of SARS-CoV-2 RNA abundance (i.e., first increased and then decreased over the sampling period). Peak profile preprocessing (e.g., retention time alignment, unknown compound detection and grouping, background subtraction, molecular formula assignment, intensity normalization) and differential analysis (i.e., peak area ratio filtering) were performed in Compound Discoverer 3.1 to filter mass spectral features that showed elevated through-time peak intensities over the same time period during which higher SARS-CoV-2 RNA concentrations were detected in corresponding samples. Tucker's congruence coefficients (TCCs) were then computed using the multiway package62 in R 4.0.2 to evaluate the shape similarity between the time trends of filtered nontarget features and SARS-CoV-2 RNA. Typically, a TCC value above 0.95 indicates good shape similarity between two profiles.63 Lastly, hierarchical cluster analysis (HCA) was performed using the factoextra package64 in R to further prioritize clusters of high-TCC nontarget features that showed the closest time trend similarity with SARS-CoV-2 RNA detection. Full scan triggered dd-MS2 spectra of HCA-prioritized nontarget features were searched on mzCloud61 and further confirmed (or rejected) by authentic reference standards. Target quantification of a newly confirmed nontarget compound (i.e., piperine) was performed retrospectively.
Data analysis
Following instrumental analysis, the mass loads and consumption rates of individual pharmaceuticals and lifestyle chemicals were estimated using the following equations:65| | 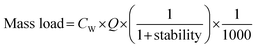 | (1) |
| |  | (2) |
where mass load represents the daily mass load of a substance entering a WWTP (g d−1), CW is the aqueous concentration of a substance in wastewater (ng L−1), Q is the average daily flow rate of wastewater measured at the inlet of a WWTP (m3 d−1), stability is the in-sewer stability change of a substance (%; assuming <10% according to previous WBE studies66–68 given the relatively short sewer transit times in the studied sewersheds), consumption rate is the collective consumption of a substance (i.e., consumed and disposed) by a given population (mg per d per 1000 people), excretion is the average excretion rate of a parent compound or its metabolite reported in the pharmacokinetic literature and WBE studies,65,68–79 MWParent is the molecular weight of a parent compound, MWMetabolite is the molecular weight of a stable metabolite when present, and population is the number of residents served by a given WWTP (assuming no substantial variations due to travel restrictions80). Note that the mass loads and substance consumption rates calculated herein only represent best estimates with acknowledged uncertainties.68,81
The detection frequency of SARS-CoV-2 RNA in wastewater was determined by dividing the number of SARS-CoV-2 RNA occurrence (i.e., at least one positive hit out of three reverse transcription quantitative polymerase chain reactions) by the total number of samples analyzed for each sewershed over the sampling period.59 The daily COVID-19 case counts were retrieved from the New York State Statewide COVID-19 Testing database and geocoded by research staff from the New York State Department of Health (NYSDOH) to the address points within each sewershed.57 The COVID-19 test positivity for each sewershed was calculated by dividing the total number of positive tests by the total number of tests conducted over the sampling period. Sociodemographic attributes of the population in each sewershed (i.e., 5 year estimates and associated margins of error for age groups, race, ethnicity, marital status, educational attainment, household income, employment status) were extracted from the U.S. Census Bureau's 2014–2018 American Community Survey at the block-group level using the tidycensus82 package and georeferenced using the tigris83 package in R. Statistical analyses (e.g., Spearman correlation matrix analysis and Mann–Whitney test) were performed using GraphPad Prism 8.4.
Results and discussion
Estimation of population-level substance consumption rates
Overall, twenty-six health and lifestyle-related substances with 100% detection frequency in wastewater samples were quantified by online SPE-LC-HRMS, including 22 parent compounds and 4 metabolites (i.e., 2-ethylidene-1,5-dimethyl-3,3-diphenylpyrrolidine (a metabolite of methadone), benzoylecgonine (a metabolite of cocaine), hydroxybupropion (a metabolite of bupropion), and ritalinic acid (a metabolite of methylphenidate)). Several other compounds prioritized by suspect screening (i.e., buprenorphine, codeine, norfentanyl, norhydrocodone, oxycodone) were also confirmed in wastewater samples but not quantified due to their limited detection frequency. Most compounds occurred at ng L−1-μg L−1 levels in wastewater samples and can be broadly categorized as antibacterials (i.e., sulfamethoxazole and trimethoprim), antidepressants (i.e., bupropion and venlafaxine), antiepileptics (i.e., carbamazepine, gabapentin, lamotrigine, levetiracetam, pregabalin), antihypertensives (i.e., atenolol and metoprolol), antihistamines (i.e., cimetidine and diphenhydramine), synthetic opioids (i.e., methadone and tramadol), and central nervous system stimulants (i.e., amphetamine, cocaine, ephedrine, methamphetamine, methylphenidate). Other compounds included acetaminophen (analgesic), lidocaine (local anesthetic), methocarbamol (muscle relaxant), phentermine (appetite suppressant), as well as caffeine and sucralose. Many of these compounds have been established as health and lifestyle biomarkers for substance use assessment in previous WBE studies.84
With a few exceptions, the mean consumptions rates of 26 target pharmaceuticals and lifestyle chemicals were close to previous estimates via the analysis of wastewater sampled from other northeastern U.S. sewersheds.45,85–87 On average, the consumption rates of these substances spanned over five orders of magnitude, with acetaminophen and trimethoprim being the most and least consumed substance, respectively (Fig. 1). The consumption rate of caffeine varied from 6.91 ± 2.57 × 10⁴ to 1.85 ± 1.05 × 10⁵ mg per d per 1000 people across sewersheds, which bracketed the average daily beverage caffeine intakes estimated for the U.S. population (i.e., 165 ± 1 mg per d per person)88 and overlapped with the range of values reported for major European cities via wastewater analysis (i.e., 86–263 mg per d per person).71 Likewise, the mean consumption rate of sucralose, the most widely consumed artificial sweetener in the U.S.,89 was 1.49 ± 0.70 × 10⁴ mg per d per 1000 people, which was similar to the average value previously reported for the Albany area of New York based on wastewater analysis (i.e., 18.5 ± 4.4 g per d per 1000 people).90 The fact that the consumption rates of caffeine and sucralose estimated in this work matched literature-reported values provides confidence in the validity of our analysis. Furthermore, the mean consumption rates of antidepressants, antiepileptics, antihistamines, antihypertensives, opioids, and stimulants correlated with each other in most cases (ρ = 0.886–1.000; p = 0.003–0.033), which qualitatively agreed with prior WBE work showing correlations among the population-level consumption rates of antidepressants, antiepileptics, antihypertensives, and opioids.72,91 Such covariations among the consumption rates of these representative substance groups pointed to common underlying determinants of substance use patterns in the contributing populations.
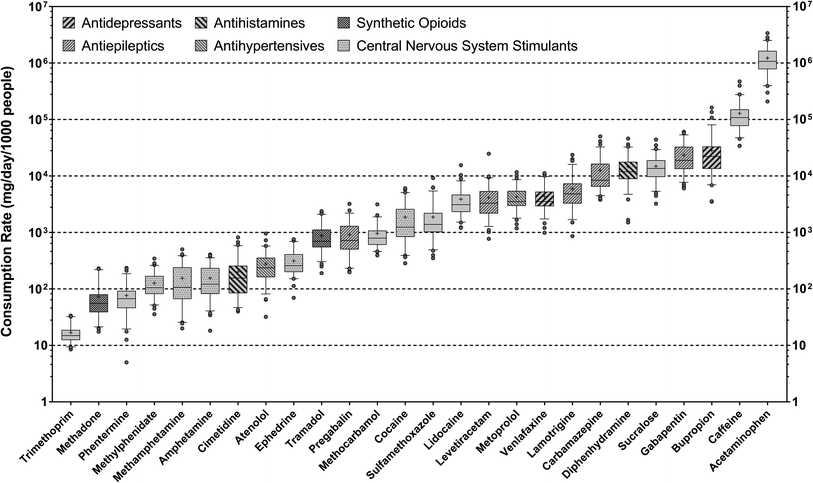 |
| | Fig. 1 Consumption rates of 26 substances in sewersheds A–F between April 29 and July 15, 2020 (n = 72). The box extends from the 25th to 75th percentiles. The whiskers extend down to the 5th percentile and up to the 95th. The centerline in each box represents the median, while the plus sign “+” represents the mean. Note that the consumption rate of methadone was estimated via its metabolite 2-ethylidene-1,5-dimethyl-3,3-diphenylpyrrolidine (EDDP), the consumption rate of cocaine was estimated via its metabolite benzoylecgonine, the consumption rate of bupropion was estimated via its metabolite hydroxybupropion, and the consumption rate of methylphenidate was estimated via its metabolite ritalinic acid. | |
Substance consumption in the context of sociodemographic heterogeneity and COVID-19 prevalence
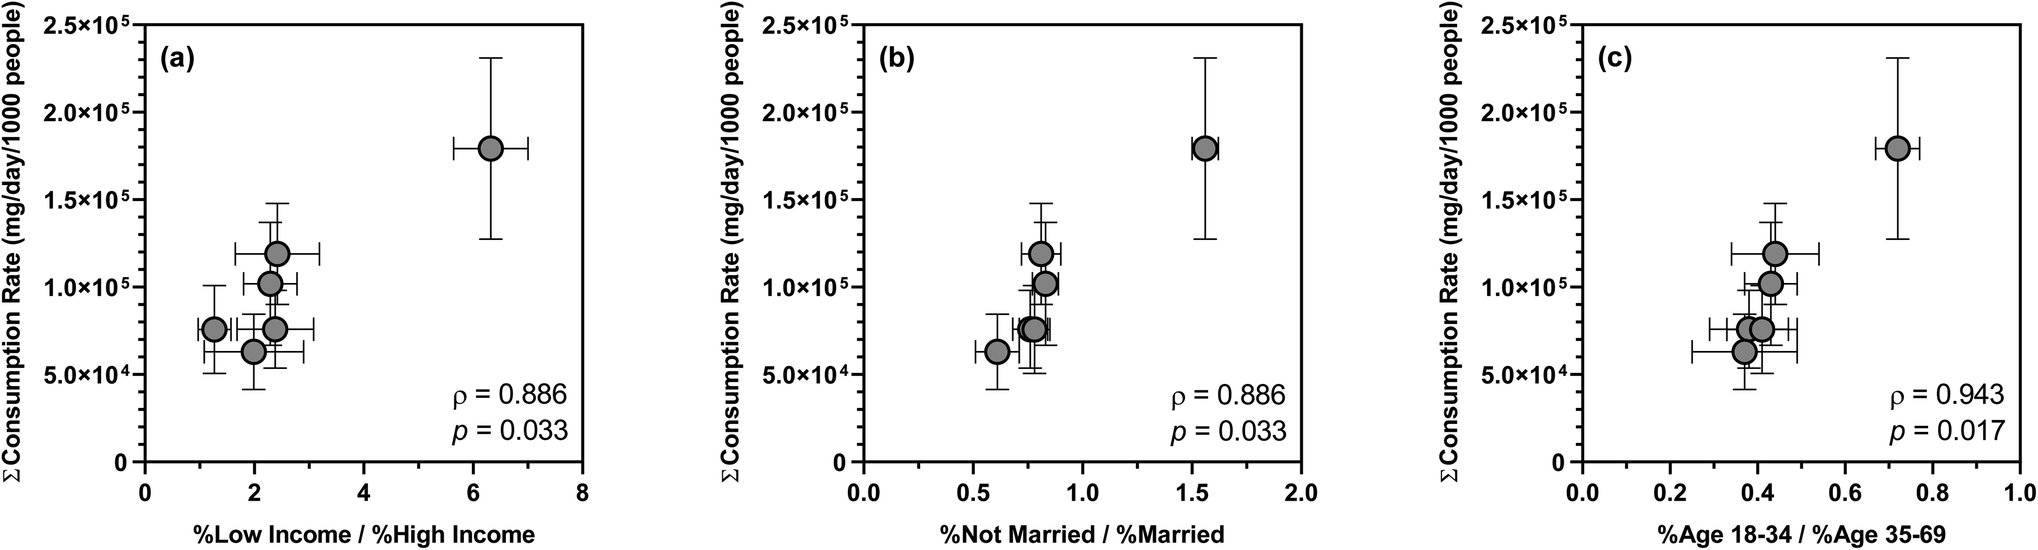
Over the 12 week sampling period, the mean summed consumption rate of 26 substances varied across sewersheds, ranging from 9.65 ± 3.97 × 10⁵ to 2.21 ± 0.86 × 10⁶ mg per d per 1000 people. Such differences in substance consumption rates likely resulted from disparities in the sociodemographic characteristics of the contributing populations as suggested by previous WBE studies.72,91,92 For example, a nationwide WBE study in Australia highlighted opioids, antidepressants, antiepileptics, and antihypertensives as proxies of socioeconomic distress and inequalities.91 Similarly, wastewater surveillance in Greece confirmed a concomitant increase in the consumption of psychoactive drugs and mental illnesses as a consequence of adverse socioeconomic changes.72 To the best of our knowledge, however, no U.S.-based WBE studies have examined the associations between sewershed-specific substance consumption rates and sociodemographics. Of the major sociodemographic variables extracted from the 5 year American Community Survey, the ratio of low income to high income population, the ratio of not married to married population, and the ratio of age 18–34 to age 35–69 population showed statistically significant positive correlations with the mean summed consumption rate of 26 substances (ρ = 0.886–0.943; p = 0.017–0.033), suggesting that disparities in household income, marital status, and age all affected substance consumption by the contributing populations. Specifically, low-income households (i.e., annual income < $45000), not married adults (including never married, widowed, and divorced), and individuals in their early adulthood (i.e., age 18–34) likely consumed a higher amount of antidepressants, antiepileptics, antihistamines, antihypertensives, opioids, and stimulants compared to high-income households, married adults, and individuals in their later adulthood (Fig. 2). In contrast, sociodemographic heterogeneity had no apparent effect on the consumption of other substances such as antibacterials, which was also in line with earlier findings.91 Presumably, predictive regression models could be developed for the consumption rates of specific substances or substance groups and sociodemographic determinants as demonstrated by a recent study in Australia,93 but the relatively small sample size in this study precluded model training and cross-validation.
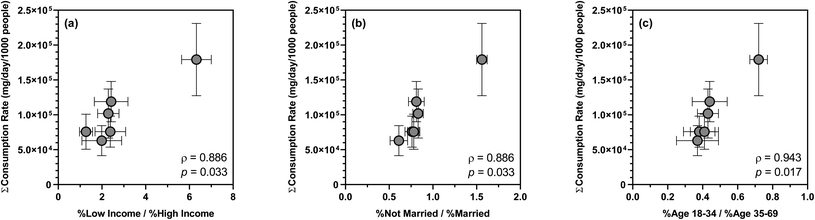 |
| | Fig. 2 Spearman correlations between the mean summed consumption rate of six substance groups and sociodemographics in sewersheds A–F between April 29 and July 15, 2020: (a) correlation between the mean summed consumption rate of six substance groups (i.e., the sum of antidepressants, antiepileptics, antihistamines, antihypertensives, synthetic opioids, and central nervous system stimulants) and the ratio of low income (including below/near poverty) to high income population. (b) Correlation between the mean summed consumption rate of six substance groups and the ratio of not married to married population. (c) Correlation between the mean summed consumption rate of six substance groups and the ratio of age 18–34 to age 35–69 population. Vertical error bars represent the standard deviation of the mean summed consumption rates of six substance groups (n = 12 for each sewershed). Horizontal error bars represent the margins of error of sociodemographic data extracted from the 5 year American Community Survey (2014–2018). | |
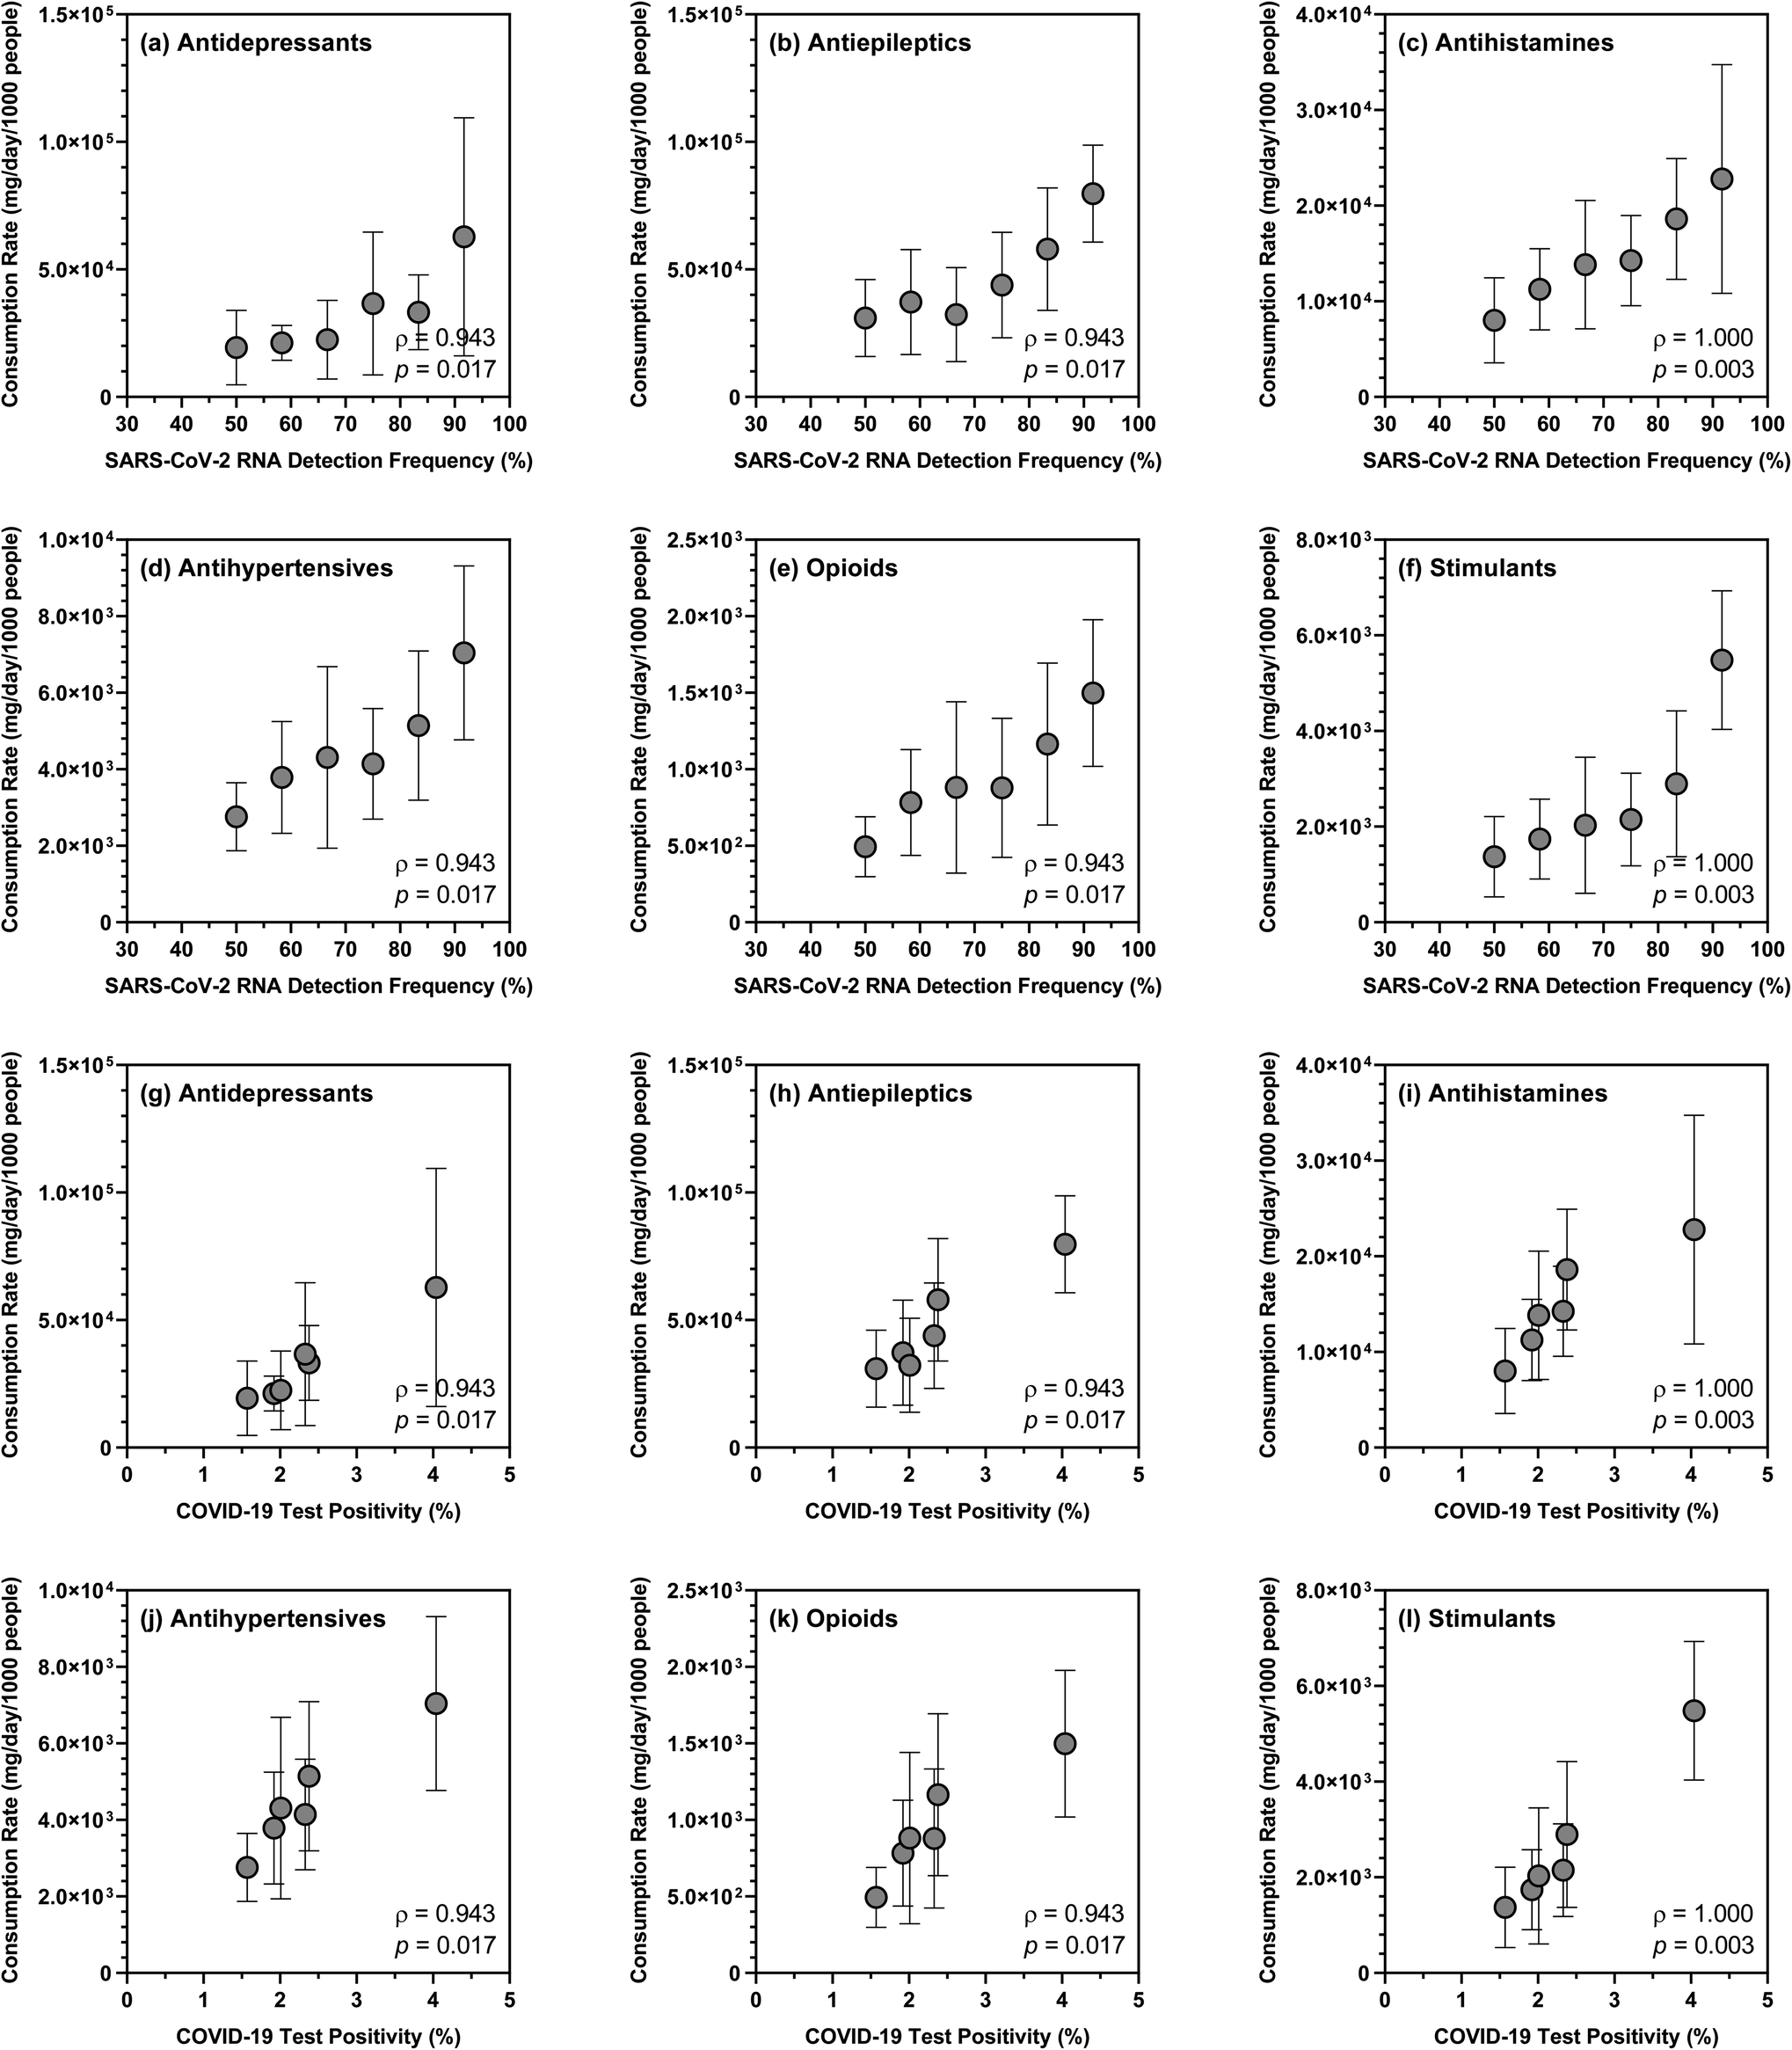
Over the sampling period, the mean summed consumption rate of 26 substances also exhibited positive correlations (ρ = 0.943; p = 0.017) with the detection frequency of SARS-CoV-2 RNA in wastewater samples (i.e., ranging from 50.0% to 91.7%) and the overall COVID-19 test positivity in the studied sewersheds (i.e., ranging from 1.57% to 4.04% based on COVID-19 case data provided by NYSDOH). Closer examination of the data revealed that the detection frequency of SARS-CoV-2 RNA and the overall COVID-19 test positivity showed strong correlations with the consumption rates of antidepressants, antiepileptics, antihypertensives, antihistamines, opioids, and stimulants (Fig. 3), which were not unexpected given that COVID-19 and substance use likely share common sociodemographic risk factors. However, generalization of these relationships would require expanding our pilot wastewater surveillance program to collect and analyze samples with a wider geographic and temporal coverage. The degree to which the consumption rates of specific substances or substance groups are indicative of population susceptibility to COVID-19 in any given sewershed also warrants further investigation with rigorous uncertainty assessment.
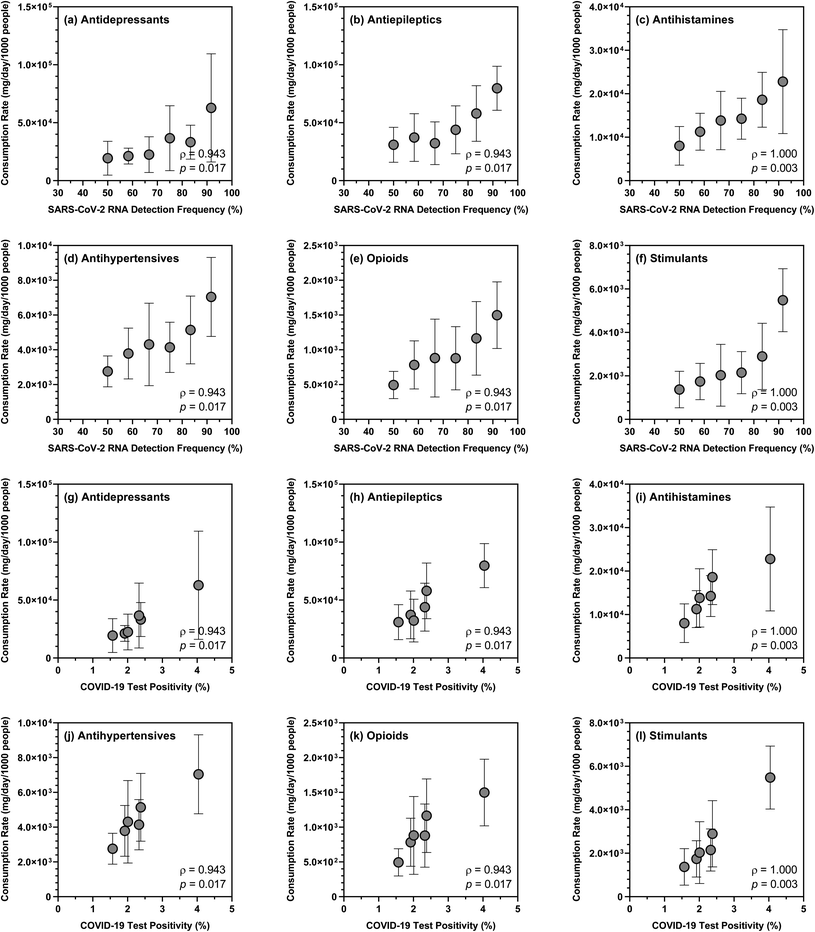 |
| | Fig. 3 Spearman correlations between the mean consumption rates of specific substance groups and the SARS-CoV-2 RNA detection frequency in wastewater samples or the COVID-19 test positivity in sewersheds A–F between April 29 and July 15, 2020: (a) correlation between the mean consumption rate of antidepressants (i.e., the sum of bupropion and venlafaxine) and the SARS-CoV-2 RNA detection frequency in wastewater samples (n = 12 for each sewershed). (b) Correlation between the mean consumption rate of antiepileptics (i.e., the sum of carbamazepine, gabapentin, lamotrigine, levetiracetam, and pregabalin) and the SARS-CoV-2 RNA detection frequency in wastewater samples (n = 12 for each sewershed). (c) Correlation between the mean consumption rate of antihistamines (i.e., the sum of cimetidine and diphenhydramine) and the SARS-CoV-2 RNA detection frequency in wastewater samples (n = 12 for each sewershed). (d) Correlation between the mean consumption rate of antihypertensives (i.e., the sum of atenolol and metoprolol) and the SARS-CoV-2 RNA detection frequency in wastewater samples (n = 12 for each sewershed). (e) Correlation between the mean consumption rate of synthetic opioids (i.e., the sum of methadone and tramadol) and the SARS-CoV-2 RNA detection frequency in wastewater samples (n = 12 for each sewershed). (f) Correlation between the mean consumption rate of central nervous system stimulants (i.e., the sum of amphetamine, cocaine, ephedrine, methamphetamine, and methylphenidate) and the SARS-CoV-2 RNA detection frequency in wastewater samples (n = 12 for each sewershed). (g) Correlation between the mean consumption rate of antidepressants and the COVID-19 test positivity in each sewershed. (h) Correlation between the mean consumption rate of antiepileptics and the COVID-19 test positivity in each sewershed. (i) Correlation between the mean consumption rate of antihistamines and the COVID-19 test positivity in each sewershed. (j) Correlation between the mean consumption rate of antihypertensives and the COVID-19 test positivity in each sewershed. (k) Correlation between the mean consumption rate of synthetic opioids and the COVID-19 test positivity in each sewershed. (l) Correlation between the mean consumption rate of central nervous system stimulants and the COVID-19 test positivity in each sewershed. Error bars represent the standard deviation of the mean consumption rates of specific substance groups (n = 12 for each sewershed). | |
Nontarget screening of unknown substances in wastewater
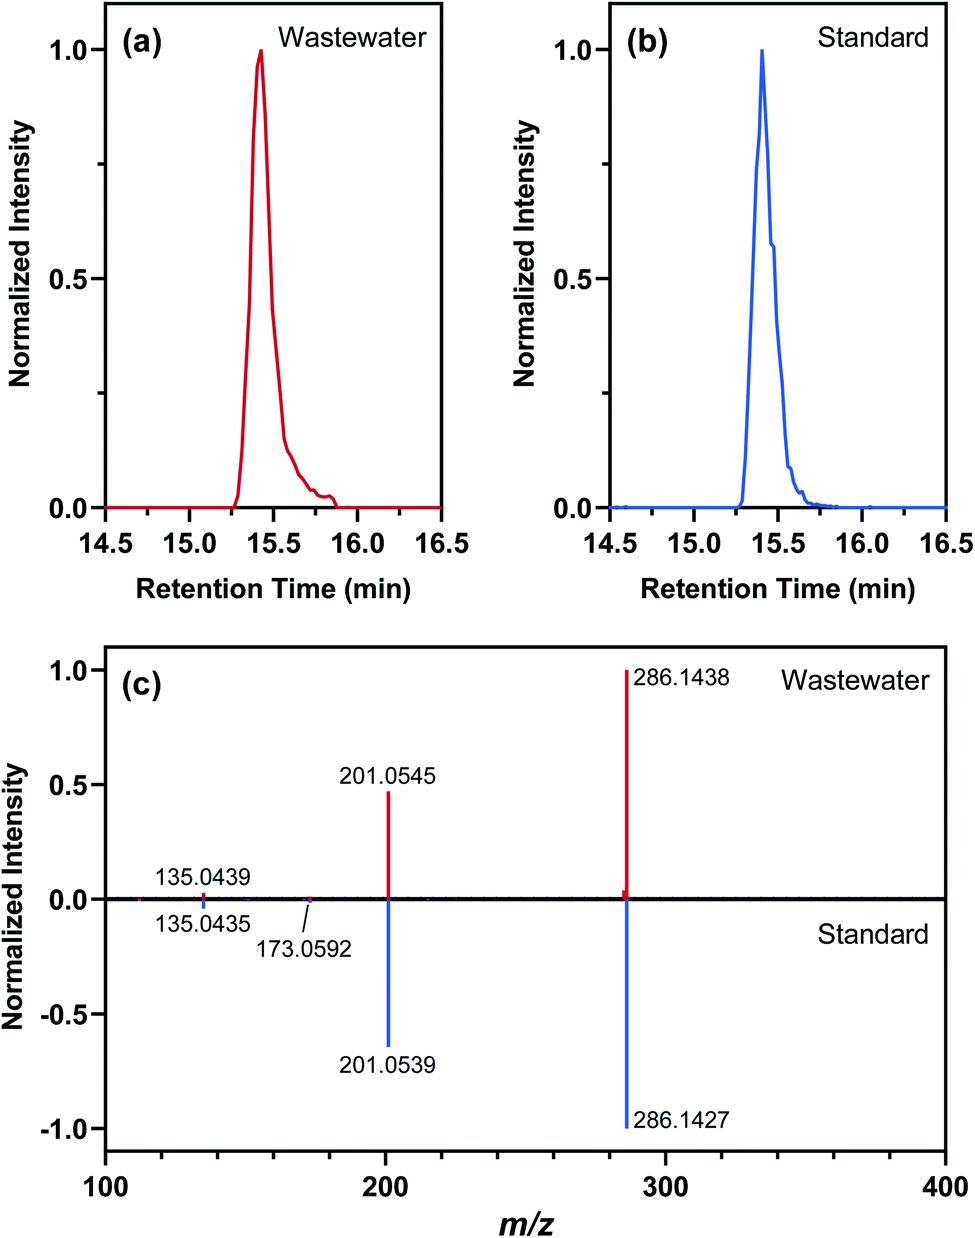
Nontarget screening filtered clusters of mass spectral features characterized by normalized peak intensities that tracked with SARS-CoV-2 RNA concentrations in WWTP A samples. Small relative standard deviations (<13%) in the absolute peak intensities of isotope-labeled internal standards spiked in WWTP A samples suggested that temporal variations in the peak intensities of these mass spectral features were likely not driven by matrix effects or instrumental drift, although such possibilities could not be completely ruled out.94,95 Few commonalities existed among the filtered mass spectral features as they occurred across a wide range of mass-to-charge ratios and retention times. Out of the 595 filtered mass spectral features, the normalized peak intensity profiles of 43 showed a TCC value of >0.95 (i.e., good similarity) with the concentration profile of SARS-CoV-2 RNA in corresponding wastewater samples. Further hierarchical clustering revealed that 11 of these high-TCC mass spectral features showed the closest similarity in temporal dynamics with SARS-CoV-2 RNA between April 29 and June 24, 2020 (Fig. 4). For example, one of the HCA-prioritized mass spectral features, m/z 286.1438, had a chromatographic retention time of 15.43 min and a dd-MS2 spectrum match factor of 91.5 to the mzCloud reference spectrum of piperine. This feature was subsequently confirmed as piperine by comparing its chromatographic retention time and MS2 spectrum in wastewater samples to those of piperine reference standard (Fig. 5). Piperine is a natural alkaloid in black pepper that possesses important therapeutic properties96 and has been proposed as a potential inhibitor of SARS-CoV-2 RNA-dependent RNA polymerase on the basis of molecular docking simulations.97 Only two previous studies reported the occurrence of piperine in wastewater98 or wastewater-impacted surface waters,99 but neither of them quantified its actual concentration. Like other 26 substances identified by suspect screening, piperine was ubiquitously present in wastewater sampled from the studied sewersheds (i.e., 100% detection frequency) based on a retrospective screening. Since no commercially available isotope-labeled analogue existed for piperine at the time of this study, the concentration of piperine in wastewater samples was determined semi-quantitatively (ranging from 22 to 2020 ng L−1) with reference to metolachlor-d6 considering its closest chromatographic retention time to piperine. Notably, the concentration of piperine in WWTP A samples collected between April 29 and June 24, 2020 correlated with the concentration of SARS-CoV-2 RNA (ρ = 0.970; p = 0.0006), as expected from the time trend of piperine peak intensities observed during this period. Nevertheless, this correlation does not imply causality and should not be extrapolated beyond the scope of this work without a mechanistic understanding of the covariation of piperine and SARS-CoV-2 RNA in wastewater other than the fact that both are excreted in feces.100,101 Follow-up in silico fragmentation efforts are also needed to provide meaningful annotations for other HCA-prioritized mass spectral features with time trends similar to that of SARS-CoV-RNA. Once confirmed with the authentic reference standards, extensive sampling and analytical efforts are required to evaluate whether any of these nontarget substances may serve as a proxy of SARS-CoV-2 RNA abundance in wastewater especially when evaluated against SARS-CoV-2 structural proteins.102 In short, nontarget screening holds good promise as a hypothesis-generating method for prioritizing unknown substances as possible wastewater biomarkers of SARS-CoV-2 RNA prevalence, although gaps in metabolomics and informatics approaches should be addressed in order to identify the most relevant candidates for in-depth investigations.
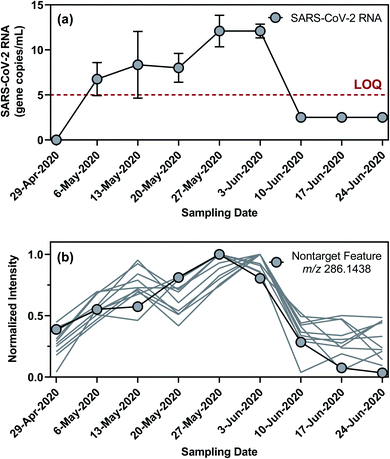 |
| | Fig. 4 Time trends of SARS-CoV-2 RNA and HCA-prioritized nontarget mass spectral features in a subset of WWTP A wastewater samples (n = 9): (a) concentration profile of SARS-CoV-2 RNA measured in WWTP A samples collected between April 29 and June 24, 2020. Note that no SARS-CoV-2 RNA was detectable in April 29 sample or samples collected beyond June 24, 2020. SARS-CoV-2 RNA was detectable in June 10, 17, and 24 samples at levels below the limit of quantification (i.e., the LOQ was 5 gene copies per mL at the time of this study), so the concentrations were assigned half of the LOQ (i.e., 2.5 gene copies per mL) for the purpose of time trend analysis. (b) Normalized intensity profiles of 11 nontarget mass spectral features, including m/z 286.1438, in WWTP A samples collected between April 29 and June 24, 2020. | |
 |
| | Fig. 5 Identification of piperine in wastewater: (a) extracted ion chromatogram of piperine in wastewater (May 13, 2020 sample from WWTP A). (b) Extracted ion chromatogram of piperine reference standard (200 ng L−1 in LC-MS grade methanol). (c) Head-to-tail plot of piperine MS2 spectra in wastewater and reference standard (acquired at a normalized collision energy of 30% using higher energy collision-induced dissociation). | |
Limitations and implications
The results of this proof-of-concept study should be interpreted with several limitations in mind. First, our online SPE-LC-HRMS method was less prone to supply chain disruptions (e.g., shortage of cartridges, sorbents, and solvents) during the pandemic but relied on the use of a C18 polar-endcapped reversed phase trap column, which could not effectively retain highly polar substances of potential interest. Complementing the current method with the use of mixed-bed multilayer trap columns103 is crucial for expanding the analytical window to cover a broader chemical space. Second, our mass load and substance use calculations did not explicitly account for the sorption of substances to suspended particulate matter or changes in the in-sewer fate and transport of substances due to shifts in sewer network characteristics (e.g., pH/temperature fluctuations, redox conditions, biofilm growth).66,81,85,104–108 Concurrent measurements of endogenous biomarkers (e.g., catecholamine metabolites109–112) may improve the characterization of near-real-time population dynamics but still require a calibration of wastewater-derived population data against census-based estimates (e.g., via the ongoing 2020 U.S. Census).113 Third, our sampling plan focused on centralized wastewater treatment systems in urban areas and did not include onsite or clustered treatment systems in rural or coastal communities (e.g., ∼22% of households in New York State are on septic systems114). Furthermore, only weekday samples were collected in this work despite known within-week variability in wastewater flow and substance consumption rates.115,116 Continuous and close-to-source sampling design (e.g., at specific sewer network nodes) should be implemented in the future to minimize biased data interpretation along spatial and temporal gradients. Lastly, our wastewater surveillance platform was not established until after the onset of the COVID-19 pandemic, which prevented us from evaluating the potential impact of COVID-19 on substance use patterns through wastewater analysis. For comparison purposes, nine archived wastewater samples collected from WWTP A during 2018 were analyzed along with samples collected during this study. Interestingly, the mass loads of antibacterials, antidepressants, antiepileptics, antihypertensives, antihistamines, opioids, and stimulants estimated using these archived samples were consistently lower than those estimated using the 2020 samples (Mann–Whitney test p < 0.0001). Such differences did not necessarily provide support for the hypothesis of increased substance consumption during the pandemic because long-term storage and freeze–thaw cycles might have led to the loss of analytes to varying degrees.117 Only wastewater samples collected and analyzed over the long term until immediately before the pandemic may provide a robust baseline assessment of substance use in the pre-COVID era.44
Despite the abovementioned limitations, our study demonstrated the versatility of high-throughput wastewater analysis for substance use assessment during the COVID-19 pandemic. Our analysis showed that the mean summed consumption rate of six major substance groups (i.e., antidepressants, antiepileptics, antihistamines, antihypertensives, synthetic opioids, and central nervous system stimulants) correlated with census-derived sociodemographic variables reflecting disparities in household income, marital status, and age distribution in the studied sewersheds. Our analysis also provided the first evidence that the mean summed consumption rate of these substance groups correlated with the detection frequency of SARS-CoV-2 RNA in wastewater as well as the COVID-19 test positivity during the sampling period, although the observed relationships were likely specific to the study region. Lastly, our nontarget screening workflow proved efficient in identifying unknown substances (i.e., piperine as an example) that covaried with SARS-CoV-2 RNA in wastewater for follow-up studies. Overall, preliminary findings from this study support the necessity of establishing regional and nationwide wastewater surveillance initiatives and the prospect of integrating wastewater analytics with epidemiological modeling to yield actionable public health insights.
Conflicts of interest
There are no conflicts to delcare.
Acknowledgements
We gratefully acknowledge wastewater treatment plant operators for their assistance in wastewater sampling despite severe logistical constraints during the pandemic. We thank Pruthvi Kilaru (Department of Public Health, Syracuse University) and Ariana Fenty (Department of Environmental and Forest Biology, SUNY-ESF) for coordinating sample delivery and processing. We also thank other team members of the SARS2 Early Warning Wastewater Surveillance Platform (SARS2-EWSP) for their support. We further thank the editor and anonymous reviewers for their constructive feedback. This work was supported by the Collaboration for Unprecedented Success and Excellence (CUSE) Grant Program administered by Syracuse University's Office of Research and the Faculty Fellows Program administered by the Syracuse Center of Excellence for Environmental and Energy Systems (SyracuseCoE) through an award from the New York State Department of Economic Development under Award Number #C150183.
References
- H. Asghar, O. M. Diop, G. Weldegebriel, F. Malik, S. Shetty, L. El Bassioni, A. O. Akande, E. Al Maamoun, S. Zaidi, A. J. Adeniji, C. C. Burns, J. Deshpande, M. S. Oberste and S. A. Lowther, Environmental surveillance for polioviruses in the Global Polio Eradication Initiative, J. Infect. Dis., 2014, 210(suppl. 1), S294–S303 CrossRef.
-
I. Xagoraraki and E. O'Brien, Wastewater-based epidemiology for early detection of viral outbreaks, in Women in Water Quality: Investigations by Prominent Female Engineers, ed. D. J. O'Bannon, Springer Nature Switzerland AG, Cham, Switzerland, 2019, pp. 75–97 Search PubMed.
- N. Sims and B. Kasprzyk-Hordern, Future perspectives of wastewater-based epidemiology: monitoring infectious disease spread and resistance to the community level, Environ. Int., 2020, 139, 105689 CrossRef.
- D. A. Burgard, C. Banta-Green and J. A. Field, Working upstream: how far can you go with sewage-based drug epidemiology?, Environ. Sci. Technol., 2014, 48(3), 1362–1368 CrossRef CAS.
- E. Gracia-Lor, S. Castiglioni, R. Bade, F. Been, E. Castrignanò, A. Covaci, I. González-Mariño, E. Hapeshi, B. Kasprzyk-Hordern, J. Kinyua, F. Y. Lai, T. Letzel, L. Lopardo, M. R. Meyer, J. O'Brien, P. Ramin, N. I. Rousis, A. Rydevik, Y. Ryu, M. M. Santos, I. Senta, N. S. Thomaidis, S. Veloutsou, Z. Yang, E. Zuccato and L. Bijlsma, Measuring biomarkers in wastewater as a new source of epidemiological information: current state and future perspectives, Environ. Int., 2017, 99, 131–150 CrossRef CAS.
-
P. M. Choi, K. V. Thomas, J. W. O'Brien and J. F. Mueller, Mining population exposure and community health via wastewater-based epidemiology, in A New Paradigm for Environmental Chemistry and Toxicology: From Concepts to Insights, ed. G. Jiang and X. Li, Springer Singapore, Singapore, 2020, pp. 99–114 Search PubMed.
- N. Fahrenfeld and K. J. Bisceglia, Sewer surveillance for monitoring antibiotic use and prevalence of antibiotic resistance: urban sewer epidemiology, Environ. Sci.: Water Res. Technol., 2016, 2(5), 788–799 RSC.
- R. S. Hendriksen, P. Munk, P. Njage, B. van Bunnik, L. McNally, O. Lukjancenko, T. Röder, D. Nieuwenhuijse, S. K. Pedersen, J. Kjeldgaard, R. S. Kaas, P. T. L. C. Clausen, J. K. Vogt, P. Leekitcharoenphon, M. G. M. van de Schans, T. Zuidema, A. M. de Roda Husman, S. Rasmussen, B. Petersen, A. Bego, C. Rees, S. Cassar, K. Coventry, P. Collignon, F. Allerberger, T. O. Rahube, G. Oliveira, I. Ivanov, Y. Vuthy, T. Sopheak, C. K. Yost, C. Ke, H. Zheng, L. Baisheng, X. Jiao, P. Donado-Godoy, K. J. Coulibaly, M. Jergović, J. Hrenovic, R. Karpíšková, J. E. Villacis, M. Legesse, T. Eguale, A. Heikinheimo, L. Malania, A. Nitsche, A. Brinkmann, C. K. S. Saba, B. Kocsis, N. Solymosi, T. R. Thorsteinsdottir, A. M. Hatha, M. Alebouyeh, D. Morris, M. Cormican, L. O'Connor, J. Moran-Gilad, P. Alba, A. Battisti, Z. Shakenova, C. Kiiyukia, E. Ng'eno, L. Raka, J. Avsejenko, A. Bērziņš, V. Bartkevics, C. Penny, H. Rajandas, S. Parimannan, M. V. Haber, P. Pal, G.-J. Jeunen, N. Gemmell, K. Fashae, R. Holmstad, R. Hasan, S. Shakoor, M. L. Z. Rojas, D. Wasyl, G. Bosevska, M. Kochubovski, C. Radu, A. Gassama, V. Radosavljevic, S. Wuertz, R. Zuniga-Montanez, M. Y. F. Tay, D. Gavačová, K. Pastuchova, P. Truska, M. Trkov, K. Esterhuyse, K. Keddy, M. Cerdà-Cuéllar, S. Pathirage, L. Norrgren, S. Örn, D. G. J. Larsson, T. V. d. Heijden, H. H. Kumburu, B. Sanneh, P. Bidjada, B.-M. Njanpop-Lafourcade, S. C. Nikiema-Pessinaba, B. Levent, J. S. Meschke, N. K. Beck, C. D. Van, N. D. Phuc, D. M. N. Tran, G. Kwenda, D.-a. Tabo, A. L. Wester, S. Cuadros-Orellana, C. Amid, G. Cochrane, T. Sicheritz-Ponten, H. Schmitt, J. R. M. Alvarez, A. Aidara-Kane, S. J. Pamp, O. Lund, T. Hald, M. Woolhouse, M. P. Koopmans, H. Vigre, T. N. Petersen and F. M. Aarestrup, The Global Sewage Surveillance project consortium, global monitoring of antimicrobial resistance based on metagenomics analyses of urban sewage, Nat. Commun., 2019, 10(1), 1124 CrossRef.
- F. Wu, J. Zhang, A. Xiao, X. Gu, W. L. Lee, F. Armas, K. Kauffman, W. Hanage, M. Matus, N. Ghaeli, N. Endo, C. Duvallet, M. Poyet, K. Moniz, A. D. Washburne, T. B. Erickson, P. R. Chai, J. Thompson and E. J. Alm, SARS-CoV-2 titers in wastewater are higher than expected from clinically confirmed cases, mSystems, 2020, 5(4), e00614-20 CrossRef.
- G. Medema, L. Heijnen, G. Elsinga, R. Italiaander and A. Brouwer, Presence of SARS-Coronavirus-2 RNA in sewage and correlation with reported COVID-19 prevalence in the early stage of the epidemic in the Netherlands, Environ. Sci. Technol. Lett., 2020, 7(7), 511–516 CrossRef CAS.
- W. Ahmed, N. Angel, J. Edson, K. Bibby, A. Bivins, J. W. O'Brien, P. M. Choi, M. Kitajima, S. L. Simpson, J. Li, B. Tscharke, R. Verhagen, W. J. M. Smith, J. Zaugg, L. Dierens, P. Hugenholtz, K. V. Thomas and J. F. Mueller, First confirmed detection of SARS-CoV-2 in untreated wastewater in Australia: a proof of concept for the wastewater surveillance of COVID-19 in the community, Sci. Total Environ., 2020, 728, 138764 CrossRef CAS.
- A. Nemudryi, A. Nemudraia, T. Wiegand, K. Surya, M. Buyukyoruk, C. Cicha, K. K. Vanderwood, R. Wilkinson and B. Wiedenheft, Temporal detection and phylogenetic assessment of SARS-CoV-2 in municipal wastewater, Cell Rep. Medicine, 2020, 1(6), 100098 CrossRef.
- J. Peccia, A. Zulli, D. E. Brackney, N. D. Grubaugh, E. H. Kaplan, A. Casanovas-Massana, A. I. Ko, A. A. Malik, D. Wang, M. Wang, J. L. Warren, D. M. Weinberger, W. Arnold and S. B. Omer, Measurement of SARS-CoV-2 RNA in wastewater tracks community infection dynamics, Nat. Biotechnol., 2020, 38(10), 1164–1167 CrossRef CAS.
- J. Trottier, R. Darques, N. Ait Mouheb, E. Partiot, W. Bakhache, M. S. Deffieu and R. Gaudin, Post-lockdown detection of SARS-CoV-2 RNA in the wastewater of Montpellier, France, One Health, 2020, 10, 100157 CrossRef.
- O. E. Hart and R. U. Halden, Computational analysis of SARS-CoV-2/COVID-19 surveillance by wastewater-based epidemiology locally and globally: feasibility, economy, opportunities and challenges, Sci. Total Environ., 2020, 730, 138875 CrossRef CAS.
- G. La Rosa, M. Iaconelli, P. Mancini, G. Bonanno Ferraro, C. Veneri, L. Bonadonna, L. Lucentini and E. Suffredini, First detection of SARS-CoV-2 in untreated wastewaters in Italy, Sci. Total Environ., 2020, 736, 139652 CrossRef CAS.
- G. La Rosa, P. Mancini, G. Bonanno Ferraro, C. Veneri, M. Iaconelli, L. Bonadonna, L. Lucentini and E. Suffredini, SARS-CoV-2 has been circulating in northern Italy since December 2019: evidence from environmental monitoring, Sci. Total Environ., 2021, 750, 141711 CrossRef CAS.
- S. Westhaus, F.-A. Weber, S. Schiwy, V. Linnemann, M. Brinkmann, M. Widera, C. Greve, A. Janke, H. Hollert, T. Wintgens and S. Ciesek, Detection of SARS-CoV-2 in raw and treated wastewater in Germany – suitability for COVID-19 surveillance and potential transmission risks, Sci. Total Environ., 2020, 141750 Search PubMed.
- W. Randazzo, P. Truchado, E. Cuevas-Ferrando, P. Simón, A. Allende and G. Sánchez, SARS-CoV-2 RNA in wastewater anticipated COVID-19 occurrence in a low prevalence area, Water Res., 2020, 181, 115942 CrossRef CAS.
- M. Kumar, A. K. Patel, A. V. Shah, J. Raval, N. Rajpara, M. Joshi and C. G. Joshi, First proof of the capability of wastewater surveillance for COVID-19 in India through detection of genetic material of SARS-CoV-2, Sci. Total Environ., 2020, 746, 141326 CrossRef CAS.
- S. P. Sherchan, S. Shahin, L. M. Ward, S. Tandukar, T. G. Aw, B. Schmitz, W. Ahmed and M. Kitajima, First detection of SARS-CoV-2 RNA in wastewater in North America: a study in Louisiana, USA, Sci. Total Environ., 2020, 743, 140621 CrossRef CAS.
- R. Gonzalez, K. Curtis, A. Bivins, K. Bibby, M. H. Weir, K. Yetka, H. Thompson, D. Keeling, J. Mitchell and D. Gonzalez, COVID-19 surveillance in Southeastern Virginia using wastewater-based epidemiology, Water Res., 2020, 186, 116296 CrossRef CAS.
- B. Miyani, X. Fonoll, J. Norton, A. Mehrotra and I. Xagoraraki, SARS-CoV-2 in Detroit wastewater, J. Environ. Eng., 2020, 146(11), 06020004 CrossRef CAS.
- J. Martin, D. Klapsa, T. Wilton, M. Zambon, E. Bentley, E. Bujaki, M. Fritzsche, R. Mate and M. Majumdar, Tracking SARS-CoV-2 in sewage: evidence of changes in virus variant predominance during COVID-19 pandemic, Viruses, 2020, 12(10), 1144 CrossRef.
- Q. Q. Wang, D. C. Kaelber, R. Xu and N. D. Volkow, COVID-19 risk and outcomes in patients with substance use disorders: analyses from electronic health records in the United States, Mol. Psychiatry, 2020 DOI:10.1038/s41380-020-00880-7.
- W. B. Jemberie, J. S. Williams, M. Eriksson, A.-S. Grönlund, N. Ng, M. B. Nilsson, M. Padyab, K. C. Priest, M. Sandlund, F. Snellman, D. McCarty and L. M. Lundgren, Substance use disorders and COVID-19: multi-faceted problems which require multi-pronged solutions, Front. Mol. Psychiatry, 2020, 11, 714 CrossRef.
- Y. Wei and R. Shah, Substance use disorder in the COVID-19 pandemic: a systematic review of vulnerabilities and complications, Pharmaceuticals, 2020, 13(7) DOI:10.3390/ph13070155.
- F. Zhou, T. Yu, R. Du, G. Fan, Y. Liu, Z. Liu, J. Xiang, Y. Wang, B. Song, X. Gu, L. Guan, Y. Wei, H. Li, X. Wu, J. Xu, S. Tu, Y. Zhang, H. Chen and B. Cao, Clinical course and risk factors for mortality of adult inpatients with COVID-19 in Wuhan, China: a retrospective cohort study, Lancet, 2020, 395(10229), 1054–1062 CrossRef CAS.
- Z. Wu and J. M. McGoogan, Characteristics of and important lessons from the coronavirus disease 2019 (COVID-19) outbreak in China: summary of a report of 72,314 cases from the Chinese Center for Disease Control and Prevention, JAMA, 2020, 323(13), 1239–1242 CrossRef CAS.
- S. Richardson, J. S. Hirsch, M. Narasimhan, J. M. Crawford, T. McGinn, K. W. Davidson and Consortium, a. t. N. C.-R., Presenting characteristics, comorbidities, and outcomes among 5700 patients hospitalized with COVID-19 in the New York City area, JAMA, 2020, 323(20), 2052–2059 CrossRef CAS.
- G. Grasselli, A. Zangrillo, A. Zanella, M. Antonelli, L. Cabrini, A. Castelli, D. Cereda, A. Coluccello, G. Foti, R. Fumagalli, G. Iotti, N. Latronico, L. Lorini, S. Merler, G. Natalini, A. Piatti, M. V. Ranieri, A. M. Scandroglio, E. Storti, M. Cecconi, A. Pesenti and Network, f. t. C.-L. I., Baseline characteristics and outcomes of 1591 patients infected with SARS-CoV-2 admitted to ICUs of the Lombardy Region, Italy, JAMA, 2020, 323(16), 1574–1581 CrossRef CAS.
- M. Webb Hooper, A. M. Nápoles and E. J. Pérez-Stable, COVID-19 and racial/ethnic disparities, JAMA, 2020, 323(24), 2466–2467 CrossRef.
- C. W. Yancy, COVID-19 and African Americans, JAMA, 2020, 323(19), 1891–1892 CrossRef CAS.
- S. M. Hatcher, C. Agnew-Brune, M. Anderson, L. D. Zambrano, C. E. Rose, M. A. Jim, A. Baugher, G. S. Liu, S. V. Patel, M. E. Evans, T. Pindyck, C. L. Dubray, J. J. Rainey, J. Chen, C. Sadowski, K. Winglee, A. Penman-Aguilar, A. Dixit, E. Claw, C. Parshall, E. Provost, A. Ayala, G. Gonzalez, J. Ritchey, J. Davis, V. Warren-Mears, S. Joshi, T. Weiser, A. Echo-Hawk, A. Dominguez, A. Poel, C. Duke, I. Ransby, A. Apostolou and J. McCollum, COVID-19 among American Indian and Alaska Native persons - 23 States, January 31-July 3, 2020, Morb. Mortal. Wkly. Rep., 2020, 69(34), 1166–1169 CrossRef CAS.
- A. v. Dorn, R. E. Cooney and M. L. Sabin, COVID-19 exacerbating inequalities in the US, Lancet, 2020, 395(10232), 1243–1244 CrossRef CAS.
- M. L. Wang, P. Behrman, A. Dulin, M. L. Baskin, J. Buscemi, K. I. Alcaraz, C. M. Goldstein, T. L. Carson, M. Shen and M. Fitzgibbon, Addressing inequities in COVID-19 morbidity and mortality: research and policy recommendations, Transl. Behav. Med., 2020, 10(3), 516–519 CrossRef.
- A. Mourad, N. A. Turner, A. W. Baker, N. L. Okeke, S. Narayanasamy, R. Rolfe, J. J. Engemann, G. M. Cox and J. E. Stout, Social disadvantage, politics, and SARS-CoV-2 trends: a county-level analysis of United States data, Clin. Infect. Dis., 2020 DOI:10.1093/cid/ciaa1374.
-
A. R. Winstock, E. L. Davies, G. Gilchrist, A. Zhuparris, J. A. Ferris, L. J. Maier and M. J. Barratt, Global Drug Survey special edition on COVID-19 global interim report, Global Drug Survey (GDS), London, 2020 Search PubMed.
- N. D. Volkow, Collision of the COVID-19 and addiction epidemics, Ann. Intern. Med., 2020, 173(1), 61–62 CrossRef.
- J. M. Sanders, M. L. Monogue, T. Z. Jodlowski and J. B. Cutrell, Pharmacologic treatments for coronavirus disease 2019 (COVID-19): a review, JAMA, 2020, 323(18), 1824–1836 CAS.
- T. M. Rawson, L. S. P. Moore, N. Zhu, N. Ranganathan, K. Skolimowska, M. Gilchrist, G. Satta, G. Cooke and A. Holmes, Bacterial and fungal coinfection in individuals with coronavirus: a rapid review to support COVID-19 antimicrobial prescribing, Clin. Infect. Dis., 2020 DOI:10.1093/cid/ciaa530.
- S. Slavova, P. Rock, H. M. Bush, D. Quesinberry and S. L. Walsh, Signal of increased opioid overdose during COVID-19 from emergency medical services data, Drug Alcohol Depend., 2020, 214, 108176 CrossRef CAS.
- T. A. Ochalek, K. L. Cumpston, B. K. Wills, T. S. Gal and F. G. Moeller, Nonfatal opioid overdoses at an urban emergency department during the COVID-19 pandemic, JAMA, 2020 DOI:10.1001/jama.2020.17477.
- R. Bade, B. S. Simpson, M. Ghetia, L. Nguyen, J. M. White and C. Gerber, Changes in alcohol consumption associated with social distancing and self-isolation policies triggered by COVID-19 in South Australia: a wastewater analysis study, Addiction, 2020 DOI:10.1111/add.15256.
- A. C. Chiaia, C. Banta-Green and J. Field, Eliminating solid phase extraction with large-volume injection LC/MS/MS: analysis of illicit and legal drugs and human urine indicators in US wastewaters, Environ. Sci. Technol., 2008, 42(23), 8841–8848 CrossRef CAS.
- C. Postigo, M. J. Lopez de Alda and D. Barceló, Fully automated determination in the low nanogram per liter level of different classes of drugs of abuse in sewage water by on-line chromatography–electrospray–tandem mass spectrometry, Anal. Chem., 2008, 80(9), 3123–3134 CrossRef CAS.
- N. V. Heuett, C. E. Ramirez, A. Fernandez and P. R. Gardinali, Analysis of drugs of abuse by online SPE-LC high resolution mass spectrometry: communal assessment of consumption, Sci. Total Environ., 2015, 511, 319–330 CrossRef CAS.
- B. Yao, L. Lian, W. Pang, D. Yin, S.-A. Chan and W. Song, Determination of illicit drugs in aqueous environmental samples by online solid-phase extraction coupled to liquid chromatography–tandem mass spectrometry, Chemosphere, 2016, 160, 208–215 CrossRef CAS.
- E. López-García, N. Mastroianni, C. Postigo, D. Barceló and M. López de Alda, A fully automated approach for the analysis of 37 psychoactive substances in raw wastewater based on on-line solid phase extraction-liquid chromatography-tandem mass spectrometry, J. Chromatogr. A, 2018, 1576, 80–89 CrossRef.
- D. Pasin, A. Cawley, S. Bidny and S. Fu, Current applications of high-resolution mass spectrometry for the analysis of new psychoactive substances: a critical review, Anal. Bioanal. Chem., 2017, 409(25), 5821–5836 CrossRef CAS.
- M. J. Andrés-Costa, V. Andreu and Y. Picó, Liquid chromatography–mass spectrometry as a tool for wastewater-based epidemiology: assessing new psychoactive substances and other human biomarkers, TrAC, Trends Anal. Chem., 2017, 94, 21–38 CrossRef.
- N. Salgueiro-González, S. Castiglioni, E. Gracia-Lor, L. Bijlsma, A. Celma, R. Bagnati, F. Hernández and E. Zuccato, Flexible high resolution-mass spectrometry approach for screening new psychoactive substances in urban wastewater, Sci. Total Environ., 2019, 689, 679–690 CrossRef.
- A. Causanilles, J. Kinyua, C. Ruttkies, A. L. N. van Nuijs, E. Emke, A. Covaci and P. de Voogt, Qualitative screening for new psychoactive substances in wastewater collected during a city festival using liquid chromatography coupled to high-resolution mass spectrometry, Chemosphere, 2017, 184, 1186–1193 CrossRef CAS.
- K. Diamanti, R. Aalizadeh, N. Alygizakis, A. Galani, M. Mardal and N. S. Thomaidis, Wide-scope target and suspect screening methodologies to investigate the occurrence of new psychoactive substances in influent wastewater from Athens, Sci. Total Environ., 2019, 685, 1058–1065 CrossRef CAS.
- F. Hernández, L. Bijlsma, J. V. Sancho, R. Díaz and M. Ibáñez, Rapid wide-scope screening of drugs of abuse, prescription drugs with potential for abuse and their metabolites in influent and effluent urban wastewater by ultrahigh pressure liquid chromatography–quadrupole-time-of-flight-mass spectrometry, Anal. Chim. Acta, 2011, 684(1), 96–106 CrossRef.
- J. A. Baz-Lomba, M. J. Reid and K. V. Thomas, Target and suspect screening of psychoactive substances in sewage-based samples by UHPLC-QTOF, Anal. Chim. Acta, 2016, 914, 81–90 CrossRef CAS.
-
New York State Department of Health, Bureau of Surveillance and Data Systems, New York State Statewide COVID-19 Testing, New York State Department of Health, Albany, NY, 2020, https://health.data.ny.gov/Health/New-York-State-Statewide-COVID-19-Testing/xdss-u53e Search PubMed.
- K. E. Kapo, M. Paschka, R. Vamshi, M. Sebasky and K. McDonough, Estimation of U.S. sewer residence time distributions for national-scale risk assessment of down-the-drain chemicals, Sci. Total Environ., 2017, 603–604, 445–452 CrossRef CAS.
- H. C. Green, M. L. Wilder, F. A. Middleton, M. B. Collins, A. Fenty, K. L. Gentile, B. L. Kmush, T. Zeng and D. A. Larsen, Quantification of SARS-CoV-2 and cross-assembly phage (crAssphage) from wastewater to monitor coronavirus transmission within communities, medRxiv, 2020 DOI:10.1101/2020.05.21.20109181.
- S. Wang, M. Matt, B. L. Murphy, M. Perkins, D. A. Matthews, S. D. Moran and T. Zeng, Organic micropollutants in New York lakes: a statewide citizen science occurrence study, Environ. Sci. Technol., 2020 DOI:10.1021/acs.est.0c04775.
-
HighChem Ltd, mzCloud – Advanced Mass Spectral Database, https://www.mzcloud.org/ Search PubMed.
-
N. E. Helwig, multiway: Component Models for Multi-Way Data (R package version 1.0-6), 2019 Search PubMed.
- U. Lorenzo-Seva and J. M. F. ten Berge, Tucker's congruence coefficient as a meaningful index of factor similarity, Methodology, 2006, 2(2), 57–64 CrossRef.
-
A. Kassambara and F. Mundt, factoextra: Extract and Visualize the Results of Multivariate Data Analyses (R package version 1.0.7.), 2020 Search PubMed.
- D. R. Baker, L. Barron and B. Kasprzyk-Hordern, Illicit and pharmaceutical drug consumption estimated via wastewater analysis. Part A: chemical analysis and drug use estimates, Sci. Total Environ., 2014, 487, 629–641 CrossRef CAS.
- P. M. Choi, J. Li, J. Gao, J. W. O'Brien, K. V. Thomas, P. K. Thai, G. Jiang and J. F. Mueller, Considerations for assessing stability of wastewater-based epidemiology biomarkers using biofilm-free and sewer reactor tests, Sci. Total Environ., 2020, 709, 136228 CrossRef CAS.
- P. K. Thai, G. Jiang, W. Gernjak, Z. Yuan, F. Y. Lai and J. F. Mueller, Effects of sewer conditions on the degradation of selected illicit drug residues in wastewater, Water Res., 2014, 48, 538–547 CrossRef CAS.
- S. Castiglioni, L. Bijlsma, A. Covaci, E. Emke, F. Hernández, M. Reid, C. Ort, K. V. Thomas, A. L. N. van Nuijs, P. de Voogt and E. Zuccato, Evaluation of uncertainties associated with the determination of community drug use through the measurement of sewage drug biomarkers, Environ. Sci. Technol., 2013, 47(3), 1452–1460 CrossRef CAS.
- R. A. Dave and M. E. Morris, A quantitative threshold for high/low extent of urinary excretion of compounds in humans, Biopharm. Drug Dispos., 2016, 37(5), 287–309 CrossRef CAS.
- E. Gracia-Lor, E. Zuccato and S. Castiglioni, Refining correction factors for back-calculation of illicit drug use, Sci. Total Environ., 2016, 573, 1648–1659 CrossRef CAS.
- E. Gracia-Lor, N. I. Rousis, E. Zuccato, R. Bade, J. A. Baz-Lomba, E. Castrignanò, A. Causanilles, F. Hernández, B. Kasprzyk-Hordern, J. Kinyua, A.-K. McCall, A. L. N. van Nuijs, B. G. Plósz, P. Ramin, Y. Ryu, M. M. Santos, K. Thomas, P. de Voogt, Z. Yang and S. Castiglioni, Estimation of caffeine intake from analysis of caffeine metabolites in wastewater, Sci. Total Environ., 2017, 609, 1582–1588 CrossRef CAS.
- N. S. Thomaidis, P. Gago-Ferrero, C. Ort, N. C. Maragou, N. A. Alygizakis, V. L. Borova and M. E. Dasenaki, Reflection of socioeconomic changes in wastewater: licit and illicit drug use patterns, Environ. Sci. Technol., 2016, 50(18), 10065–10072 CrossRef CAS.
- Z. Dong, D. B. Senn, R. E. Moran and J. P. Shine, Prioritizing environmental risk of prescription pharmaceuticals, Regul. Toxicol. Pharmacol., 2013, 65(1), 60–67 CrossRef CAS.
- K. Y. Kim and J.-E. Oh, Evaluation of pharmaceutical abuse and illicit drug use in South Korea by wastewater-based epidemiology, J. Hazard. Mater., 2020, 396, 122622 CrossRef CAS.
- P. K. Thai, J. W. O'Brien, B. J. Tscharke and J. F. Mueller, Analyzing wastewater samples collected during Census to determine the correction factors of drugs for wastewater-based epidemiology: the case of codeine and methadone, Environ. Sci. Technol. Lett., 2019, 6(5), 265–269 CrossRef CAS.
- P. K. Thai, F. Y. Lai, R. Bruno, E. van Dyken, W. Hall, J. O'Brien, J. Prichard and J. F. Mueller, Refining the excretion factors of methadone and codeine for wastewater analysis — combining data from pharmacokinetic and wastewater studies, Environ. Int., 2016, 94, 307–314 CrossRef CAS.
- T. Boogaerts, M. Degreef, A. Covaci and A. L. N. van Nuijs, Development and validation of an analytical procedure to detect spatio-temporal differences in antidepressant use through a wastewater-based approach, Talanta, 2019, 200, 340–349 CrossRef CAS.
- N. Bishop, T. Jones-Lepp, M. Margetts, J. Sykes, D. Alvarez and D. E. Keil, Wastewater-based epidemiology pilot study to examine drug use in the Western United States, Sci. Total Environ., 2020, 140697 CrossRef CAS.
- B. A. Magnuson, M. C. Carakostas, N. H. Moore, S. P. Poulos and A. G. Renwick, Biological fate of low-calorie sweeteners, Nutr. Rev., 2016, 74(11), 670–689 CrossRef.
- G. Medema, F. Been, L. Heijnen and S. Petterson, Implementation of environmental surveillance for SARS-CoV-2 virus to support public health decisions: Opportunities and challenges, Curr. Opin. Environ. Sci. Health, 2020 DOI:10.1016/j.coesh.2020.09.006.
-
B. Subedi, Uncertainties associated with wastewater-based epidemiology for the estimation of community consumption of drugs, in Wastewater-Based Epidemiology: Estimation of Community Consumption of Drugs and Diets, ed. B. Subedi, D. A. Burgard and B. G. Loganathan, American Chemical Society, Washington, DC, 2019, vol. 1319, pp. 79–98 Search PubMed.
-
K. Walker, M. Herman and K. Eberwein, tidycensus: Load US Census Boundary and Attribute Data as 'tidyverse' and 'sf'-Ready Data Frames (R package version 0.10.2), 2020 Search PubMed.
-
K. Walker, tigris: Load Census TIGER/Line Shapefiles (R package version 1.0), 2020 Search PubMed.
- P. M. Choi, B. J. Tscharke, E. Donner, J. W. O'Brien, S. C. Grant, S. L. Kaserzon, R. Mackie, E. O'Malley, N. D. Crosbie, K. V. Thomas and J. F. Mueller, Wastewater-based epidemiology biomarkers: past, present and future, TrAC, Trends Anal. Chem., 2018, 105, 453–469 CrossRef CAS.
- B. Subedi and K. Kannan, Mass loading and removal of select illicit drugs in two wastewater treatment plants in New York State and estimation of illicit drug usage in communities through wastewater analysis, Environ. Sci. Technol., 2014, 48(12), 6661–6670 CrossRef CAS.
- B. Subedi and K. Kannan, Occurrence and fate of select psychoactive pharmaceuticals and antihypertensives in two wastewater treatment plants in New York State, USA, Sci. Total Environ., 2015, 514, 273–280 CrossRef CAS.
-
S. Pagsuyoin, J. Luo and D. Bello, Detection in sewage and community consumption of stimulant drugs in northeastern United States, in Wastewater-Based Epidemiology: Estimation of Community Consumption of Drugs and Diets, ed. B. Subedi, D. A. Burgard and B. G. Loganathan, American Chemical Society, Washington, D.C., 2019, vol. 1319, pp. 167–183 Search PubMed.
- D. C. Mitchell, C. A. Knight, J. Hockenberry, R. Teplansky and T. J. Hartman, Beverage caffeine intakes in the U.S, Food Chem. Toxicol., 2014, 63, 136–142 CrossRef CAS.
- A. C. Sylvetsky and K. I. Rother, Trends in the consumption of low-calorie sweeteners, Physiol. Behav., 2016, 164, 446–450 CrossRef CAS.
- B. Subedi and K. Kannan, Fate of artificial sweeteners in wastewater treatment plants in New York State, U.S.A., Environ. Sci. Technol., 2014, 48(23), 13668–13674 CrossRef CAS.
- P. M. Choi, B. Tscharke, S. Samanipour, W. D. Hall, C. E. Gartner, J. F. Mueller, K. V. Thomas and J. W. O'Brien, Social, demographic, and economic correlates of food and chemical consumption measured by wastewater-based epidemiology, Proc. Natl. Acad. Sci. U. S. A., 2019, 116(43), 21864–21873 CrossRef CAS.
- Y. Zhang, L. Duan, B. Wang, Y. Du, G. Cagnetta, J. Huang, L. Blaney and G. Yu, Wastewater-based epidemiology in Beijing, China: prevalence of antibiotic use in flu season and association of pharmaceuticals and personal care products with socioeconomic characteristics, Environ. Int., 2019, 125, 152–160 CrossRef CAS.
- P. M. Choi, J. W. O'Brien, B. J. Tscharke, J. F. Mueller, K. V. Thomas and S. Samanipour, Population socioeconomics predicted using wastewater, Environ. Sci. Technol. Lett., 2020, 7(8), 567–572 CrossRef CAS.
- G. Nürenberg, M. Schulz, U. Kunkel and T. A. Ternes, Development and validation of a generic nontarget method based on liquid chromatography – high resolution mass spectrometry analysis for the evaluation of different wastewater treatment options, J. Chromatogr. A, 2015, 1426, 77–90 CrossRef.
- K. Purschke, M. Vosough, J. Leonhardt, M. Weber and T. C. Schmidt, Evaluation of nontarget long-term LC–HRMS time series data using multivariate statistical approaches, Anal. Chem., 2020, 92(18), 12273–12281 CrossRef CAS.
- I.-U. Haq, M. Imran, M. Nadeem, T. Tufail, T. A. Gondal and M. S. Mubarak, Piperine: a review of its biological effects, Phytother. Res., 2020 DOI:10.1002/ptr.6855.
- J. M. Gutierrez-Villagomez, T. Campos-García, J. Molina-Torres, M. G. López and J. Vázquez-Martínez, Alkamides and piperamides as potential antivirals against the severe acute respiratory syndrome coronavirus 2 (SARS-CoV-2), J. Phys. Chem. Lett., 2020, 11(19), 8008–8016 CrossRef CAS.
- I. González-Mariño, J. B. Quintana, I. Rodríguez, M. González-Díez and R. Cela, Screening and selective quantification of illicit drugs in wastewater by mixed-mode solid-phase extraction and quadrupole-time-of-flight liquid chromatography–mass spectrometry, Anal. Chem., 2012, 84(3), 1708–1717 CrossRef.
- J. A. Pemberton, C. E. M. Lloyd, C. J. Arthur, P. J. Johnes, M. Dickinson, A. J. Charlton and R. P. Evershed, Untargeted characterisation of dissolved organic matter contributions to rivers from anthropogenic point sources using direct-infusion and high-performance liquid chromatography/Orbitrap mass spectrometry, Rapid Commun. Mass Spectrom., 2020, 34(S4), e8618 CAS.
- B. Ganesh Bhat and N. Chandrasekhara, Studies on the metabolism of piperine: absorption, tissue distribution and excretion of urinary conjugates in rats, Toxicology, 1986, 40(1), 83–92 CrossRef.
- P. Foladori, F. Cutrupi, N. Segata, S. Manara, F. Pinto, F. Malpei, L. Bruni and G. La Rosa, SARS-CoV-2 from faeces to wastewater treatment: what do we know? A review, Sci. Total Environ., 2020, 743, 140444 CrossRef CAS.
- N. Neault, A. T. Baig, T. E. Graber, P. M. Aoust, E. Mercier, I. Alexandrov, D. Crosby, J. Mayne, T. Pounds, M. MacKenzie, D. Figeys, A. E. MacKenzie and R. Delatolla, SARS-CoV-2 protein in wastewater mirrors COVID-19 prevalence, medRxiv, 2020 DOI:2020.09.01.20185280.
- S. Huntscha, H. P. Singer, C. S. McArdell, C. E. Frank and J. Hollender, Multiresidue analysis of 88 polar organic micropollutants in ground, surface and wastewater using online mixed-bed multilayer solid-phase extraction coupled to high performance liquid chromatography–tandem mass spectrometry, J. Chromatogr. A, 2012, 1268, 74–83 CrossRef CAS.
- A. Jelic, S. Rodriguez-Mozaz, D. Barceló and O. Gutierrez, Impact of in-sewer transformation on 43 pharmaceuticals in a pressurized sewer under anaerobic conditions, Water Res., 2015, 68, 98–108 CrossRef CAS.
- J. Gao, A. Banks, J. Li, G. Jiang, F. Y. Lai, J. F. Mueller and P. K. Thai, Evaluation of in-sewer transformation of selected illicit drugs and pharmaceutical biomarkers, Sci. Total Environ., 2017, 609, 1172–1181 CrossRef CAS.
- A.-K. McCall, R. Bade, J. Kinyua, F. Y. Lai, P. K. Thai, A. Covaci, L. Bijlsma, A. L. N. van Nuijs and C. Ort, Critical review on the stability of illicit drugs in sewers and wastewater samples, Water Res., 2016, 88, 933–947 CrossRef CAS.
- J. Li, J. Gao, P. K. Thai, X. Sun, J. F. Mueller, Z. Yuan and G. Jiang, Stability of illicit drugs as biomarkers in sewers: from lab to reality, Environ. Sci. Technol., 2018, 52(3), 1561–1570 CrossRef CAS.
- P. Ramin, A. Libonati Brock, F. Polesel, A. Causanilles, E. Emke, P. de Voogt and B. G. Plósz, Transformation and sorption of illicit drug biomarkers in sewer systems: understanding the role of suspended solids in raw wastewater, Environ. Sci. Technol., 2016, 50(24), 13397–13408 CrossRef CAS.
- A. J. Pandopulos, C. Gerber, B. J. Tscharke, J. O'Brien, J. M. White and R. Bade, A sensitive analytical method for the measurement of neurotransmitter metabolites as potential population biomarkers in wastewater, J. Chromatogr. A, 2020, 1612, 460623 CrossRef CAS.
- P. K. Thai, J. W. O'Brien, A. P. W. Banks, G. Jiang, J. Gao, P. M. Choi, Z. Yuan and J. F. Mueller, Evaluating the in-sewer stability of three potential population biomarkers for application in wastewater-based epidemiology, Sci. Total Environ., 2019, 671, 248–253 CrossRef CAS.
- C. Chen, C. Kostakis, J. P. Gerber, B. J. Tscharke, R. J. Irvine and J. M. White, Towards finding a population biomarker for wastewater epidemiology studies, Sci. Total Environ., 2014, 487, 621–628 CrossRef CAS.
- M. Rico, M. J. Andrés-Costa and Y. Picó, Estimating population size in wastewater-based epidemiology. Valencia metropolitan area as a case study, J. Hazard. Mater., 2017, 323, 156–165 CrossRef CAS.
- B. J. Tscharke, J. W. O'Brien, C. Ort, S. Grant, C. Gerber, R. Bade, P. K. Thai, K. V. Thomas and J. F. Mueller, Harnessing the power of the census: characterizing wastewater treatment plant catchment populations for wastewater-based epidemiology, Environ. Sci. Technol., 2019, 53(17), 10303–10311 CrossRef CAS.
-
New York State Water Resources Institute, Septic Systems, New York State Water Resources Institute, Ithaca, NY, 2011, https://cugir.library.cornell.edu/catalog/cugir-008164 Search PubMed.
- B. J. Tscharke, C. Chen, J. P. Gerber and J. M. White, Temporal trends in drug use in Adelaide, South Australia by wastewater analysis, Sci. Total Environ., 2016, 565, 384–391 CrossRef CAS.
- T. Thiebault, L. Fougère, E. Destandau, M. Réty and J. Jacob, Temporal dynamics of human-excreted pollutants in wastewater treatment plant influents: toward a better knowledge of mass load fluctuations, Sci. Total Environ., 2017, 596–597, 246–255 CrossRef CAS.
- G. Fedorova, O. Golovko, T. Randak and R. Grabic, Storage effect on the analysis of pharmaceuticals and personal care products in wastewater, Chemosphere, 2014, 111, 55–60 CrossRef CAS.
-
C. Deitman, Personal communication, August 12, 2020 Search PubMed.
|
| This journal is © The Royal Society of Chemistry 2020 |
Click here to see how this site uses Cookies. View our privacy policy here. 
 a,
Hyatt C.
Green
b,
Maxwell L.
Wilder
b,
Qian
Du
c,
Brittany L.
Kmush
d,
Mary B.
Collins
e,
David A.
Larsen
d and
Teng
Zeng
a,
Hyatt C.
Green
b,
Maxwell L.
Wilder
b,
Qian
Du
c,
Brittany L.
Kmush
d,
Mary B.
Collins
e,
David A.
Larsen
d and
Teng
Zeng