 Open Access Article
Aqueous-phase reforming of crude glycerol: effect of impurities on hydrogen production
Dilek A.
Boga
,
Fang
Liu
,
Pieter C. A.
Bruijnincx
and
Bert M.
Weckhuysen
*
Inorganic Chemistry and Catalysis, Debye Institute for Nanomaterials Science, Utrecht University, Universiteitsweg 99, 3584 CG Utrecht, The Netherlands. E-mail: b.m.weckhuysen@uu.nl; Fax: (+31) 30 251 1027; Tel: (+31) 30 253 7400
First published on 9th September 2015
Abstract
The aqueous-phase reforming (APR) of a crude glycerol that originates from an industrial process and the effect of the individual components of crude glycerol on APR activity have been studied over 1 wt% Pt/Mg(Al)O, 1 wt% Pt/Al2O3, 5 wt% Pt/Al2O3 and 5 wt% Pt/C catalysts at 29 bar and 225 °C. The use of a 10 wt% alkaline crude glycerol solution in water, containing 6.85 wt% glycerol, 1.62 wt% soaps, 1.55 wt% methanol, and 0.07 wt% ester, resulted in a dramatic drop in APR activity compared to the corresponding 6.85 wt% solution of pure glycerol in water. Catalytic performance in crude glycerol APR increased in the order: 1 wt% Pt/Al2O3 < 5 wt% Pt/Al2O3 < 1 wt% Pt/Mg(Al)O < 5 wt% Pt/C. A H2 selectivity of only 1% was obtained with crude glycerol over a 1 wt% Pt/Al2O3 catalyst, while the same catalyst material under identical reaction conditions gave 64% H2 with pure glycerol. The cause of deactivation was investigated with synthetic mixtures that mimicked the composition of the crude glycerol and contained glycerol, methanol and varying amounts of NaCl and sodium oleate. The results showed that Na salts of fatty acids have a much more pronounced negative influence on APR activity than NaCl does and greatly inhibit H2 formation. Stearic acid and long chain aliphatics and olefins were shown to be formed and to be involved in the deactivation of the catalyst. The relatively high activity/selectivity of the 1 wt% Pt/Mg(Al)O could be attributed to intercalation of oleate/stearate in the sheets of the layered double hydroxide that is formed under reaction conditions.
Introduction
The increase in global energy demand combined with the limited fossil fuel reserves and the adverse environmental effects associated with their use make the search for alternatives a pressing societal issue. Indeed, finding alternative routes for energy production from sustainable energy sources, such as biomass, and improving the efficiency of these methods is receiving much attention. Hydrogen has emerged as an attractive alternative energy carrier, for instance for driving fuel cells. Renewably-sourced hydrogen would also impact the sustainability of its current use in large amounts in the chemical industry. Hydrogen can be sustainably produced from biomass-derived oxygenates by steam reforming, partial oxidation, autothermal reforming, aqueous-phase reforming (APR) and supercritical water reforming.1 Of these methods, APR is of particular interest, given the low energy costs of the process and the suppressed formation of CO.2 Various renewable oxygenates have been used for hydrogen production by APR, including ethanol, ethylene glycol, glycerol, sorbitol, and glucose. Of these, glycerol is a particularly attractive biomass-derived substrate for APR.Glycerol is produced in large amounts as a major by-product (10% w/w) of the biodiesel production process. Indeed, every 10 kg of biodiesel produced results in the formation of approximately 1 kg of glycerol.3 As a result of the recent rapid growth of the biodiesel industry, glycerol is now a readily available and cheap resource for which new and efficient valorization routes need to be developed.4,5 The glycerol obtained after biodiesel production is a crude fraction, however, which contains several impurities depending on the process applied. The chemical composition of crude glycerol depends on the type of the catalyst used during biodiesel production, transesterification efficiency, and recovery efficiency of the biodiesel and on impurities in the feedstock. The composition also depends on whether the methanol and catalysts were recovered. Generally speaking, crude glycerol will contain methanol, soap, catalyst, salts, non-glycerol organic matter and water as impurities.6 Refining crude glycerol to a higher grade is a costly process that is not yet really viable especially for small and medium-sized plants.3,7 Consequently, the development of processes that can utilize crude glycerol directly for the production of value-added chemicals or energy carriers, e.g. hydrogen, would be very advantageous.
In the past few years, several studies have been reported on hydrogen production via APR of glycerol using supported metal catalysts.1 Group VIII metals show high activity in this reaction, with Pt-based catalysts being most frequently used,8 with alloying Pt with other metals also having been reported to be beneficial.9–12 The effect of the support on the performance of Pt-based catalysts has been investigated in detail, almost invariably with pure glycerol as substrate. Indeed, support properties generally play a crucial role in the reforming of biomass-derived oxygenates. Menezes et al., for instance, reported on the influence of the support on Pt-catalyzed APR of glycerol with the oxides Al2O3, ZrO2, MgO and CeO2. MgO and ZrO2 stood out as these supports combined high hydrogen production with low hydrocarbon formation, which was attributed to their basicity.13 Previously, we demonstrated that monometallic Pt and bimetallic Pt–Cu catalysts supported on Mg(Al)O mixed oxides, obtained by calcination of the corresponding Layered Double Hydroxides (LDHs), showed an increased selectivity to hydrogen.12 Carbon-supported metal catalysts have also been shown to display high activity and stability under APR conditions.9,10,14 We therefore chose to study the performance of Pt catalysts supported on the mixed oxide Mg(Al)O and on carbon in the APR of crude glycerol and to compare them to the benchmark APR catalyst, Pt/Al2O3.
The many studies reported so far provide valuable information on the APR process for pure glycerol, but the impurities in crude glycerol are expected to strongly influence conversion, and will most probably limit the activity of the catalysts and potentially even result in significant deactivation. For supercritical water reforming it was, for instance, reported that the use of crude glycerol led to rapid catalyst deactivation, which was not observed for runs with pure glycerol.15 Detailed information on and understanding of the effect of impurities on catalyst performance is crucial for the design of efficient catalysts for crude glycerol APR. To the best of our knowledge, only one study is currently available on aqueous-phase reforming of crude glycerol. Lehnert and Claus reported on the effect of Pt particle size on γ-alumina-supported catalysts in the APR of pure and crude glycerol and found that H2 selectivity to be lower in crude glycerol APR. The cause of deactivation was suggested to be the inorganic salts present in solution, i.e. NaCl.16 No detailed study is available yet on the influence of the various impurities found in crude glycerol, such as the inorganic salts, fatty acids or fatty acid salts, on APR activity. Here, our results are reported on crude glycerol APR and the influence of its components on APR activity using Pt-based catalysts on different supports.
Experimental section
Materials
Glycerol (≥99.5%) was purchased from Sigma-Aldrich and used without further purification. Crude glycerol containing 68.5% glycerol, 16.2% soaps, 15.5% methanol, 1.5% water and 0.7% ester was obtained from SK Innovations. The 1 wt% Pt/γ-Al2O3, 5 wt% Pt/γ-Al2O3 and 5 wt% Pt/C catalysts were purchased from Sigma-Aldrich, while the preparation of the 1 wt% Pt/Mg(Al)O catalyst is described previously.10 The purchased catalysts were reduced at 250 °C for 2 h prior to use.Catalyst characterization
X-ray powder diffraction (XRD) measurements were performed on a Bruker AXS Advance D8 apparatus using Co Kα radiation (α = 1.78897 Å) operating at 45 kV and 30 mV. The data were collected between 2θ = 20°–100° with an increment of 0.04 and scan speed of 2. Transmission Electron Microscopy (TEM) analyses were performed on a FEI Tecnai 20F transmission electron microscope operated at 200 KeV, which is equipped with a Schottky Field Emission Gun and a Twin Objective lens (magnification range of 25–700×). For the Attenuated Total Reflection Infrared Spectroscopy (ATR-IR) measurements a Bruker Tensor 27 instrument equipped with Pike miracle ATR accessory was used. The spectra were recorded with a resolution of 16 cm−1 and a 4000–600 cm−1 scan range on a diamond crystal. Nuclear Magnetic Resonance (NMR) measurements were performed on a Varian 400 NMR spectrometer (400 and 100 MHz for 1H and 13C, respectively) at 25 °C. D2O was used as solvent. Thermogravimetric analysis (TGA) was performed with a Perkin-Elmer Pyris 1 apparatus. 15 mg of catalyst sample was dried at 200 °C for 2 h and heated with a ramp of 5 °C min−1 to 950 °C in a 10 mL min−1 flow of air. In parallel, evolved gas was analyzed with a Pfeiffer Omnistar quadrupole mass spectrometer, which was connected to the outlet of the TGA apparatus. Ion currents were recorded for m/z values of 18 (H2O) and 44 (CO2). Hydrogen chemisorption experiments were performed on a Micromeritics ASAP 2020C. 200 mg of 1Pt/Al2O3 fresh catalyst was reduced at 250 °C for 2 h. After reduction the sample was degassed for 1 h in at 250 °C. The sample was cooled to 40 °C at which the H2 adsorption isotherm was measured. The same procedure, but excluding the reduction step was applied for the measurement with the spent, ethanol-washed 1Pt/Al2O3 catalyst.APR catalytic tests
Catalyst testing experiments were carried out under semi-batch conditions in a 40 mL stainless steel bench top Parr reactor equipped with a back-pressure regulator. In a typical experiment, the reactor was charged with 10 mL of a 10 wt% aqueous solution of crude glycerol, prepared with degassed milli-Q water. For runs with pure glycerol, the glycerol content was approximately 6.8 wt%, which corresponds to the glycerol concentration in the crude glycerol solutions. The reactor was pressurized with He to 29 bar (held constant by a back pressure regulator) and the reactions were run at 225 °C for 3 h. The gases released from the autoclave (He, H2, CO2, CO and CH4) were quantified and are expressed in terms of percentages of the total gaseous mixture. The gas phase reaction products were analyzed by an online dual channel micro-GC (Varian CP4900) equipped with a Thermal Conductivity Detector (TCD). For analysis of H2, CO2, CO and CH4, a COX column was used. The liquid phase was analyzed on a Shimadzu 2010A GC with Flame Ionization Detector (FID) and a Shimadzu HPLC. Glycerol conversion (X), yields (Y) and selectivities (S) of liquid phase products are defined as follows (C0,gly initial [glycerol]; Ct,gly [glycerol] at time t; Ct,i [product i] at time t; Mo and Mi are the moles of carbon in glycerol and product i, resp.):Batches of the spent catalysts were divided into two parts of which one was washed with water and the other with ethanol. The filtrates were collected and the white crystalline solid obtained after evaporation of the ethanol filtrate was analyzed by GC, ATR-IR, XRD and NMR.
Results and discussion
APR of crude glycerol
The performance of 1 wt% Pt/Mg(Al)O, 1 wt% Pt/Al2O3, 5 wt% Pt/Al2O3, and 5 wt% Pt/C catalysts on different supports was first compared in the APR of aqueous solutions of pure glycerol and a crude glycerol obtained from an industrial biodiesel production process. The crude glycerol used is an alkaline mixture of 68.5% glycerol, 16.2% soaps, 15.5% methanol, 1.5% water and 0.7% esters. Standard reaction conditions entailed running the reaction for 3 h with a 6.85 wt% glycerol solution (or 10 wt% crude glycerol) at 225 °C and under 29 bar of He pressure. Catalyst performance was compared in a semi-batch reactor setup, which allows for an initial assessment of the extent of deactivation and for identification of the component in crude glycerol responsible for this. The detrimental effect of crude glycerol was found to arise from the presence of fatty acid salts and to affect the Pt/Al2O3 catalyst most.The results obtained for the APR of pure and crude glycerol are shown in Table 1. Full conversion of glycerol was observed in the APR of pure glycerol over 1 wt% Pt/Al2O3 (1Pt/Al2O3) with a H2 selectivity of 64%, expressed as percentage of the gas phase composition (see Exp. section). APR of crude glycerol, on the other hand, resulted in almost complete and immediate inhibition of hydrogen production, as the hydrogen selectivity dropped to 1%.
| Reactant composition (wt%) | Catalytic performance | ||||||||
|---|---|---|---|---|---|---|---|---|---|
| Glycerol type | Catalyst | Catalyst amount (mg) | Glycerol | Methanol | Na oleate | NaCl | Glycerol conversion (%) | H2 (%) | Methanol conversion (%) |
| Pure | 1Pt/Al2O3 | 300 | 6.89 | — | — | — | 100 | 64 | — |
| 5Pt/Al2O3 | 300 | 6.85 | — | — | — | 100 | 65 | — | |
| 5Pt/C | 136 | 6.83 | — | — | — | 100 | 66 | — | |
| Crude | 1Pt/Al2O3 | 300 | 6.85 | 1.55 | 1.62 | — | 46 | 1 | 71 |
| 5Pt/Al2O3 | 300 | 6.85 | 1.55 | 1.62 | — | 40 | 16 | 37 | |
| 5Pt/C | 300 | 6.85 | 1.55 | 1.62 | — | 99 | 60 | 61 | |
| 5Pt/C | 136 | 6.85 | 1.55 | 1.62 | — | 38 | 24 | 51 | |
| 1Pt/Mg(Al)O | 136 | 6.85 | 1.55 | 1.62 | — | 71 | 17 | 19 | |
| Synthetic crude | 1Pt/Al2O3 | 6.65 | 1.40 | — | — | 100 | 63 | 66 | |
| 6.90 | 1.69 | 0.35 | 0.33 | 95 | 49 | 67 | |||
| 7.65 | 1.76 | — | 3.5 | 19 | 46 | 49 | |||
| 6.77 | 1.56 | 1.47 | — | 47 | 1 | 53 | |||
Fig. 1 shows the conversion of glycerol and formation of H2 as function of time during the APR of pure, crude and synthetic crude glycerol over 1Pt/Al2O3 (see below). It can be clearly seen that H2 evolution is (almost) completely suppressed for the crude run, already from the start of the reaction (t = 0 min is defined at the time at which reaction temperature is reached). Note that the CO2 and CH4 time profiles show an identical dramatic and immediate drop for both crude and synthetic crude glycerol, the same as seen for H2. Whereas full conversion is observed for pure glycerol, conversion for crude glycerol levels off at around 46%, respectively. Analysis of the liquid phase by HPLC showed 1,2-propanediol and lactic acid to be the main liquid phase products for pure and crude glycerol APR, respectively. Indeed, LA is formed almost exclusively during crude glycerol APR at lower conversions. The selectivities of liquid products detected are shown in Table 2. Lactic acid can be formed from glycerol under basic hydrothermal conditions by a multistep process involving dehydrogenation of glycerol to yield glyceraldehyde/dihydroxyactone, in the presence of base, subsequent lactic acid formation via pyruvaldehyde as intermediate.17
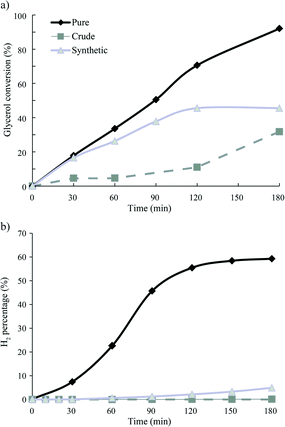 | ||
| Fig. 1 APR of pure and crude glycerol as a function of time a) glycerol conversion and b) H2 formation; reaction conditions 1Pt/Al2O3, 225 °C, 29 bar, 3 h. | ||
| Gly | LA | AA | EG | HA | 1,2-PD | EtOH | |||||||
|---|---|---|---|---|---|---|---|---|---|---|---|---|---|
| Time (min) | X | S | Y | S | Y | S | Y | S | Y | S | Y | S | Y |
| a See experimental section for definitions of C, Y, and S; Gly, glycerol; LA, lactic acid; AA, acetic acid; EG, ethylene glycol; HA, hydroxyacetone; 1,2-PD, 1,2-propanediol; EtOH, ethanol; reaction conditions 1Pt/Al2O3, 225 °C, 29 bar, 3 h. | |||||||||||||
| Pure glycerol | |||||||||||||
| 0 | 0 | 0 | 0 | 0 | 0 | 0 | 0 | 0 | 0 | 0 | 0 | 0 | 0 |
| 30 | 18 | 1 | <1 | 1 | <1 | 3 | 1 | 5 | 1 | 16 | 3 | 3 | 1 |
| 60 | 34 | 1 | <1 | 1 | <1 | 2 | 1 | 2 | 1 | 11 | 4 | 3 | 1 |
| 90 | 51 | 0 | <1 | 1 | <1 | 2 | 1 | 2 | 1 | 10 | 5 | 2 | 1 |
| 120 | 71 | 0 | <1 | 1 | 1 | 2 | 1 | 1 | 1 | 8 | 5 | 1 | 1 |
| 180 | 92 | 0 | <1 | 1 | 1 | 0 | <1 | 0 | <1 | 2 | 2 | 0 | <1 |
| Crude glycerol | |||||||||||||
| 0 | 0 | 0 | 0 | 0 | 0 | 0 | 0 | 0 | 0 | 0 | 0 | 0 | 0 |
| 30 | 5 | 76 | 4 | 2 | <1 | 1 | 0 | 6 | <1 | 1 | <1 | 0 | 0 |
| 60 | 5 | 101 | 5 | 2 | <1 | 1 | 0 | 8 | <1 | 3 | <1 | 0 | 0 |
| 120 | 11 | 61 | 7 | 0 | <1 | 1 | <1 | 4 | 1 | 3 | <1 | 0 | 0 |
| 180 | 32 | 23 | 7 | 0 | <1 | 0 | 0 | 1 | <1 | 1 | 1 | 0 | <1 |
| Synthetic crude | |||||||||||||
| 0 | 0 | 0 | 0 | 0 | 0 | 0 | 0 | 0 | 0 | 0 | 0 | 0 | 0 |
| 30 | 17 | 27 | 5 | 0 | 0 | 0 | <1 | 2 | <1 | 1 | <1 | 0 | 0 |
| 60 | 26 | 19 | 5 | 0 | <1 | 0 | <1 | 2 | 1 | 1 | <1 | 1 | <1 |
| 90 | 38 | 13 | 5 | 0 | <1 | 0 | <1 | 2 | 1 | 1 | <1 | 0 | <1 |
| 120 | 46 | 11 | 5 | 0 | <1 | 0 | <1 | 2 | 1 | 1 | 1 | 0 | <1 |
| 180 | 46 | 16 | 8 | 1 | 1 | 1 | <1 | 5 | 3 | 4 | 2 | 0 | <1 |
A 5 wt% Pt/Al2O3 (5Pt/Al2O3) catalyst was also tested to assess the effect of platinum loading on the APR of crude glycerol. As expected, both glycerol conversion and H2 production decreased with crude glycerol, but H2 selectivity did increase from 1% to 16%, at a similar conversion level.
The 5 wt% Pt/C (5Pt/C) catalyst proved much more active than both the 1Pt/Al2O3 and 5Pt/Al2O3 catalyst under standard conditions (Table 1). Even with crude glycerol, almost full glycerol conversion and 60% H2 selectivity was observed. To get a better insight into the extent of deactivation, the amount of catalyst was decreased to compare the catalysts at a similar, reduced conversion level. Reducing the amount of catalyst roughly by half resulted in a drop in glycerol conversion to 38%, yet H2 formation was still higher (24%) than with the Pt/Al2O3 catalysts (16%). Compared to the benchmark Pt/Al2O3 catalysts, 1Pt/Mg(Al)O also produced more H2 in the APR of crude glycerol (17% H2vs. 1% H2), even at less than half the catalyst loading. The ratio between glycerol and methanol converted was found to vary with the catalyst used (and on composition, see Table 1), but no clear trend can be discerned. For all three types of catalysts (Pt supported on alumina, carbon or mixed oxide), the same products were detected in the liquid phase with a similar product distribution; 1,2-propanediol and lactic acid were in all cases the main products. For 1Pt/Mg(Al)O, an increase in the amount of ethylene glycol formed was observed.
The main impurities in a typical crude glycerol solution are methanol, metal salts of fatty acids (e.g. sodium stearate, sodium oleate) and water.6 Although the crude glycerol used here contained no inorganic salts, they can generally be expected to be present, as a result of, for instance, a neutralization step, and their influence on activity was therefore included in our studies. In the only available study of crude glycerol APR, Lehnert and Claus noted a significantly lower hydrogen production compared to pure glycerol in a flow reactor over a 3 wt% Pt catalyst supported on Puralox (a mixture of γ-, δ-, and θ-phases of alumina). H2 production showed a maximum as function of time, with a considerable loss of catalytic activity being observed after 4 h of time on stream. This loss of activity was attributed to catalyst poisoning by inorganic salts, i.e. the NaCl present in the crude glycerol,16 but no hard evidence was provided. To identify the cause of deactivation with our crude glycerol, we tested synthetic mixtures of aqueous glycerol with (combinations of) methanol, sodium oleate and NaCl. These solutions mimic (part of) the crude glycerol and allow the effect of each impurity to be investigated separately (Table 1).
First, the addition of methanol did not affect the APR activity in terms of H2% present in the gas phase products or in glycerol conversion. The addition of 0.35% sodium oleate in combination with 0.33% NaCl, on the other hand, caused a decrease in H2% from 64% to 49% together with a small drop in glycerol conversion. Of the two contaminants, we found that separate addition of the sodium oleate resembled best the dramatic reduction in activity seen for crude glycerol APR activity. Increasing the NaCl content of the glycerol solution (3.5% NaCl) led to a substantial decrease in both glycerol conversion (19%) and H2 selectivity (46%); nonetheless, even at these high loadings, the 1Pt/Al2O3 catalyst still produced considerably more hydrogen compared to the run with crude glycerol (1% H2). On the other hand, increasing the Na oleate content to a value (1.47%) close to the actual amount of soap present in our crude glycerol, did indeed inhibit H2 production over 1Pt/Al2O3 (1%) to the same extent as crude glycerol did. As can be seen in Fig. 1 and Table 2, glycerol conversion dropped 32% and, as with the crude glycerol run, lactic acid was the main product found in the liquid phase. NMR and GC analyses of the liquid phase furthermore showed that sodium oleate was no longer present, with stearic acid and saturated and unsaturated C17 compounds now being observed instead. These compounds can be formed by hydrogenation and/or deoxygenation of the oleate, respectively. Indeed, regardless if runs were performed with Na oleate or Na stearate, stearic acid was always observed after reaction. It can thus be concluded that while the presence of NaCl in the crude glycerol can contribute to a minor extent to the observed deactivation, it are the fatty acid salts that are mainly responsible for the drop in activity as a result of both reversible and irreversible adsorption on the catalyst surface, as will be shown below.
Deactivation of the Pt/Al2O3 and Pt/C catalysts: chemisorption, TEM and TGA-MS analysis
Fresh and spent catalysts were characterized by H2-chemisorption, TEM and TGA-MS to elucidate the cause of deactivation during the APR of crude glycerol.While the Pt metal surface area of the fresh 1Pt/Al2O3 catalyst was found to be 9.6 m2 g−1, the surface area of the spent 1Pt/Al2O3 catalyst after APR of crude glycerol was only 2.7 m2 g−1. Note that prior to the chemisorption experiments the spent 1Pt/Al2O3 catalyst was rinsed with ethanol to remove the organic species that are reversibly adsorbed on the catalyst (see below). This large decrease (72%) in surface area points at large reduction of metal sites available for H2 uptake, either as the result of Pt particle growth or by blockage of part of the metal particle surface, e.g. by irreversible deposition of organics.
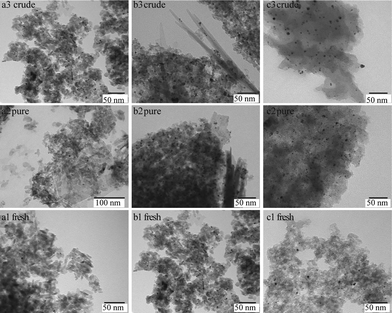
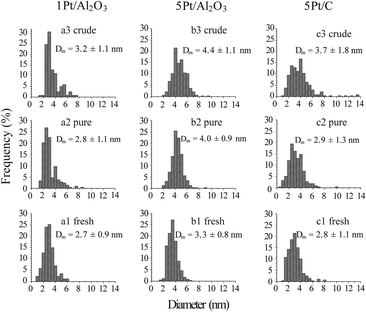
Fig. 2 shows the TEM images for the fresh and spent 1Pt/Al2O3, 5Pt/Al2O3 and 5Pt/C catalysts after reaction with pure and crude glycerol. The differences in the alumina support can be clearly seen, changing from amorphous alumina phase of the fresh catalysts to flake-like boehmite patches in the spent catalysts. It is now well established that alumina is hydrated to boehmite under hydrothermal (APR) conditions, with glycerol (or other oxygenates) being known to significantly slow down this conversion.18Fig. 3 shows the size distribution of the Pt particles of three different fresh and spent catalysts after pure and crude glycerol APR. Although some sintering occurs during APR with mean particle sizes (Dm) of all three catalysts being slightly larger after crude glycerol APR than after pure glycerol APR, the differences in Pt particle size are small and do not correlate with the differences observed in reactivity. Neither the drop in H2 uptake observed in the chemisorption experiments, nor the dramatic decrease in H2% (from 64% to 1%) can therefore be attributed to sintering of the metal particles. This limited sintering in the presence of glycerol is in agreement with the work of Ravenelle et al.18 who showed that not only boehmite formation is reduced, but also agglomeration of supported metal particles in the presence of polyols by the formation of carbonaceous species on the surface. A significant fraction of the metal surface area was also found blocked by these authors in their studies with pure glycerol, showing that the drop in surface area is not crude-glycerol specific.
The TGA(−MS) profiles and H2O and CO2 evolution traces of spent 1Pt/Al2O3 catalysts after pure and crude glycerol APR are shown in Fig. 4 and 5, respectively. H2O and CO2 desorption was observed from around 300 °C and up. The significant weight loss and evolution of CO2 and H2O at around 300 °C that is exhibited by both samples indicates that also adsorbed organic species are being removed starting from this temperature (Fig. 5a and b, resp.). At around 500 °C, water is released by dehydration upon phase transition of the support from boehmite back to γ-Al2O3 (Fig. 5a).19,20 Again, prior to the TGA measurements the spent catalysts were rinsed with ethanol to remove any organic species reversibly adsorbed on the catalyst. The gradual decrease in weight as a function of temperature that is observed in Fig. 4 is therefore the result of removal of the remaining, irreversibly adsorbed organic species on the catalyst and, at higher temperatures, of the phase transformation of the support. According to the TGA analyses, the amount of CO2 desorbed from 1Pt/Al2O3 after crude glycerol APR was significantly larger than after pure glycerol APR (Fig. 5b), showing that organic species derived from the impurities in crude glycerol are adsorbed on the catalyst and cannot be removed simply by washing with organic solvent.
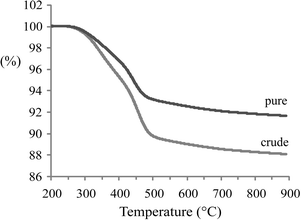 | ||
| Fig. 4 Thermogravimetric analysis profiles of a spent 1Pt/Al2O3 catalyst after APR of pure and crude glycerol (experiments were performed under flow of air). | ||
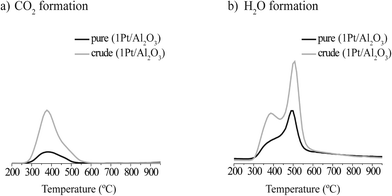 | ||
| Fig. 5 a) CO2 and b) H2O formation during thermogravimetric analyses of a spent 1Pt/Al2O3 catalyst after the APR of pure (black) and crude (gray) glycerol. | ||
Deactivation of the Pt/Al2O3 and Pt/C catalysts: XRD and ATR-IR analysis
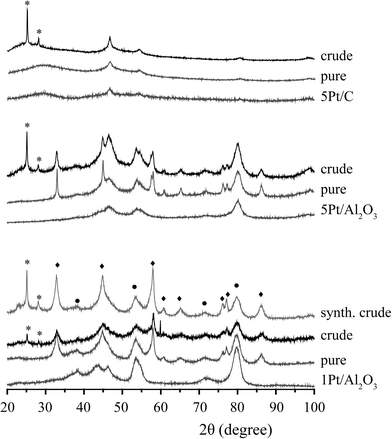
Fig. 6 shows the XRD patterns of the spent 1Pt/Al2O3, 5Pt/Al2O3 and 5Pt/C catalysts before and after APR of crude and pure glycerol. The XRD patterns for the Pt/Al2O3 catalysts show the presence of two phases, γ-alumina and boehmite after APR, regardless of the reactant used. Interestingly, two additional peaks were observed at 2θ = 25 and 29° for crude glycerol and a synthetic crude mixture containing glycerol/methanol/Na oleate. In the case of 5Pt/C, no phase transformation was seen, but the same additional peaks were observed. Fig. 7 shows the ATR-IR spectra of the spent 1Pt/Al2O3 and 5Pt/Al2O3 catalysts after crude glycerol APR. The bands at 3292 and 3093 cm−1 belong to AlOOH boehmite vibrations and the vibration at 1068 cm−1 to the bending vibration of AlOH in boehmite.21–23 As distinct from pure glycerol, the catalyst showed additional bands after the APR of crude glycerol and the synthetic crude mixture. The two distinctive bands at 2916 cm−1 and 2849 cm−1 are C–H stretch vibrations of methylene groups, the band at 1704 cm−1 can be assigned to a carbonyl stretch vibration, and the multiple peaks between 1350 and 1150 cm−1 are the result of CH2 deformation vibrations. The latter vibrations are also called progression bands and are typical for fatty acids, as are the other additional vibrations.24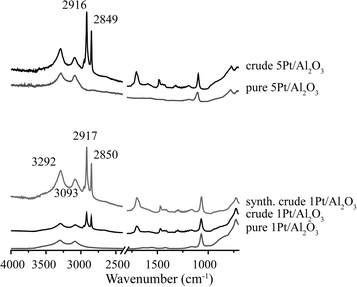 | ||
| Fig. 7 ATR-IR spectra of spent 1Pt/Al2O3 and 5Pt/Al2O3 catalysts after APR of crude glycerol and glycerol solution. | ||
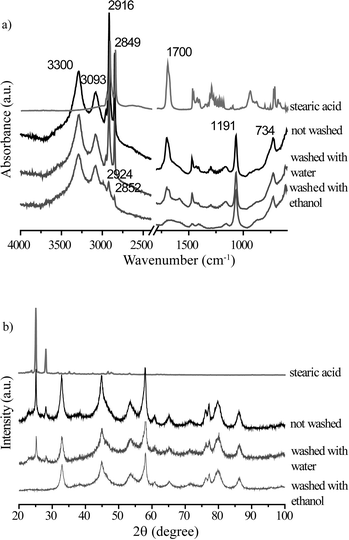
To positively identify the species adsorbed on the catalyst, a batch of spent catalyst obtained after crude glycerol APR was divided into two parts, one subsequently washed with water and the other with ethanol. After drying, the two batches of catalysts were again measured with ATR-IR and XRD (Fig. 8). The phase associated with the two peaks at 2θ = 25 and 29° observed after the crude and synthetic glycerol runs could not be removed by washing with water, but did disappear after washing the spent catalyst with ethanol (Fig. 8a). Fig. 8b shows the ATR-IR spectra of the 1Pt/Al2O3 catalyst after washing with ethanol or water. The species associated with the vibrations at 2916 and 2849 cm−1 (and with the extra phase observed in the XRD pattern) could indeed to a large extent be removed by washing the spent catalyst with ethanol, but not with water. Two weak bands remained after washing at 2924 and 2852 cm−1 and were attributed to asymmetric and symmetric C–H stretching vibrations showing that some long chain alkanes and/or olefins remained on the catalyst after ethanol washing. The multiple peaks at 1350–1150 cm−1 and the carbonyl band at 1704 cm−1 also disappeared after washing with ethanol. These observations suggest that a fatty acid is reversibly adsorbed on the catalyst and that a small amount of irreversibly adsorbed aliphatics remain after washing. The deposited aliphatics could be in part responsible reduced hydrogen uptake seen for the spent catalyst after crude glycerol APR in the chemisorption measurements by blocking the active Pt sites; The fact no H2 evolution is seen at all with crude glycerol, however, suggests that the irreversible conversion/adsorption of aliphatics is not the sole or main cause of deactivation (see below, Table 4). Indeed, already shortly after reaching reaction temperature hydrogen was detected with pure glycerol, but not with the crude or synthetic crude glycerol runs. The reversible interaction with the fatty acid is thus also expected to contribute to deactivation.
A white crystalline solid, not soluble in water, was obtained after the ethanol filtrate was evaporated to dryness. The solid was analyzed by GC and NMR and identified as stearic acid. Thus, the position of the carbonyl stretching of stearic acid (1704 cm−1) can now be more rigorously assigned to stearic acid adsorbed as a dimer on the catalyst surface.25
For comparison, an APR reaction was performed of a synthetic crude mixture containing glycerol, methanol, and sodium stearate (rather than sodium oleate) over the 1Pt/Al2O3 catalyst. Again, H2 formation was strongly inhibited and only 1% H2 was observed after 3 h of reaction. The spent catalysts were collected and washed in the same way as described above. The XRD and ATR-IR data proved identical to the data obtained for the spent catalysts after APR of synthetic crude glycerol prepared with Na oleate (data not shown). Consequently, stearic acid is formed and deposited on the catalyst regardless of the original fatty acid used in the synthetic crude. Unfortunately, a comparative experiment starting with stearic acid (rather than sodium stearate) was precluded by the very limited solubility of this acid in water.
Fig. 9 shows a comparison of the ATR-IR spectra of spent, unwashed 1Pt/Al2O3 after 30 and 180 min of APR of crude glycerol (crude glycerol: 6.85% glycerol, 1.55% methanol and 1.62% sodium oleate). In addition to the CH2 stretching vibrations in the region of 2920–2850 cm−1, there are two important features to be noted, i.e. a band at 1550 cm−1 and at 1704 cm−1, which belong to the carbonyl stretching of a fatty acid salt and the stretching of the carbonyl group of stearic acid, respectively. The band at 1550 cm−1 decreased in time whereas the latter increased in intensity, suggesting consumption of fatty acid salt and formation of stearic acid over time, consistent with the observations made above.
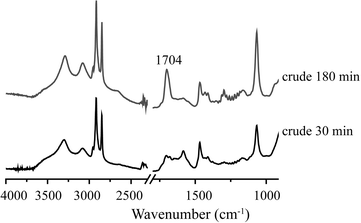 | ||
| Fig. 9 ATR-IR spectra of a spent Pt/Al2O3 catalyst after crude glycerol APR; after 30 min and after 180 min. | ||
Stearic acid is known to adsorb on metal oxides as monomers at low surface coverage, while adsorption of stearic acid dimers has been observed at high coverage.25 Adsorption of long chain fatty acids decreases the hydrophilicity of the support material. In the crude glycerol APR reactions, a similar interaction of the fatty acids with the support might therefore cause a decrease in the interaction of the catalyst with the polar reactants (water and glycerol) and as a result limit the accessibility of the metal surface. The characterization of the spent catalysts shows that there indeed is a strong interaction between the catalyst and the fatty acid impurities, data that provides clues for improving the catalyst. Control over the hydrophilicity/hydrophobicity of the support is, for instance, expected to allow improved APR of crude glycerol by reducing the interaction with the fatty acid. Alternatively, scavenging of the (formed) fatty acids by a hydrophobic material could also protect the catalyst against deactivation.
With this in mind, an active carbon (AC) material (Norit Ultra) was treated in inert atmosphere at 1000 °C for 3 h to remove the surface oxygen groups (ACht) and subsequently added to a reaction of crude glycerol over 1Pt/Al2O3 (Table 3). The fraction of H2 produced significantly increased from 1% to 18%. The spent catalyst was collected and the alumina and ACht phases were separated. XRD and ATR-IR analysis showed that the stearic acid formed was only adsorbed on AC, whereas a small amount of long chain hydrocarbons was again found on alumina phase (data not shown). These results again point at two modes of deactivation, i.e. rapid reversible adsorption of stearic acid and a slower formation of the irreversibly adsorbed hydrocarbons on the metal active phase. The observation that complete deactivation of 1Pt/Al2O3 could be avoided by simple addition of AC to the mixture, suggests that pretreating the crude glycerol with a fatty acid-selective adsorbent might be beneficial for continuous flow processes. It should be noted here that the stearic acid distribution is determined after cooling to room temperature, and as the equilibrium positions are not known at reaction temperature this process needs further study.
| Catalyst | Amount (mg) | Glycerol type | H2 (%) |
|---|---|---|---|
| 1Pt/Al2O3 | 300 | Crude | 1 |
| 1Pt/Al2O3 + ACht | 300 + 132 | Crude | 18 |
Deactivation of the Pt/Mg(Al)O catalyst: XRD and ATR-IR analysis
The spent Pt/Mg(Al)O catalyst was also characterized after recovery from the reaction and after washing the spent catalyst with ethanol. The fresh catalyst was prepared by calcination of the parent LDH material with a Mg/Al ratio of 2.95; details about catalyst preparation have been previously reported.12 LDHs can reversibly change to a mixed oxide by calcination (by loss of water and carbon dioxide).26 The original layered structure can be reconstructed if the mixed oxides are exposed to water or appropriate anions, e.g. carbonates, a property called retro-topotactical transformation (memory effect). Activation of LDHs by conversion to the mixed oxide and rehydration is a well-known procedure that is used to optimize the basic properties of such materials.27 It was previously shown that the mixed oxide support reverted back to an LDH structure during APR of pure glycerol over 1Pt/Mg(Al)O and this in situ activation resulted in a higher H2 selectivity compared to a Pt/LDH catalyst.12Fig. 10 shows the XRD patterns of the fresh catalyst, the spent catalyst after the crude glycerol APR, before and after washing, and the parent LDH for comparison. Changes are again noted in the spent catalyst, as the mixed oxide did revert back to a structure that is similar to the parent LDH. Significant interruption of the local periodicity is seen, however, as the usually well-resolved peaks in the region of 40–60° 2θ now overlap to give one broad signal. Additional diffraction peaks appeared between 2θ = 5–10°, which could not be removed by washing with ethanol or water. Although reconstruction of the LDH structure from mixed oxide supports under alkaline conditions is usually the result of rehydroxylation or carbonate incorporation, other anions can be incorporated as well. The ATR-IR spectra of the spent catalyst before and after washing showed that is this case, with the fatty acid carboxylates being incorporated in an irreversible manner during crude glycerol APR. The carbonyl stretch vibration at 1704 cm−1 which is characteristic for fatty acids was not observed in spent 1Pt/Mg(Al)O catalyst, whereas a sharp and intense peak at 1558 cm−1 appeared which is pointing at fatty acid carboxylate anions, instead.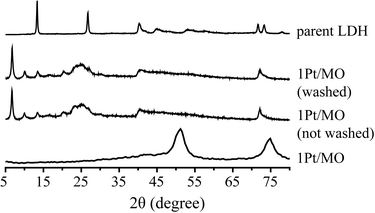 | ||
| Fig. 10 X-ray diffraction patterns of a 1Pt/Mg(Al)O catalyst, after crude glycerol APR, before and after washing with ethanol/water mixture, as well as the parent LDH material (Mg/Al = 2.95). | ||
The scavenging of the fatty acid impurity by its involvement in the reconstruction of LDH leads to an improved activity of 1Pt/Mg(Al)O compared to benchmark 1Pt/Al2O3 catalyst, even though less than the half amount of catalyst was used. The data in Table 4 shows, in contrast to the immediate inhibition that is seen with 1Pt/Al2O3 in crude (and synthetic crude) glycerol, H2 selectivity slowly increased over time for 1Pt/Mg(Al)O. These results show that the gradual trapping of the oleate/stearate anions in the intralayers of the LDH and consequently irreversible removal of these components from the reaction is beneficial for H2 formation.
Conclusion
The influence of crude glycerol on APR activity was studied with 1Pt/Al2O3, 5Pt/Al2O3, 5Pt/C and 1Pt/Mg(Al)O as catalyst. The use of crude glycerol proved detrimental for the APR process over 1Pt/Al2O3, giving almost complete inhibition of H2 production; an increase in Pt loading resulted in a limited restoration of APR activity (5Pt/Al2O3vs. 1Pt/Al2O3). The 5Pt/C catalyst was found to suffer less from the use of crude glycerol and proved to be the most active catalyst. Among the impurities present in the crude glycerol, Na salts of fatty acids (Na oleate, Na stearate) were shown to inhibit the APR activity over the 1Pt/Al2O3 catalyst most. Regardless of the fatty acid salt present, stearic acid and long chain alkanes and olefins were formed in all cases and ended up adsorbed on the catalyst. Both species seem to be implicated in the deactivation of Pt/Al2O3, yet to different extents and immediacy. The irreversible deposition of long chain alkanes and olefins, formed from the fatty acid derivatives in the feed, eventually block part of the Pt active sites, whereas the oleate/stearate fatty acids are converted under reaction conditions to stearic acid, which is held responsible for the more immediate deactivation by reversible adsorption on the Pt/Al2O3. The deleterious effect of stearic acid could be partly prevented by the addition of a hydrophilic active carbon, upon which a significant increase in H2 production was observed. The hydrophobic AC is thought to scavenge the stearic acid formed as the results showed that after reaction stearic acid is adsorbed on active carbon support only. The mixed oxide support of the 1Pt/Mg(Al)O catalyst, prepared by calcination of parent LDH material, was shown to revert back to a LDH structure during reaction, by intercalation of the oleate/stearate ions. APR activity was thus substantially increased when compared to 1Pt/Al2O3. Blocking the interaction of fatty acid with the catalyst by adding a good adsorbent was thus shown to improve H2 production from crude glycerol. The results obtained provide insight into possible modes of deactivation and can aid further catalyst design and long-term deactivation studies under continuous flow.Acknowledgements
The authors gratefully acknowledge SK innovation for financial support. Dr. Jovana Zecevic (Utrecht University) is thanked for the TEM measurements. Dr. Rob Gosselink (Utrecht University) and Dr. Stefan Hollak (Wageningen University) are acknowledged for GC analyses of the fatty acids. Dr. Annelie Jongerius and Joe Stewart (Utrecht University) are thanked for NMR measurements. Marjan Versluijs-Helder (Utrecht University) is thanked for the TGA measurements. Dr. Peter de Peinder (VibSpec) is thanked for discussions on the ATR-IR data. Tomas van Haasterecht and Dr. Anne Mette Frey (Utrecht University) are acknowledged for the H2-chemisorption measurements.Notes and references
- C. H. Zhou, H. Zhao, D. S. Tong, L. M. Wu and W. H. Yu, Catal. Rev.: Sci. Eng., 2013, 55, 369 CAS.
- R. R. Davda, J. W. Shabaker, G. W. Huber, R. D. Cortright and J. A. Dumesic, Appl. Catal., B, 2005, 56, 171 CrossRef.
- M. S. Ardi, M. K. Aroua and N. A. Hashim, Renewable Sustainable Energy Rev., 2015, 42, 1164 CrossRef CAS.
- M. Pagliaro, R. Ciriminna, H. Kimura, M. Rossi and C. D. Pina, Angew. Chem., Int. Ed., 2007, 46, 4434 CrossRef CAS PubMed.
- J. J. Bozell and G. R. Petersen, Green Chem., 2010, 12, 539 RSC.
- F. Yang, M. A. Hanna and R. Sun, Biotechnol. Biofuels, 2012, 5, 13 CrossRef CAS PubMed.
- E. Santacesaria, G. Martinez Vicente, M. Di Serio and R. Tesser, Catal. Today, 2012, 195, 2 CrossRef CAS.
- R. D. Cortright, R. R. Davda and J. A. Dumesic, Nature, 2002, 418, 964 CrossRef CAS PubMed.
- A. Ciftci, D. A. J. M. Ligthart, A. O. Sen, A. J. F. van Hoof, H. Friedrich and E. J. M. Hensen, J. Catal., 2014, 311, 88 CrossRef CAS.
- P. J. Dietrich, M. C. Akatay, F. G. Sollberger, E. A. Stach, J. T. Miller, W. N. Delgass and F. H. Ribeiro, ACS Catal., 2014, 4, 480 CrossRef CAS.
- M. El Doukkali, A. Iriondo, J. F. Cambra, I. Gandarias and L. Jalowiecki-Duhamel, Appl. Catal., A, 2014, 472, 80 CrossRef CAS.
- D. A. Boga, R. Oord, A. M. Beale, Y. M. Chung, P. C. A. Bruijnincx and B. M. Weckhuysen, ChemCatChem, 2013, 5, 529 CrossRef CAS.
- A. O. Menezes, M. T. Rodrigues, A. Zimmaro, L. E. P. Borged and M. A. Fraga, Renewable Energy, 2011, 36, 595 CrossRef CAS.
- D. L. King, L. Zhang, G. Xia, A. M. Karim, D. J. Heldebrant, X. Wang, T. Peterson and Y. Wang, Appl. Catal., B, 2010, 99, 206 CrossRef CAS.
- A. G. Chakinala, W. P. M. van Swaaij, S. R. A. Kersten, D. de Vlieger, K. Seshan and D. W. F. Brilman, Ind. Eng. Chem. Res., 2013, 52, 5302 CrossRef CAS.
- K. Lehnert and P. Claus, Catal. Commun., 2008, 9, 2543 CrossRef CAS.
- E. P. Maris and R. J. Davis, J. Catal., 2007, 249, 328 CrossRef CAS.
- R. M. Ravenelle, J. R. Copeland, A. H. Van Pelt, J. C. Crittenden and C. Sievers, Top. Catal., 2012, 55, 162 CrossRef CAS.
- T. Tsukada, H. Segawa, A. Yasumorib and K. Okada, J. Mater. Chem., 1999, 9, 549 RSC.
- A. L. Jongerius, J. R. Copeland, G. S. Foo, J. P. Hofmann, P. C. A. Bruijnincx, C. Sievers and B. M. Weckhuysen, ACS Catal., 2013, 3, 464 CrossRef CAS.
- P. Colomban, J. Mater. Sci., 1989, 24, 3002 CrossRef CAS.
- M. C. Stegmann, D. Vivien and C. Mazieres, Spectrochim. Acta, Part A, 1973, 29, 1653 CrossRef.
- A. S. Barker Jr., Phys. Rev., 1963, 132, 1974 CrossRef.
- R. Norman Jones, A. F. McKay and R. G. Sinclair, J. Am. Chem. Soc., 1952, 74, 2575 CrossRef.
- M. Hasegawa and M. J. D. Low, J. Colloid Interface Sci., 1969, 30, 378 CrossRef CAS.
- F. Cavani, F. Triffiro and A. Vaccari, Catal. Today, 1991, 11, 173 CrossRef CAS.
- F. Winter, X. Xia, B. P. C. Hereijgers, J. H. Bitter, A. J. van Dillen, M. Muhler and K. P. de Jong, J. Phys. Chem. B, 2006, 110, 9211 CrossRef CAS PubMed.
| This journal is © The Royal Society of Chemistry 2016 |


