
 Open Access Article
 This Open Access Article is licensed under a Creative Commons Attribution-Non Commercial 3.0 Unported Licence
Singlet oxygen is produced from brown carbon-containing cooking organic aerosols (BrCOA) under indoor lighting†
Nadine
Borduas-Dedekind
 *a,
Keighan J.
Gemmell
a,
Madushika Madri
Jayakody
a,
Rickey J. M.
Lee
a,
Claudia
Sardena
a and
Sebastian
Zala
b
*a,
Keighan J.
Gemmell
a,
Madushika Madri
Jayakody
a,
Rickey J. M.
Lee
a,
Claudia
Sardena
a and
Sebastian
Zala
b
aDepartment of Chemistry, University of British Columbia, Vancouver, V6T 1Z1, Canada. E-mail: borduas@chem.ubc.ca; Tel: +1 604 822 4435
bDepartment of Environmental Science Systems, ETH Zürich, Zürich, 8092, Switzerland
First published on 18th April 2024
Abstract
Light absorbing organic molecules known as brown carbon (BrC) can be emitted during processes such as cooking and combustion in indoor environments. We hypothesized that indoor BrC-containing cooking organic aerosols, or BrCOA, can act as sensitizers to generate the first excited state of molecular oxygen, singlet oxygen ( ), under indoor lighting conditions. Here, we used an impinger to collect aerosols from a range of cooking dishes, including pancakes, pan-fried Brussels sprouts and vegetable stir-fries, and irradiated these samples in a photoreactor with UVA and fluorescent lights and on a sunlit windowsill. Using furfuryl alcohol as a probe for
  , we determined steady-state concentrations of
  using liquid chromatography and calculated apparent quantum yields for each BrCOA sample. Our results show that under all indoor lighting conditions tested, BrCOA can indeed sensitize
  . Specifically, in solutions of BrCOA from pancakes, pan-fried Brussels sprouts, and vegetable stir-fries under UVA light, the
  concentrations were 2.56 ± 1.24 × 10⁻¹³ M, 2.24 ± 1.51 × 10⁻¹³ M, and 3.12 ± 0.86 × 10⁻¹³ M, respectively. These results suggest that
  production is not dish-dependent, but rather produced across a range of BrCOA samples. We then normalized the
  concentrations to the rate of absorbance to obtain apparent quantum yields up to 6.1%. Both the quality and the quantity of the chromophoric BrCOA were important for predicting the apparent quantum yield. Moreover, the indoor sunlit experiments led to the highest
  concentrations observed, with important implications on the formation of oxidants in sunlit kitchens. These results demonstrate the ability of BrCOA to produce
  in indoor environments, and thus for
  to be a competitive indoor oxidant.
Environmental significanceWith the growing appreciation that indoor light can initiate photochemical processes, we hypothesized that brown carbon-containing cooking organic aerosols, or BrCOA, could sensitize the first excited state of molecular oxygen: singlet oxygen ( ). Here, we show that BrCOA from pancakes, pan-fried Brussels sprouts and vegetable stir-fries can efficiently produce ). Here, we show that BrCOA from pancakes, pan-fried Brussels sprouts and vegetable stir-fries can efficiently produce  under the irradiation of UVA, fluorescent bulbs and a sunlit windowsill. We observed a sustained production of under the irradiation of UVA, fluorescent bulbs and a sunlit windowsill. We observed a sustained production of  under all light sources, indicating that under all light sources, indicating that  can be a competitive oxidant in indoor environments and has the prolonged ability to oxidize indoor aerosols and impact air quality. can be a competitive oxidant in indoor environments and has the prolonged ability to oxidize indoor aerosols and impact air quality.
|
1 Introduction
Brown carbon (BrC) is the component of organic aerosol which absorbs in the near ultraviolet (UV) region of the visible spectra.1,2 BrC can originate from incomplete combustion processes outdoors and indoors. Cooking organic aerosols (COA) are a major source of BrC emissions indoors,3,4 and contribute to urban outdoor organic aerosols.5–7 In fact, recent studies suggest that residential cooking contributes more to urban pollution than traffic emissions.8,9 According to Zhu et al.,10 residential combustion accounts for 60% of total surface BrC concentrations in China. Furthermore, Sankhyan et al.3 reported BrC concentrations up to 10 times higher during cooking activities in the HOMEChem study.11When exposed to light, chromophoric species contained in BrC can act as photo-sensitizers, generating reactive oxygen species (ROS) via the formation of triplet state organics.12–17 Singlet oxygen ( ) is a ROS and is the first excited state of molecular oxygen (O2), produced by indirect photochemistry.18 Faust and Allen19 reported the first measurements of
  steady state concentrations (
 ) in cloud water, 2.7–110 × 10−13 M. Subsequently, fog water, cloud water and aqueous solutions of ambient particulate matter have been shown to produce
  under laboratory irradiated conditions.20–27
Unlike the outdoor environment, indoor spaces do not receive full spectrum sunlight (290 nm to 800 nm), as most of the shorter wavelengths (<320 nm) are attenuated by windows.28,29 Historically, the oxidative capacity of the indoor environment has been thought to be governed by non-photolytic reactions and instead by physical transport of oxidants such as ozone from outdoors.29 However, there is growing evidence that high-enough energy photons are indeed available indoors to initiate indoor photochemistry.28,30 Kowal et al.31 showed that direct and indirect sunlight from the windows and fluorescent tubes can initiate indoor photolysis of nitrous acid (HONO) and formaldehyde (HCHO) leading to the formation of OH radicals and HO2 radicals. HONO has also been observed to be formed indoors from photochemistry on glass windows.32 In addition, OH radicals have been detected in concentrations up to 1.8 × 10⁶ molecules per cm3 in a sunlit classroom where indoor solar irradiation with wavelengths as low as 320 nm penetrated through glass windows.33
Combining this recent evidence of indoor photochemistry and the ability of cooking to form BrC, we considered the ability of brown carbon-containing cooking organic aerosols (BrCOA) to initiate photochemical species such as triplet state organics and subsequently  . We hypothesized that BrCOA could act as sensitizers to generate
  under indoor lighting conditions.
In this study, we report the first measurements of  from BrCOA produced under indoor light. We selected 3 types of dishes to represent a range of pan-cooking events and to produce diverse COA representative of breakfast, lunch and dinner. First, pancake experiments were chosen to represent exposure to indoor BrC during breakfast. Next, pan-fried Brussels sprouts were chosen based on the HOMEChem study where Brussels sprouts were part of the Thanksgiving dinner and generated high concentrations of BrC and COA.34,35 Finally, we chose the vegetable stir-fry following the work by Patel et al.34 identifying this dish as producing high amounts of large particles, including PM20. In addition, Davies et al.36 have recently demonstrated that VOC emissions from stir-fry are dominated by alcohols and contain aldehydes and terpenes from heating of oil and spices, potentially acting as chromophoric species in BrCOA. We collected the water-soluble portion of the BrCOA using an impinger and irradiated the filtered solutions under UVA, fluorescent and sun-light through a window to represent a range of indoor light conditions within a home kitchen. We found that all types of dishes and lights effectively produced
  with implications for indoor air quality.
2 Methods
2.1 Chemicals
Furfuryl alcohol (FFA, Sigma-Aldrich, 98%) was distilled under reduced pressure to a colourless liquid according to Armarego and Chai37 and stored under N2 in the fridge. para-Nitroanisole (Millipore-Sigma, 97%) was recrystallized in petroleum ether.37 Perinaphthenone (97%), pyridine (≥99.9%), and 2-propanol (HPLC grade, ≥99.9%) were purchased from Millipore-Sigma and used as is. All solutions were prepared using 18.2 MΩ cm Milli-Q water (ELGA Labwater, Purelab Option-Q model).2.2 Experimental cooking setup
Cooking aerosol sampling experiments took place in the laboratory (Fig. S1†). A cooking plate, a pan and a spatula were used to cook the dishes. Foodstuff was bought at the local grocery store. The dishes included pancakes, Brussels sprouts, and vegetable stir-fries (see the ESI† for the list of ingredients and the recipes).Before, during and after the experiments, a scanning mobility particle sizer (SMPS) (Model 3082. TSI Inc.), an optical particle sizer (OPS 3330, TSI Inc.) were used to measure COA. A Coriolis μ impinger (Bertin Technologies, France) was used to collect the ambient and cooking aerosols (Fig. S1†). Prior to sampling COA, background lab air was sampled for 60 min using the Coriolis impinger, and subsequently the COA were also sampled for 60 min.
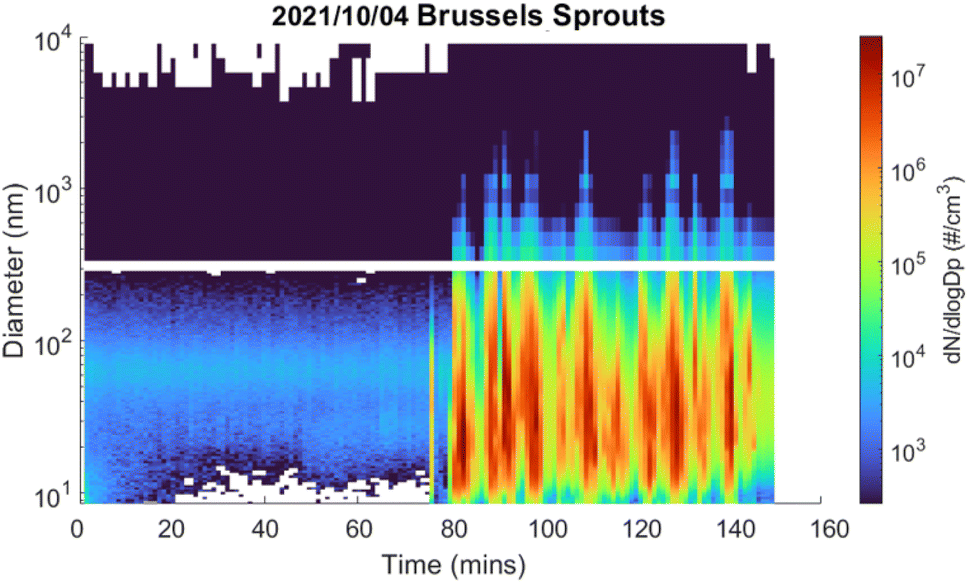 | ||
| Fig. 1 The number concentration and diameter of COA produced during 1 h of pan-frying Brussels sprouts following a 1 h ambient background aerosol measurement. The lower size range was measured by the SMPS and the larger size range was measured by the OPS. The cooking evidently started at 75 min. Recipes and ingredients are in the ESI.† | ||
Prior to the measurement, the Coriolis μ impinger, the inlet and the sampling cones were autoclaved and washed with Milli-Q water. 15 mL of Milli-Q water was added to the sampling cone as the collection liquid and the Coriolis was programmed for 10 min. The collection cone was refilled to 15 mL every 10 min. During the collection, air was drawn into the cone at a flow rate of 300 L min−1, creating a vortex inside the sampling cone and allowing the larger particles and the water-soluble components to be captured within the aqueous solution.39 This technique does have its limitations however, as the particle collection efficiency drops below 0.5 μm.38
Collected COA were subsequently diluted into 50 mL and filtered through 0.22 μM, 33 mm, PES-GP sterile syringe filters. Filtering was necessary to remove oil from the COA and suspended particulates, as the presence of the oil and particulates prevented homogeneous light exposure in our setup. Our samples therefore represent a subset of BrCOA and hence a lower bound of the potential photochemistry investigated. The background aerosol solutions were clear and colorless. Filtered COA and background samples were stored in the refrigerator at 4 °C in 40 mL amber vials.
2.3 UV/Vis measurements
To characterise the chromophores within the COA solutions, we measured the absorbance of the filtered samples using a UV/Vis spectrometer (Carry-5000, Agilent). A baseline correction with filtered Milli-Q water was applied to all the measurements. Furthermore, we ensured that the absorbance of all samples reached zero at 800 nm and integrated our data for apparent quantum yield calculations up to 800 nm as recommended in Ossola et al.182.4 Irradiation experiments
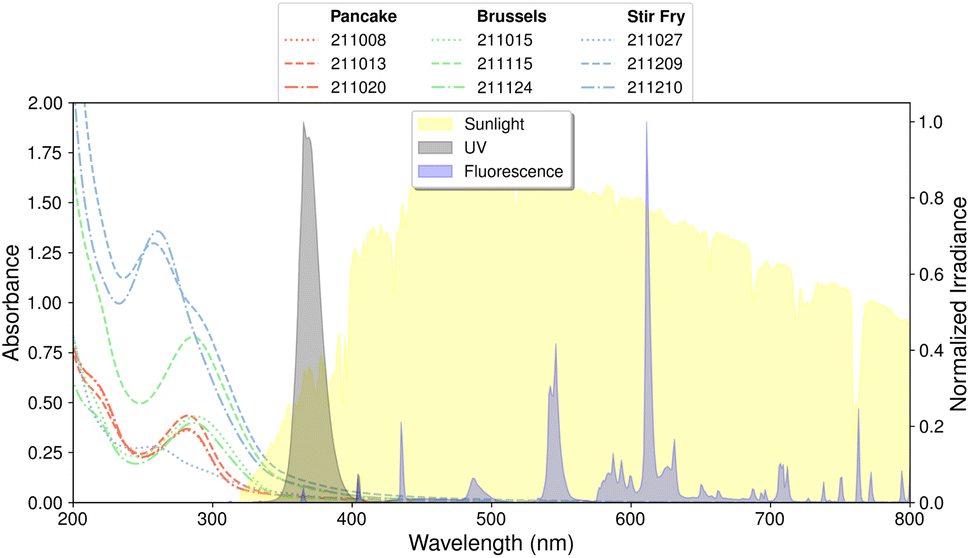 | ||
| Fig. 2 The absorbance of the BrCOA are plotted as a function of wavelength and are colour-coded by dish type: pancake BrCOA (red), Brussels sprouts BrCOA (green) and stir-fry BrCOA (blue). Individual samples correspond to the date of collection in the YY-MM-DD format. The normalized irradiance of the three sources of indoor light is plotted on the right y-axis. The sunlight spectrum was measured during the window sunlit experiment on May 15, 2022. An inset of these spectra is available as Fig. S3.† | ||
2.5 Quantification of  steady-state concentrations

 .43,44 For an irradiation experiment, the sample solution was added to a borosilicate test tube with 50 μM of FFA and 10 μM of isopropanol. The isopropanol was used as an OH radical scavenger to ensure that the FFA decay is solely due to reactivity with
  .24
.24
To monitor the decay of FFA as a function of illumination, 75 μL aliquots were sampled at different time points and analyzed by high performance liquid chromatography (HPLC, Agilent technologies, USA) coupled with a diode array detector (DAD). The HPLC was equipped with a reverse phase C18 column (5 μm; 4.6 × 150 mm) and a photodiode array detector (G4212B 1260 DAD). Using the DAD detector, maximum absorbance of FFA was measured at 219 nm.43 The flow rate was set to 1 mL min−1, and the gradient method included 3 min at 75/25 (water/ACN), 3 min at 50/50, 2 min at 25/75 (water/ACN), and 2 min at 100% water, for a total run duration of 10 min. FFA was monitored at 219 nm (ref. 24) and observed at a retention time of 1.57 min.
 steady-state concentration calculation.
 steady state concentrations can be calculated by using pseudo-first order rate kinetics of the FFA probe.18,44 The second order rate constant of the reaction of FFA with
  is well constrained and has the following temperature dependence: kFFA [L mol−1 s−1] = 1 × 10⁸ + 2.1 × 10⁶(T[°C] − 22).44 The temperature of the photoreactor in our experimental set up was 30 °C, and we therefore used the temperature-corrected FFA rate constant of 1.19 × 10⁸ M−1 s−1 for the UVA and the fluorescent lights experiments. For the sunlight experiment, we used the FFA rate constant of 1.00 × 10⁸ M−1 s−1 at 22 °C.
From the obtained HPLC chromatograms, we monitored the decay of FFA over irradiation time. We then plotted the natural log of this decay, ln([FFA]t/[FFA]0) as a function of time to obtain kobs following eqn (1), and subsequently divided kobs by the temperature-dependent FFA rate constant kFFA to obtain the  from eqn (2).
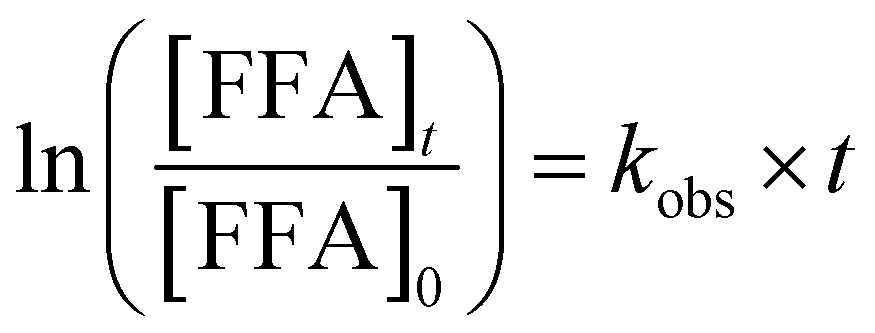 | (1) |
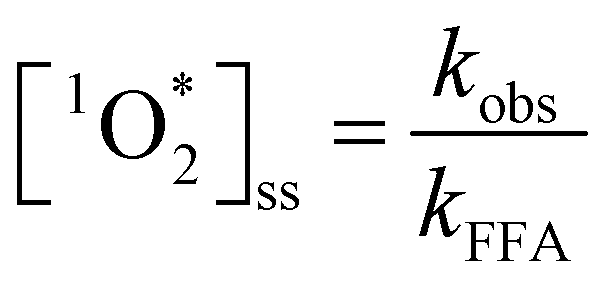 | (2) |
The effectiveness of FFA as a probe for  relies on its pseudo-first order kinetics. We observed that experiments with longer exposure times, and thus lower
  production, sometimes deviated from pseudo-first order kinetics. In particular, experiments with fluorescent tubes resulted in non-linear regressions at longer irradiation, indicating that these time points were no longer experiencing steady-state concentrations of
  (Fig. S5†). We addressed this issue by determining the percentage change in slope by removing the later time points which deviated from pseudo-first order kinetics. A change in slope greater than 25% led to the removal of these points (see top panels of Fig. S4–S6† for all raw data, and bottom panels for the adjusted linear regressions).
 . Dark controls were performed using 50 μM FFA and covering the test tube with aluminium foil. No decay was observed, confirming the photochemical requirement for these reactions to proceed. All COA had a corresponding background ambient air sample which was also run with 50 μM FFA and 10 μM of isopropanol. The background ambient air samples showed no quantifiable FFA decay, indicating that the reactivity was due to BrCOA (Fig. S7†).
2.6 Relative probe based method for apparent quantum yield calculations
 is not known, and instead BrCOA is a complex mixture of chromophores. We quantified apparent
  quantum yields using perinapthenone (PN) as a reference sensitizer.18,45 A solution of 50 μM of FFA, 10 μM of isopropanol and 10 μM of perinapthenone (PN) was used as the reference sensitizer solution for each irradiation experiments. The solution with perinapthenone was irradiated for only 8 minutes, due to its high quantum yield, and time points were taken throughout the irradiation. FFA decays due to its reaction with perinapthenone for all experiments conducted are shown in Fig. S8.†
 sensitizer with a wavelength-independent quantum yield of 1.18 As
  is in steady state conditions for all sensitizers, including our reference sensitizer, apparent
  quantum yields can be calculated as:
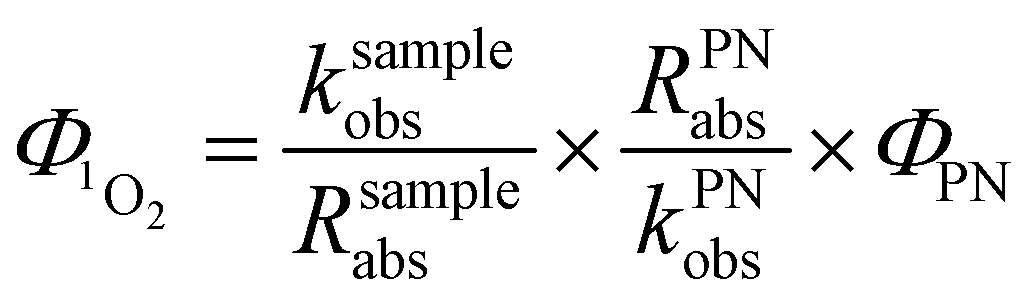 | (3) |
 | (4) |
 .23
.23
2.7 Chemical actinometry
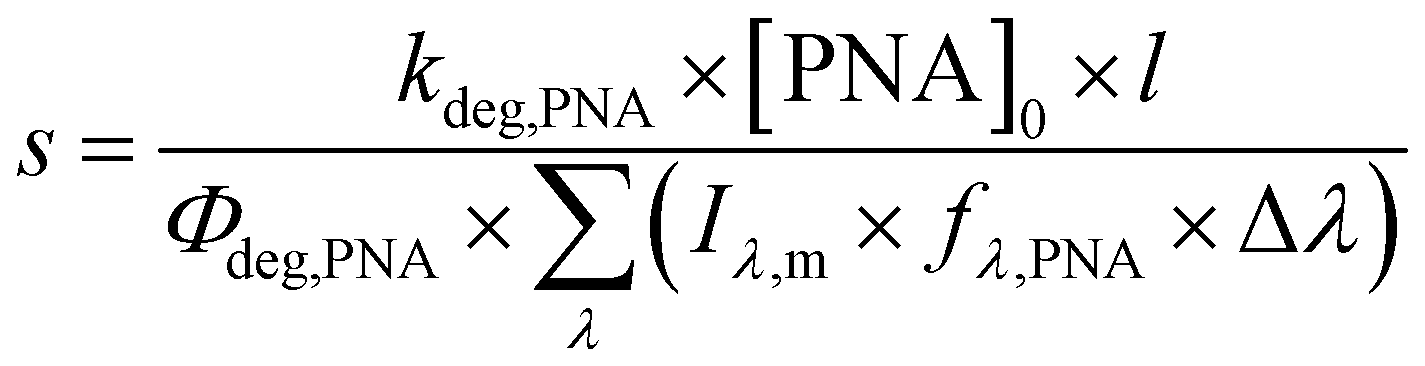
A solution containing 20 μM of recrystallized para-nitroanisole and 0.25 mM pyridine in Milli-Q water was irradiated for 5 h in the photoreactor.41 Samples were taken at different irradiation time points, and para-nitroanisole was quantified using high pressure liquid chromatography (HPLC) equipped with a reverse phase C18 column (5 μm; 4.6 × 150 mm) and a photodiode array detector (G4212B 1260 DAD). Analyses were performed using the isocratic mode and a 50/50 eluent of acetonitrile and 90% acetate butter (pH = 6) in 10% acetonitrile. The flow rate was set to 1 mL min−1 and the sample injection volume was 20 μL. Under these conditions, para-nitroanisole eluted at 3.8 min and was detected at 316 nm. The pseudo first-order decay rate for para-nitroanisole (kdeg,PNA) was determined to be 7.73 ± 0.44 × 10⁻⁵ s−1 for UVA and 5.86 ± 0.65 × 10⁻⁶ s−1 for fluorescent lights. Errors are reported as the standard deviation of triplicate experiments shown in Fig. S9.†
| Iλ,0 = s × Iλ,m | (5) |
 | (6) |
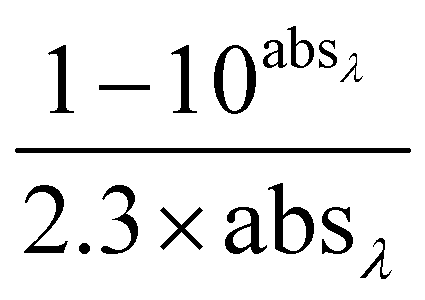
| fλ,PNA = 1 − 10−ελ,PNA×[PNA]0×l | (7) |
Based on the kdeg,PNA values and the spectral irradiance measurements for UVA and fluorescent light obtained by the spectrophotometer, we calculated the absolute spectral irradiance (integrated for 280–400 nm) of these photochemistry setups as Iλ,0 = 222.45 ± 10 W m2 and Iλ,0 = 11.25 ± 3.96 W m2, respectively. In order to compare the irradiance sources, we determined a conversion factor from the irradiation time in the photoreactor into the equivalent irradiation time in sunlight and fluorescent.42
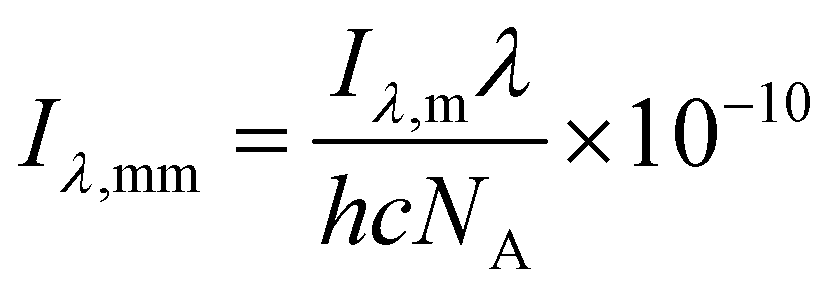
We report Rabs in molphotons L−1 s−1 nm−1 for apparent quantum yield calculations, but we report absolute irradiance in W m−2 nm−1 and converted to mmolphotons cm−2 s−1 nm−1 as below.18
 | (8) |
 | (9) |
 | (10) |
3 Results
3.1 COA production
The cooking experiments produced substantial amounts of cooking organic aerosols (COA). The indoor mass concentrations were 177 to 282 μg m−3 when making pancakes, 304 to 1900 μg m−3 when pan-frying Brussels sprouts, and 610 to 1710 μg m−3 when cooking a vegetable stir-fry (Table 1). These mass concentrations were significantly above the background; the SMPS and OPS measured consistently low number concentrations prior to cooking (Fig. 1 and S10†). For example, in Fig. 1, the pan-cooking began at 75 min, producing up to 107 particles per cm3 in this particular Brussels sprouts cooking event on October 4, 2021.| Sample | Date sampled | Pre-cooking | During cooking | ||
|---|---|---|---|---|---|
| MM/DD | Ave. total conc. (μg m−3) | Total OA collected (μg) | Ave. total conc. (μg m−3) | Total COA collected (μg) | |
| Pancake | 10/08 | 1.63 | 0.20 | 177 | 21.2 |
| Pancake | 10/13 | 2.58 | 0.31 | 282 | 33.8 |
| Pancake | 10/20 | 3.62 | 0.43 | 282 | 33.9 |
| Brussels sprouts | 10/04 | 1.18 | 0.14 | 656 | 78.7 |
| Brussels sprouts | 11/15 | 0.72 | 0.09 | 304 | 36.4 |
| Brussels sprouts | 11/24 | 2.05 | 0.24 | 1900 | 288 |
| Stir-fry | 10/27 | 2.65 | 0.32 | 610 | 73.2 |
| Stir-fry | 12/09 | 0.68 | 0.08 | 1590 | 191 |
| Stir-fry | 12/10 | 0.98 | 0.12 | 1710 | 205 |
The total mass of COA was between 21.2 and 288 μg, and represents the upper bound of possible COA collected in the impinger (Table 1). The solutions were subsequently diluted to 50 mL, yielding a mass concentration range of 0.4 to 5.8 mg L−1. We aimed to have these COA concentrations on the same order of magnitude of the concentration of organic matter in cloud water39,42,46 as well as allow us to run photochemical experiments without significant screening of organic material.
Many variables affect the emissions of COA: the ingredients, the oil, the spices, the temperature of the pan, the air flow around the cooking experiment, and more.3,4,47 For example, Sankhyan et al.3 observed varying COA concentrations among different meals such as stir-fry, breakfast, chili and Thanksgiving meals prepared during the HOMEChem study,11 highlighting the variability in COA emissions. The mass loadings we observed are also comparable with cooking activities ranging from pizzerias to Indian food stalls including dim sum and Korean BBQ.6
3.2 BrCOA production
The COA were collected directly into an aqueous solution by the Coriolis μ impinger, thereby avoiding any solvent extraction issues which can significantly affect the sinks of .18 These solutions were filtered to remove any particulates and measured using the UV/Vis spectrometer (see Methods for further details) (Fig. 2). These COA samples were light-absorbing and so we are naming the chromophoric subset of COA: brown cooking organic aerosols (BrCOA). The absorbance spectra of all BrCOA showed the characteristic absorbance of BrC with a sharp absorbance peak in the near UV region (Fig. 2). Furthermore, we observed important variability in absorbance among these BrCOA samples. All three pancake BrCOA had similar absorbance and a similar peak around 280 nm, likely indicative of chromophores with similar functional groups (Fig. 2). The Brussel sprout BrCOA also had similar types of chromophores based on the absorbance profile, but at different concentrations between the cooking events. Finally, the stir-fry BrCOA had the most variability in the absolute absorbance likely since it was composed of the largest variety of ingredients (see ESI† for ingredient list) (Fig. 2).
We used three different types of indoor lights to probe the range of wavelengths available to drive indoor photochemistry: natural sunlight through a window, UVA bulbs and fluorescent tubes (Fig. 2). To quantify the overlap between the relative intensities of the three light sources depicted in Fig. 2 and the absorbance of the BrCOA samples, we next determined the rate of absorbance for each solution with each light source.
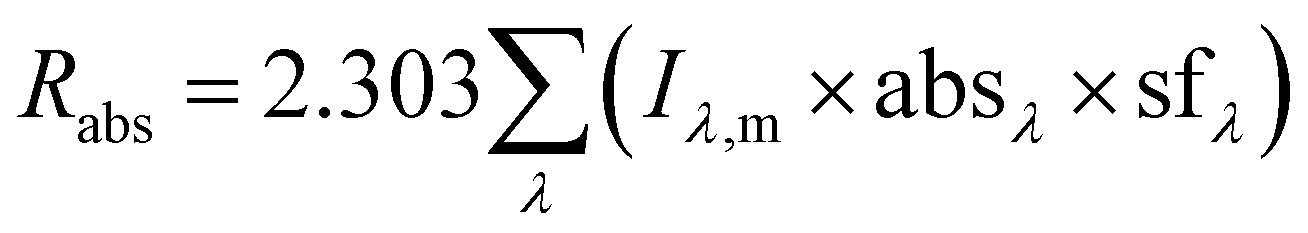
3.3 Rates of absorbance
The rate of absorbance (Rabs) is defined as the fraction of light absorbed by the chromophores present in each sample (eqn (4)). Rabs significantly depends on the emission spectra of the light source (Fig. 2). The spectral overlap is an order of magnitude less for fluorescent tubes compared to UVA and sunlight, indicating that less BrCOA molecules were excited under the fluorescent tubes (Fig. 3B). Consequently, the variability in absorbance measured from the BrCOA extracts has a negligible impact on Rabs. Rather, the order of magnitude of the Rabs value is governed by the light source. We further use the Rabs parameter to normalize the production of each sample and to calculate the apparent quantum yields of
  (see section 3.5).
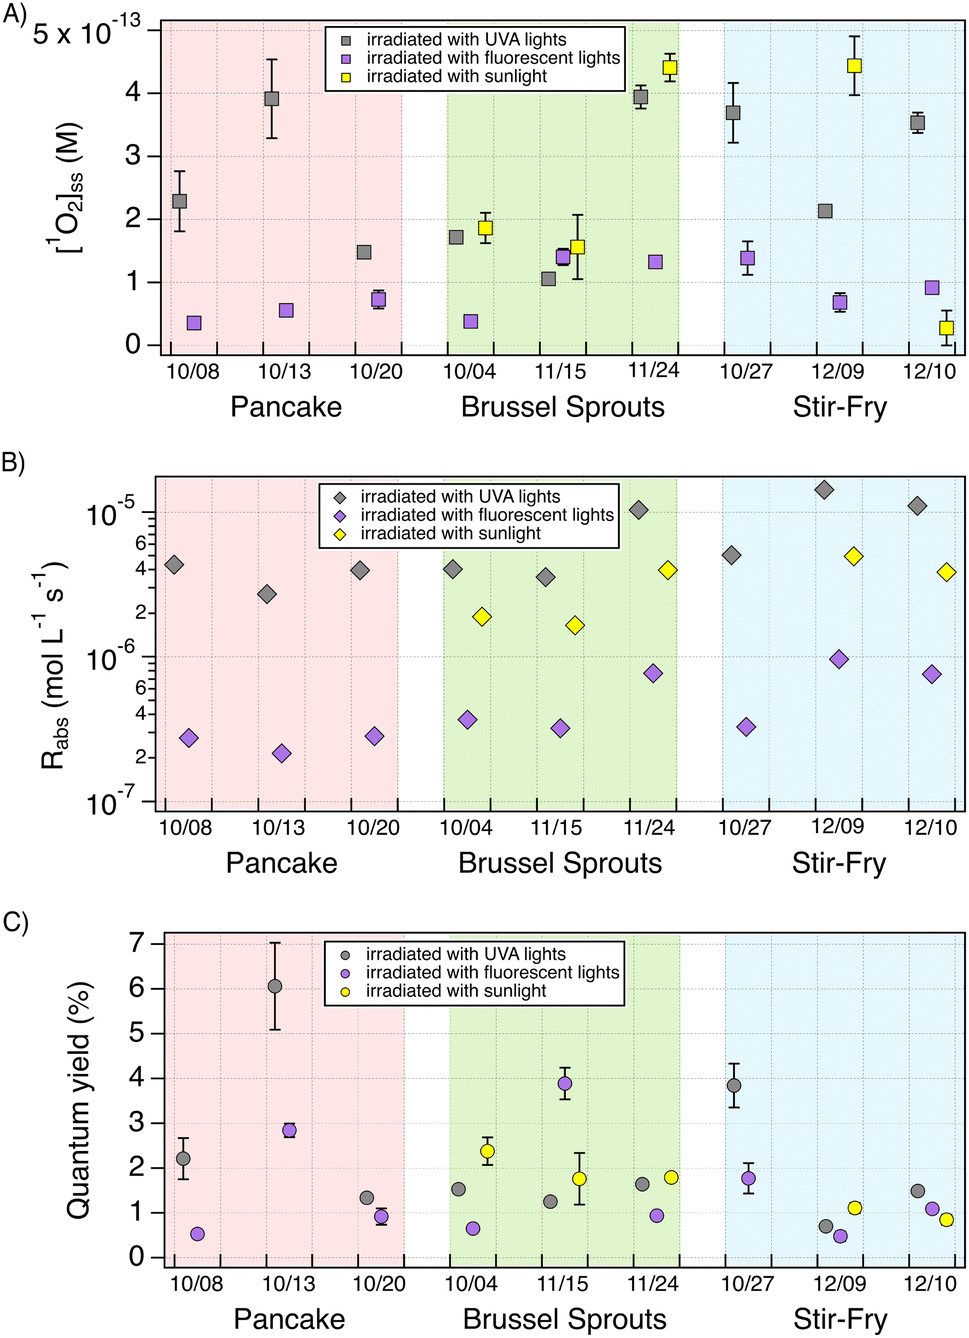 | ||
Fig. 3 The singlet oxygen steady state concentrations ( ) (A), the rate of absorbance (Rabs) (B), and the apparent quantum yields (C) are plotted as a function of dish type, pancake (red), Brussels sprouts (green), stir-fry (blue) and under UVA lights (gray), fluorescent tubes (purple) and sunlight (yellow). The rate of absorbance is in the log scale. Each cooking experiment was conducted in triplicate on separate days with a new set of ingredients, and experiments were ran under the three types of lights, except for sunlight which depended on weather conditions. The error bars were calculated from the linear regression of the kobs values. ) (A), the rate of absorbance (Rabs) (B), and the apparent quantum yields (C) are plotted as a function of dish type, pancake (red), Brussels sprouts (green), stir-fry (blue) and under UVA lights (gray), fluorescent tubes (purple) and sunlight (yellow). The rate of absorbance is in the log scale. Each cooking experiment was conducted in triplicate on separate days with a new set of ingredients, and experiments were ran under the three types of lights, except for sunlight which depended on weather conditions. The error bars were calculated from the linear regression of the kobs values. | ||
3.4
 production by BrCOA

 production requires chromophoric species, O2, and light, which are all present indoors. We measured
  steady state concentrations (
 ) using FFA as a
  probe following eqn (2) (Fig. S4–S6†). Note that the background ambient aerosol solutions did not have a quantifiable FFA decay for any irradiation source, demonstrating unambiguously that the BrCOA solutions (and not the lab ambient aerosols) are responsible for the
  production (Fig. S7†). The average (
 ) in pancake, pan-fried Brussels sprouts, and vegetable stir-fry BrCOA under UVA light were 2.56 ± 1.24 × 10⁻¹³ M, 2.24 ± 1.51 × 10⁻¹³ M and 3.12 ± 0.86 × 10⁻¹³ M, respectively (Fig. 3). Under fluorescent tubes, we observed
  of 5.46 ± 1.87 × 10⁻¹⁴ M, 1.04 ± 0.57 ××10−13 M, and 9.96 ± 3.58 × 10⁻¹⁴ M for pancakes, Brussels sprouts, and vegetable stir-fry, respectively. Finally, under the window sunlit conditions, we observed an average
  of 2.61 ± 1.56 × 10⁻¹³ M and 2.36 ± 2.94 × 10⁻¹³ M for Brussel sprouts and stir-fry, respectively. We observed higher concentrations of
  generated under sunlight and UVA light compared to fluorescent tubes for the same COA sample (Fig. 3A).
Cooking temperature, ingredients, stirring frequency, etc. can have a significant impact on the food's emission factors, which frequently vary by orders of magnitude. It is therefore remarkable that all dishes and light conditions produced measurable  up to concentrations of 4.5 × 10⁻¹³ M (Fig. 3A). These
  concentrations are comparable to illuminated ambient particulate matter extracts collected in Switzerland23,24 and in Hong Kong.26 These concentrations are an order of magnitude lower than particulate matter collected in Davis, California.20,48 Yet indoor
  are an order of magnitude higher than PM2.5 in Colorado.25 Nevertheless, these values can be difficult to compare as they do not take into account different photon fluxes from different photochemical setups.
3.5 Apparent quantum yields of BrCOA
Typically, higher concentrations of chromophores would be expected to lead to higher , and thus we need to normalize to the concentrations of BrCOA in each sample. To normalize
  concentrations, we calculated the apparent quantum yield values by dividing the
  by the Rabs according to the relative rate method using perinaphthenone as a reference sensitizer (Fig. 3).18 Apparent quantum yield values take the absorbance-irradiation spectral overlap into account and therefore highlight best the differences in chromophoric species responsible for the
  sensitization in BrCOA (eqn (4)).
If the differences in  across BrCOA samples were solely due to differences in concentration of chromophores, then the apparent quantum yields would be identical. Indeed, the Oct 20th pancake sample, the Nov 24th Brussels sprout sample and the Dec 10th stir-fry samples have the same apparent quantum yield under fluorescent light, despite having different
  (Fig. 3). In these cases, the variability in the
  in Fig. 3A could be accounted for by the variability in Rabs in Fig. 3B, and thus by different concentrations of chromophores.
Moreover, we observed remarkably efficient  sensitization with apparent quantum yields up to 6.1% under UVA lights for the Oct 13th pancake BrCOA (Fig. 3C). This result was driven by high
  despite a low Rabs (Fig. 3A & B) and points to the role of low absorbing but highly efficient chromophores capable of sensitizing
  . In other words, some samples have “quality” chromophores as was reported by Bogler et al.24 for aged organic aerosols. Bogler et al.24 reported apparent quantum yield values of PM2.5 extracts only up to 2% over the course of a year of sampling in Switzerland. Kaur et al.20 found apparent quantum yields of roughly 4% for brown carbon extracts, while surface water extract apparent quantum yields of 4% to 8% were reported by Zhou et al.49 Our measurements of apparent
  quantum yields for indoor BrCOA fall within the range of previous studies.
Overall, we observe that both the “quantity” and the “quality” of chromophores present in BrCOA are important in predicting the ability of BrCOA to produce  in lit indoor environments. The apparent quantum yields obtained confirm that the incomplete combustion of organic matter, whether from biomass burning or from cooking aerosols, are effective sensitizers of
  even under indoor lighting conditions with important implications for the oxidative potential of BrCOA.50,51
4 Atmospheric implications
4.1 Photochemistry of BrCOA
There is a growing body of evidence demonstrating that indoor light can initiate photochemical processes indoors, and here we show for the first time that can be produced indoors by irradiating chromophores present in BrC-containing cooking organic aerosols (BrCOA). The concentration and the sensitizing ability (i.e. the quantity and the quality) of the chromophores in BrCOA led to apparent quantum yields of
  of up to 6.1%. On average though, the values were similar to typical apparent quantum yields of 1–2% in outdoor particulate matter extracts.24,27 Furthermore, the sources of light did not sensitize
  to the same efficiency, and indoor sunlight was the most effective in our experimental setup. Nevertheless, emitted BrCOA in a windowless environment can disperse in a kitchen environment, especially under poor ventilation, leading to BrCOA interacting with indoor light fixtures either above a stove or on the ceiling. Understanding the effect of the light source and its distance from an emitted plume of BrCOA is warranted.
The production of  confirms indirectly the production of excited triplet state organics within BrCOA.52 We are therefore proposing that two additional types of oxidants, namely
  and by extension excited triplet state organics, are present indoors and can participate in oxidizing BrCOA under lit indoor environments. We expect that
  is contributing to BrCOA aging, and to oxidation state increases observed for example by Takhar et al.53 From cooking oils alone, there is the potential of generating reactive oxygen species within BrCOA, likely from unsaturated aldehydes as precursors to peroxides.54 This result can be extended to our study where we used olive oil and sunflower oil, as we expect unsaturated aldehydes to absorb at higher wavelengths due to their conjugated π-system. Furthermore, the presence of quinones in BrCOA could also be partly responsible for the observed
  sensitization.50,51,55 Quinones are oxidation products of naphthalene,56 and were observed previously in SOA by Manfrin et al.23 to produce
  in apparent quantum yields up to 11%.
4.2 Sustained  as a competitive oxidant in indoor environments
In this study, we aimed to capture the most variability in our 
 sensitization experiments by reproducing each dish-specific cooking experiment on three separate days with ingredients purchased on different days (ingredients and recipes are detailed in the ESI†). In other words, we purposefully created maximum variability in our experiments to understand when and why
  would be produced.
We report concentrations of  on the order of 10−13 M. These concentrations represent 3 orders of magnitude higher concentrations than OH radicals.23 However, OH radicals have rate constants with common organic molecules which are 3 orders of magnitude more reactive than
  .23 Thus,
  can be a competitive reactive oxygen species.
Furthermore, the sunlit experiments indicate that  can be sustained for over 40 min of irradiation (Fig. S6†). These steady-state concentrations suggest that the production of
  is not occurring as a burst of oxidant, which has been observed for OH radicals for example by Paulson et al.,57 but rather as a sustained production of
  over time. This sustained
  could then lead to
  having a prolonged ability to oxidize indoor aerosols and impact air quality.
4.3 Indoor air quality
There is also growing evidence that exposure to ultrafine particles from cooking are linked to adverse health effects.58,59 Laursen et al.60 observed oxidatively damaged DNA in blood after exposure to COA, but only observed a weak association between short-term exposure to emissions from cooking to inflammation in individuals with mild asthma. Recommendations for reducing exposure to cooking aerosols would include increased ventilation and air filtration,61 particularly since many residents are unaware of the benefits of ventilation.62 The cooking method can have an impact on the number and mass concentrations of emitted BrCOA. For instance, a domestic air fryer produced up to 5 times more PM10 than pan cooking, which can lead to more BrCOA.63 Overall, presence of in indoor environments opens questions about the fate, transformations and lifetime of
  in the built environment.
Author contributions
NBD designed the research. MMJ and RL ran the cooking experiments. MMJ collected the UV/Vis and data. NBD, KG and CS developed the data analysis procedure. NBD and KG analysed and plotted the UV/Vis and
  data. RL collected and analysed the SMPS and OPS data. NBD and SZ developed the cooking experimental setup and the impinger collection method. NBD and KG wrote the manuscript with contributions from RL, MMJ and CS.
Conflicts of interest
There are no conflicts to declare.Acknowledgements
The authors thank the Natural Sciences and Engineering Council (NSERC) of Canada and the University of British Columbia for funding. We also acknowledge funding from the Alfred P. Sloan Foundation for work on indoor air chemistry. We acknowledge Benjamin Herring for help with the HPLC and Allan Bertram for lending the OPS.Notes and references
- A. Laskin, J. Laskin and S. A. Nizkorodov, Chem. Rev., 2015, 115, 4335 CrossRef CAS PubMed.
- R. F. Hems, E. G. Schnitzler, C. Liu-Kang, C. D. Cappa and J. P. Abbatt, ACS Earth Space Chem., 2021, 5, 722–748 CrossRef CAS.
- S. Sankhyan, S. Patel, E. F. Katz, P. F. DeCarlo, D. K. Farmer, W. W. Nazaroff and M. E. Vance, Environ. Sci.: Processes Impacts, 2021, 23, 1476–1487 RSC.
- S. Sankhyan, K. Zabinski, R. E. O’Brien, S. Coyan, S. Patel and M. E. Vance, Environ. Sci.: Atmos., 2022, 2, 1364–1375 CAS.
- C. Mohr, P. F. DeCarlo, M. F. Heringa, R. Chirico, J. G. Slowik, R. Richter, C. Reche, A. Alastuey, X. Querol, R. Seco, J. Peñuelas, J. L. Jiménez, M. Crippa, R. Zimmermann, U. Baltensperger and A. S. H. Prévôt, Atmos. Chem. Phys., 2012, 12, 1649–1665 CrossRef CAS.
- X. Zhao, Q. Hu, X. Wang, X. Ding, Q. He, Z. Zhang, R. Shen, S. Lü, T. Liu, X. Fu and L. Chen, J. Atmos. Chem., 2015, 72, 1–18 CrossRef CAS.
- Y. Omelekhina, A. Eriksson, F. Canonaco, A. S. H. Prevot, P. Nilsson, C. Isaxon, J. Pagels and A. Wierzbicka, Environ. Sci.: Processes Impacts, 2020, 22, 1382–1396 RSC.
- M. Takhar, Y. Li, J. C. Ditto and A. W. H. Chan, Environ. Sci.: Processes Impacts, 2023, 25, 165–175 RSC.
- M. Crippa, P. F. DeCarlo, J. G. Slowik, C. Mohr, M. F. Heringa, R. Chirico, L. Poulain, F. Freutel, J. Sciare, J. Cozic, C. F. Di Marco, M. Elsasser, J. B. Nicolas, N. Marchand, E. Abidi, A. Wiedensohler, F. Drewnick, J. Schneider, S. Borrmann, E. Nemitz, R. Zimmermann, J.-L. Jaffrezo, A. S. H. Prévôt and U. Baltensperger, Atmos. Chem. Phys., 2013, 13, 961–981 CrossRef.
- Y. Zhu, Q. Wang, X. Yang, N. Yang and X. Wang, Atmosphere, 2021, 12, 892 CrossRef CAS.
- D. K. Farmer, M. E. Vance, J. P. D. Abbatt, A. Abeleira, M. R. Alves, C. Arata, E. Boedicker, S. Bourne, F. Cardoso-Saldaña, R. Corsi, P. F. DeCarlo, A. H. Goldstein, V. H. Grassian, L. H. Ruiz, J. L. Jimenez, T. F. Kahan, E. F. Katz, J. M. Mattila, W. W. Nazaroff, A. Novoselac, R. E. O'Brien, V. W. Or, S. Patel, S. Sankhyan, P. S. Stevens, Y. Tian, M. Wade, C. Wang, S. Zhou and Y. Zhou, Environ. Sci.: Processes Impacts, 2019, 21, 1280–1300 RSC.
- Y. B. Lim, Y. Tan, M. J. Perri, S. P. Seitzinger and B. J. Turpin, Atmos. Chem. Phys., 2010, 10, 10521–10539 CrossRef CAS.
- B. Ervens, B. J. Turpin and R. J. Weber, Atmos. Chem. Phys., 2011, 11, 11069–11102 CrossRef CAS.
- T. Fang, P. S. J. Lakey, R. J. Weber and M. Shiraiwa, Environ. Sci. Technol., 2019, 53, 12784–12792 CrossRef CAS PubMed.
- H. Tong, P. S. J. Lakey, A. M. Arangio, J. Socorro, F. Shen, K. Lucas, W. H. Brune, U. Pöschl and M. Shiraiwa, Environ. Sci. Technol., 2018, 52, 11642–11651 CrossRef CAS PubMed.
- A. M. Arangio, H. Tong, J. Socorro, U. Pöschl and M. Shiraiwa, Atmos. Chem. Phys., 2016, 16, 13105–13119 CrossRef CAS.
- S. Wang, Y. Zhao, A. W. H. Chan, M. Yao, Z. Chen and J. P. D. Abbatt, Chem. Rev., 2023, 123, 1635–1679 CrossRef CAS PubMed.
- R. Ossola, O. M. Jönsson, K. Moor and K. McNeill, Chem. Rev., 2021, 121, 4100–4146 CrossRef CAS PubMed.
- B. C. Faust and J. M. Allen, J. Geophys. Res.: Atmos., 1992, 97, 12913–12926 CrossRef CAS.
- R. Kaur, J. R. Labins, S. S. Helbock, W. Jiang, K. J. Bein, Q. Zhang and C. Anastasio, Atmos. Chem. Phys., 2019, 19, 6579 CrossRef CAS.
- R. Kaur and C. Anastasio, Atmos. Environ., 2017, 164, 387–397 CrossRef CAS.
- R. Kaur and C. Anastasio, Environ. Sci. Technol., 2018, 52, 5218 CrossRef CAS PubMed.
- A. Manfrin, S. Nizkorodov, K. Malecha, G. Getzinger, K. McNeill and N. Borduas-Dedekind, Environ. Sci. Technol., 2019, 53, 8553–8562 CrossRef CAS PubMed.
- S. Bogler, K. R. Daellenbach, D. M. Bell, A. S. H. Prévôt, I. El Haddad and N. Borduas-Dedekind, Environ. Sci. Technol., 2022, 56, 15389–15397 CrossRef CAS PubMed.
- F. Leresche, J. R. Salazar, D. J. Pfotenhauer, M. P. Hannigan, B. J. Majestic and F. L. Rosario-Ortiz, Environ. Sci. Technol., 2021, 55, 13152–13163 CAS.
- Y. Lyu, Y. H. Lam, Y. Li, N. Borduas-Dedekind and T. Nah, Atmos. Chem. Phys., 2023, 23, 9245–9263 CrossRef CAS.
- L. Ma, R. Worland, L. Heinlein, C. Guzman, W. Jiang, C. Niedek, K. J. Bein, Q. Zhang and C. Anastasio, Atmos. Chem. Phys., 2024, 24, 1–21 CrossRef CAS.
- S. Zhou, S. F. Kowal, A. R. Cregan and T. F. Kahan, Indoor Air, 2021, 31, 1187–1198 CrossRef CAS PubMed.
- C. J. Young, S. Zhou, J. A. Siegel and T. F. Kahan, Environ. Sci.: Processes Impacts, 2019, 21, 1229–1239 RSC.
- A. Gandolfo, V. Gligorovski, V. Bartolomei, S. Tlili, E. Gómez Alvarez, H. Wortham, J. Kleffmann and S. Gligorovski, Build. Environ., 2016, 109, 50–57 CrossRef.
- S. F. Kowal, S. R. Allen and T. F. Kahan, Environ. Sci. Technol., 2017, 51, 10423–10430 CrossRef CAS PubMed.
- J. Liu, H. Deng, P. S. J. Lakey, H. Jiang, M. Mekic, X. Wang, M. Shiraiwa and S. Gligorovski, Environ. Sci. Technol., 2020, 54, 15680–15688 CrossRef CAS PubMed.
- E. Gómez Alvarez, D. Amedro, C. Afif, S. Gligorovski, C. Schoemaecker, C. Fittschen, J.-F. Doussin and H. Wortham, Proc. Natl. Acad. Sci. U. S. A., 2013, 110, 13294–13299 CrossRef PubMed.
- S. Patel, S. Sankhyan, E. K. Boedicker, P. F. DeCarlo, D. K. Farmer, A. H. Goldstein, E. F. Katz, W. W. Nazaroff, Y. Tian, J. Vanhanen and M. E. Vance, Environ. Sci. Technol., 2020, 54, 7107–7116 CrossRef CAS PubMed.
- S. Patel, D. Rim, S. Sankhyan, A. Novoselac and M. E. Vance, Environ. Sci.: Processes Impacts, 2021, 23, 1706–1717 RSC.
- H. L. Davies, C. O'Leary, T. Dillon, D. R. Shaw, M. Shaw, A. Mehra, G. Phillips and N. Carslaw, Environ. Sci.: Processes Impacts, 2023, 25, 1532–1548 RSC.
- W. L. F. Armarego and C. Chai, Purification of Laboratory Chemicals, Butterworth-Heinemann, Boston, 7th edn, 2013, pp. 103–554 Search PubMed.
- M. Gómez-Domenech, H. García-Mozo, P. Alcázar, R. Brandao, E. Caeiro, V. Munhoz and C. Galán, Aerobiologia, 2010, 26, 149–155 CrossRef.
- S. Müller, C. Giorio and N. Borduas-Dedekind, ACS Environ. Au, 2023, 3, 164–178 CrossRef PubMed.
- E. F. Katz, H. Guo, P. Campuzano-Jost, D. A. Day, W. L. Brown, E. Boedicker, M. Pothier, D. M. Lunderberg, S. Patel, K. Patel, P. L. Hayes, A. Avery, L. Hildebrandt Ruiz, A. H. Goldstein, M. E. Vance, D. K. Farmer, J. L. Jimenez and P. F. DeCarlo, Aerosol Sci. Technol., 2021, 55, 1099–1114 CrossRef CAS.
- J. R. Laszakovits, S. M. Berg, B. G. Anderson, J. E. O'Brien, K. H. Wammer and C. M. Sharpless, Environ. Sci. Technol. Lett., 2017, 4, 11–14 CrossRef CAS.
- N. Borduas-Dedekind, R. Ossola, R. O. David, L. S. Boynton, V. Weichlinger, Z. A. Kanji and K. McNeill, Atmos. Chem. Phys., 2019, 19, 12397–12412 CrossRef CAS.
- W. R. Haag, J. Hoigné, E. Gassman and A. Braun, Chemosphere, 1984, 13, 631–640 CrossRef CAS.
- E. Appiani, R. Ossola, D. E. Latch, P. R. Erickson and K. McNeill, Environ. Sci.: Processes Impacts, 2017, 19, 507–516 RSC.
- R. Schmidt, C. Tanielian, R. Dunsbach and C. Wolff, J. Photochem. Photobiol., A, 1994, 79, 11–17 CrossRef CAS.
- R. D. Cook, Y.-H. Lin, Z. Peng, E. Boone, R. K. Chu, J. E. Dukett, M. J. Gunsch, W. Zhang, N. Tolic, A. Laskin and K. A. Pratt, Atmos. Chem. Phys., 2017, 17, 15167 CrossRef CAS.
- S. Wang, M. Takhar, Y. Zhao, L. N. S. Al Rashdi and A. W. H. Chan, ACS Earth Space Chem., 2021, 5, 1150–1162 CrossRef CAS.
- W. Jiang, L. Ma, C. Niedek, C. Anastasio and Q. Zhang, ACS Earth Space Chem., 2023, 7, 1107–1119 CrossRef CAS PubMed.
- H. Zhou, S. Yan, L. Lian and W. Song, Environ. Sci. Technol., 2019, 53, 2482–2490 CrossRef CAS PubMed.
- Y. Yang, M. A. Battaglia, E. S. Robinson, P. F. DeCarlo, K. C. Edwards, T. Fang, S. Kapur, M. Shiraiwa, M. Cesler-Maloney, W. R. Simpson, J. R. Campbell, A. Nenes, J. Mao and R. J. Weber, ACS ES&T Air, 2024, 1, 188–199 Search PubMed.
- Y. Liu and C. K. Chan, Environ. Sci.: Processes Impacts, 2022, 24, 525–546 RSC.
- K. McNeill and S. Canonica, Environ. Sci.: Processes Impacts, 2016, 18, 1381 RSC.
- M. Takhar, Y. Li and A. W. H. Chan, Atmos. Chem. Phys., 2021, 21, 5137–5149 CrossRef CAS.
- S. Wang, P. J. Gallimore, C. Liu-Kang, K. Yeung, S. J. Campbell, B. Utinger, T. Liu, H. Peng, M. Kalberer, A. W. Chan and J. P. Abbatt, Environ. Sci. Technol., 2023, 57, 1246–1256 CrossRef CAS PubMed.
- L. Gerritz, M. Schervish, P. S. J. Lakey, T. Oeij, J. Wei, S. A. Nizkorodov and M. Shiraiwa, J. Phys. Chem. A, 2023, 127, 5209–5221 CrossRef CAS PubMed.
- R. D. McWhinney, S. Zhou and J. P. D. Abbatt, Atmos. Chem. Phys., 2013, 13, 9731–9744 CrossRef.
- S. E. Paulson, P. J. Gallimore, X. M. Kuang, J. R. Chen, M. Kalberer and D. H. Gonzalez, Sci. Adv., 2019, 5, eaav7689 CrossRef CAS PubMed.
- L. A. Wallace, H. Mitchell, G. T. O'Connor, L. Neas, M. Lippmann, M. Kattan, J. Koenig, J. W. Stout, B. J. Vaughn, D. Wallace, M. Walter, K. Adams, L.-J. S. Liu and Inner-City Asthma Study, Environ. Health Perspect., 2003, 111, 1265–1272 CrossRef CAS PubMed.
- L. Wallace and W. Ott, J. Exposure Sci. Environ. Epidemiol., 2011, 21, 20–30 CrossRef CAS PubMed.
- K. R. Laursen, N. V. Christensen, F. A. Mulder, J. Schullehner, H. J. Hoffmann, A. Jensen, P. Møller, S. Loft, A.-C. Olin, B. B. Rasmussen, B. Rosati, B. Strandberg, M. Glasius, M. Bilde, T. Sigsgaard and The Climate Chamber Group, Part. Fibre Toxicol., 2023, 20, 26 CrossRef CAS PubMed.
- J. Li, G. Fan, Y. Ou and Q. Deng, Energy Build., 2023, 294, 113232 CrossRef.
- L. Sun and B. C. Singer, J. Exposure Sci. Environ. Epidemiol., 2023, 33, 439–447 CrossRef PubMed.
- X. Wang and A. W. H. Chan, Environ. Sci. Technol., 2023, 57, 17384–17392 CrossRef CAS PubMed.
Footnote |
| † Electronic supplementary information (ESI) available. See DOI: https://doi.org/10.1039/d3ea00167a |
| This journal is © The Royal Society of Chemistry 2024 |