 Open Access Article
Creative Commons Attribution 3.0 Unported Licence
Characterising the mechanical properties of soft solids through acoustics and rheology, exemplified by anhydrous milk fat†
Megan J.
Povey
 *a and
Daniel Ingo
Hefft
 bc
bc
aUniversity of Leeds School of Food Science and Nutrition, Woodhouse Lane, LEEDS LS2 9JT, UK. E-mail: m.j.w.povey@food.leeds.ac.uk
bSchool of Chemical Engineering, University of Birmingham, Edgbaston Campus, Birmingham B15 2TT, UK
cCampden BRI, Station Road, Chipping Campden GL55 6LD, UK
First published on 17th October 2023
Abstract
Foods vary in their elastic properties over a wide range of behaviours. In the case of mastication, textures vary from hard solid through brittle (chocolate bar) and crispy/crunchy (biscuits) to viscous and extensional flow (syrup) and finally very low viscosity fluid (water). Here we deploy an elastic description of soft solids which embraces all these behaviours to quantify the elastic behaviour of food, in particular through the use of sound. We illustrate the use of this mathematical description in the quantitative characterisation of the elastic and flow properties of food through orthodox measurement techniques and novel ultrasound methods. Measurement is complicated by human sensory capabilities that span the entire range from solid to fluid to gas in an integrated manner, during the appreciation of food. We use acoustic and rheological measurement techniques for the determination of the mechanical properties of soft solids, comparing oscillatory rheometry with acoustic parameters as exemplified by acoustic and oscillatory rheometry measurements in crystallising anhydrous milk fat (AMF). We conclude that acoustic and rheological measurements complement each other with acoustic techniques offering the possibility of inline, in process determination of mechanical and flow properties such as viscosity, rigidity, compressibility and bulk modulus.
Introduction
Foods vary in their elastic properties1 over a wide range of behaviours. In the case of mastication, textures vary from hard solid through brittle (chocolate bar) and crispy/crunchy (biscuits) to viscous and extensional flow (syrup) and finally very low viscosity fluid (water) and even gases.Soft solids are non-Newtonian fluids that can behave either like a solid or like a liquid, depending on the stress it is subjected to.2,3 Characterising these materials is a non-trivial task.
There is a burgeoning interest in the soft solid properties of foods with at least one Journal issue devoted either wholly or partially to the subject.4 Soft solid properties in foods often emerge from processes occurring over multiple scales, from the molecular through mesoscale (optical microscopy) and finally the individual fruit, vegetable or helping of spread. An example of such a process involves crystal nucleation and growth such as occurs during manufacture of fatty spreads.5 When food is digested, the resulting soft solid is disassembled, reversing the original emergent process. For this reason, soft solid properties in many foods need to be understood as part of the process of inspection, mastication and on multiple scales, from molecular (∼nm) through mesoscale (∼micrometers) to the bulk (∼centimetres5). In the case of fruit and vegetables, soft solid properties emerge during growth, storage, and senescence. Measurement is further complicated by human sensory capabilities that span the entire range from solid to fluid to gas in an integrated manner, during the appreciation of food.
Structural properties of foods have been related to their elastic properties by several authors in the past.6–10 In this paper We demonstrate how to measure the mechanical properties of soft solids using acoustic and rheological methods, and we develop a theoretical framework that allows us to compare the results from oscillatory rheometry and acoustic parameters. We apply these methods to crystallising anhydrous milk fat (AMF) and show how acoustic and rheological measurements can provide complementary information about the viscosity, rigidity, compressibility, and bulk modulus of the material.
“Soft solids” from an elastic perspective
Soft solids, also known as visco-elastic materials, represent an intriguing class of substances to the scientific community as their mechanical properties lie between those of traditional rigid solids and viscous fluids. These materials exhibit both solid-like characteristics, such as maintaining their overall shape, and liquid-like behaviour, allowing for significant deformations under applied stress.11The deformation behaviour of soft solids is typically quantified by the stress–strain relationship, which describes how the material responds to external mechanical forces. In the case of linearly elastic materials, Hooke's law relates stress, σ, and strain, ε, through a constant called the elastic modulus, E:
| σ = E·ε | (1) |
However, for soft solids, this relationship can become non-linear at larger strains due to the rearrangement and interactions of their microstructures. Non-linear models, such as the Ogden or neo-Hookean models, are employed to describe their stress–strain behaviour more accurately.
The Ogden model12 is based on the strain energy density function, W, which describes the energy stored in a material due to deformation and can accommodate the complex stress–strain behaviour observed in soft solids, making it suitable for a wide range of applications in biomedical engineering, soft robotics, and material design.
However, for practical reasons, the neo-Hookean model is often used as it is a simpler representation of the non-linear behaviour of soft solids13 and is particularly useful for materials that exhibit nearly incompressible behaviour providing a good approximation for small to moderate deformations in soft solids and has been widely used in engineering towards certain microstructure properties.
One of the distinctive characteristics of soft solids is their visco-elastic behaviour, which combines features of viscosity and elasticity. When subjected to stress, soft solids exhibit time-dependent responses. The relaxation modulus, G(t), is a fundamental parameter in characterizing visco-elasticity. It quantifies the material's ability to relax and dissipate stress over time, indicating the gradual return to its original state after deformation.
Mathematically, the relaxation modulus is related to the stress relaxation function, R(t), representing the stress decay with time, through the Laplace transform:
 | (2) |
Soft solids also exhibit creep behaviour, which refers to their time-dependent deformation under a constant applied stress. The creep compliance, J(t), characterises the material's strain response over time when subjected to constant stress. Like the relaxation modulus, the creep compliance is related to the creep compliance function, C(t), representing the strain development with time under constant stress, through the Laplace transform:
 | (3) |
Rheology is a crucial aspect of soft solids, dealing with their flow and deformation behaviour. Soft solids' visco-elastic nature leads to complex flow responses, particularly under oscillatory stress. The complex viscosity, η*, is a key parameter in rheology, representing the material's resistance to flow.15
The complex viscosity comprises two components: the storage modulus, η′, characterising the elastic response of the material, and the loss modulus, η′′, representing the viscous response.
| η* = η′ + iη′′ | (4) |
Acoustics and “Soft solids”
Ultrasound waves are mechanical waves that propagate through a medium, including soft matter foods, by transferring energy through particle oscillations. These waves exhibit longitudinal compressional behaviour, where particles vibrate parallel to the direction of wave propagation. In the case of soft matter foods, these particles represent the constituents of the material, such as water, oil, or protein molecules.The behaviour of mechanical waves, including ultrasound, is governed by the wave equation, which describes how the wave's amplitude evolves over both time and space. For one-dimensional wave propagation, the wave equation can be expressed as:
 | (5) |
 represents the acceleration of particles over time, and the second term,
  represents the curvature of the wavefront in space. The constant c is the speed of sound in the medium, which depends on the material's properties, such as density and compressibility.
For soft matter foods, which are typically visco-elastic, the wave equation can be modified to incorporate the effects of visco-elasticity. The generalised wave equation becomes:
 | (6) |
When ultrasound waves propagate through a soft matter (food), they interact with its microstructure, leading to changes in wave behaviour. As the ultrasound waves encounter interfaces between different phases within the food, such as solid–gel or liquid–air interfaces, reflections and refractions occur due to acoustic impedance mismatches. This acoustic impedance, Z, at an interface between two media is defined as the product of the material's density, ρ, and the speed of sound, c:
| Z = ρ·c | (7) |
In addition to impedance mismatches, ultrasound waves experience attenuation as they traverse through the soft matter food. This attenuation is due to various phenomena, including scattering, absorption, and visco-elasticity.
Scattering occurs when the waves encounter in-homogeneities or microstructural elements within the soft matter food, causing changes in the direction of wave propagation.
Absorption involves the conversion of ultrasound energy into heat as it interacts with the constituents of the material. Visco-elastic properties of soft matter foods also contribute to attenuation, with energy being dissipated as the waves interact with the material's structure. For a detailed description of ultrasound scattering see Povey16 and Morse and Ingard.17
During propagation, the ultrasound wave interacts with the constituents of the soft matter, such as water molecules, proteins, and other molecules. This interaction leads to the dissipation of ultrasound energy. The rate of absorption of ultrasound energy can be quantified using the absorption coefficient, α, which represents the fraction of ultrasound energy absorbed per unit distance travelled in the soft matter.
The change in acoustic pressure, ΔP, due to absorption as the ultrasound wave travels through a small distance dx in the soft matter can be described as:
| ΔP = −α·Pincident(x,t)·dx | (8) |
 | (9) |
 represents the spatial gradient of the acoustic pressure, and α is the attenuation coefficient, quantifying the rate of ultrasound intensity reduction as it propagates through the soft matter food. The detailed nature of the ultrasound attenuation coefficient is addressed in the next section.
Rheology, acoustics, and the complex moduli
Rheology and acoustics share a common basis in the physics and mathematics of elastic materials, and both begin from generalisations of force/stress and displacement/strain. The most general statements involve relations between a stress (force per unit area) tensor and a strain (or strain-rate) tensor, which need not be linear, isotropic or even time reversible.16,18It might be thought that compressional waves involve only normal stresses whilst rheology is often about shear stresses. However normal stresses contain a term depending on viscosity and as observed by Stokes.19,20 the compressional wave is therefore linked with viscosity, mostly in the dissipation (attenuation terms).
The relationship between fluid viscosity ηlong [Pa s] and longitudinal sound attenuation αlong [Np m−1] was first derived by Stokes. Pierce21 and Morse & Ingard17 present a more general expression for the longitudinal attenuation αlong that incorporates thermal effects:
 | (10) |
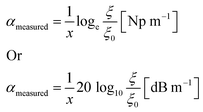
Eqn (10) does not apply at extremely high frequency. The equation is low frequency because of the neglect of second order terms in the thermal and viscous contributions; the frequency range of validity is therefore below around (1014 Hz in water). It should be emphasised at this point that other phenomena (scattering, molecular relaxation, diffraction) may form a significant component of the measured attenuation, in addition to viscosity. αlong is often called the classical attenuation ∝classical. The total attenuation ∝ is measured by determining the reduction of signal amplitude as a function of the distance travelled by the wave x.24
Pressure p is proportional to amplitude A or displacement ξ squared, p ∼ ξ2. We can then define the attenuation in terms of measurable pressure differences as
 | (11) |
 | (12) |
 ) term in eqn (5) must be accounted for.24 The relationship between acoustic wavelength and the size of the inhomogeneities generating scattering dinhomogeneity is very frequency dependent and the various limits λ > dinhomogeneity, λ ∼ dinhomogeneity and λ < dinhomogeneity give rise to different phenomena, particularly scattering phenomena.25
In general,
| αmeasured = αlong + αscattering | (13) |
Where
 | (14) |
It is therefore important, in the first place, to verify the frequency-squared dependence of the attenuation and account for those mechanisms not associated with viscosity.
In most liquids, the ratio of specific heats is close to one (in water at 10 kPa and 25 °C it is 1.0106) and the thermal term is usually neglected, so that rearranging (eqn (10) we get:)
 | (15) |
 | (16) |
 | (17) |
 | (18) |
In fluids and soft solids K′ ≫ G′, for example in a yoghurt G′ ∼ a few Pa whilst K′ is ∼1010 Pa so that the velocity of compressional sound in liquid media is:
 | (19) |
 | (20) |
| M′′ = K′′ + 4/3G′′ = ηlongω | (21) |
The relationship between length of the longitudinal wave, and the size and geometry of sample is important, due to additional restoring forces arising at boundaries when the longitudinal acoustic wavelength is of the order of or greater than any sample dimension. These additional forces result in acoustic parameters becoming a function of sample geometry, heterogeneity, and dimensions. In the following we assume that the longitudinal wavelength is always smaller than any dimension of a sample holder.
In the field of shear acoustics27 a highly attenuated shear wave propagates over just a few wavelengths and much more slowly28 than the longitudinal wave. Oscillatory shear rheology29 shares much in common with shear acoustics. The speed of an acoustic shear wave is given by:16
 | (22) |
 | (23) |
Relationships and variables widely used in practical rheology are reprised here. For a complex shear modulus:
| G* = G′ + iG′′ | (24) |
| G = |G*|eiδ | (25) |
 | (26) |
where δ is the phase angle between stress and strain which varies between π/2 for fluids when G′ = 0, to 0 in the case of elastic solids where G′′ = 0. The stress–strain relations can be written
 | (27) |
 | (28) |
![[small gamma, Greek, dot above]](https://www.rsc.org/images/entities/i_char_e0a2.gif) is shear strain rate [s−1]. In general, and particularly in soft solid materials τ and γ are complex quantities as is G.
is shear strain rate [s−1]. In general, and particularly in soft solid materials τ and γ are complex quantities as is G.
For a harmonic strain, for example in an oscillatory system where
| γ = γ0ei(ωt+δ) | (29) |
![[small gamma, Greek, dot above]](https://www.rsc.org/images/entities/i_char_e0a2.gif) = iωγ0 = iωγ0 | (30) |
| τ = iωηsγ | (31) |
| G = iωηs | (32) |
| G′′ = ωηs | (33) |
Results and discussion, experimental
Anydrous milk fat (AMF)
Rheological characterisation of a material such as anhydrous milk fat is challenging because of the many orders of magnitude change that occurs in viscosity and rigidity and due to the growth of crystalline material which imparts soft solid properties. Two measurement geometries were used (double gap concentric cylinder for the melt and cone and plate for the crystallising material).Methods and materials
Absolute acoustic attenuation values over the frequency range 2 to 100 MHz were measured using a Malvern Ultrasizer-MSV. The working principle of this ultrasound spectrometer is described in detail elsewhere.23,31 Measurements were carried out with the stirrer set at an angular speed of 240 rpm (Heidolph RZR 2051) and a torque determined to within ±1 N m. Stirring the sample reduces flocculation and creaming effects and controls temperature with a precision ±0.2 °C throughout the sample volume. Temperature control by a Huber (MiniStat cc) is accurate to ±0.2 °C and the in-cell thermometer is similarly accurate. Attenuation is determined absolutely, including appropriate diffraction corrections with a total error of ±1 dB. Frequency measurement is accurate to 1 Hz.Anhydrous milk fat (AMF) was kindly provided by Arla Foods (Denmark) and without any further purification, pre-shear or homogenization protocol. Samples were heated in a glass beaker on a hot plate with magnetic stirrer to 65 °C for 30 minutes to ensure dissolution of high-melting crystalline lipids32 at which temperature 500 ml of AMF was poured into the Ultrasizer cell. The sample was then cooled whilst stirring at 240 rpm in steps (43, 40, 36, 26, 23, and 19 to 17 °C) and then held isothermally at each temperature for 30 minutes to allow thermal equilibration. Subsequently three measurements of attenuation spectra were taken, approximately 7 minutes apart and obtaining the average of three attenuation spectra. The range 19 to 17 °C appears because it proved impossible to hold the 500 ml sample at a constant temperature whilst it was crystallising extensively. The measured stirrer torque varied between 1.9 N cm at the highest temperature to 5.2 N cm at the lowest temperature. Overall, temperature control achieved is accurate to within ±0.5 °C.
Speed of sound was measured in a Resoscan RU(RZ21) (TF Instruments, Heidelberg) high precision ultrasound resonator system allowing simultaneous velocity and attenuation measurements33 The system includes a two-channel resonator unit with gold plated lithium niobate piezo crystals, two 250 μl sample cells and a Peltier thermostat. Temperature control and measurement are performed via two external units enabling a resolution of 0.001 °C and precision of ±0.005 °C. The instrument features a small sample requirement of 170–250 μl and a high temperature stability. At about 25 °C the sound velocity in an ultrapure deionized water standard (MilliQ, resistivity >18 MΩ cm) changes by around 5 m s−1 °C−1. Therefore, the precision limit of temperature corresponds to a systematic error in velocity of around 0.025 m s−1. The fundamental frequency of the instrument is 10 MHz, with range of 7 to 11.5 MHz; the precise frequency is automatically selected to maximise the quality factor of the acoustic resonant cell according to the sample properties.
Shear rheology measurements were carried out in an Anton Paar MCR 302 rheometer (Anton Paar GmbH, Austria) at a controlled strain of 0.001%, temperature controlled to within ±0.05 °C, oscillatory (1 Hz, 6.28 rad s−1) amplitude sweep measurements with a cone and plate configuration (1 degree cone angle, 50 mm diameter). Viscosity in the AMF melt was measured in a Kinexus Lab+ rheometer (Malvern Panalytical UK) using a double gap geometry (DG 25 cup and SW114155 bob) with a 1 mm gap, cup internal diameter 26.25 mm bob internal diameter 23 mm. external diameter 25 mm and immersed height 57.5 mm, 1 Hz oscillation, 1% controlled strain. Samples were prepared in the same way as for the Ultrasound measurements.
Results and discussion
During cooling, AMF becomes a soft solid with inhomogeneity characterised by large crystal clusters (Fig. 1). These clusters agglomerate and create an additional elastic modulus called the ‘frame modulus’34 and have a significant impact on the rheology and the acoustics. The ‘frame modulus’ describes the stiffness of the structure formed by the crystal network and is defined as the ratio of the stress to the strain in the frame. However, it is difficult to separate the frame modulus from the other components of the elastic modulus of the crystallising material. To illustrate the microstructure, we sandwiched a small amount of sample preheated to 65 °C in between 2 glass microscope slides separated by 5 mm. Cooling the sample was achieved by convective heat loss to the environment at an average rate of 0.2 °C min−1. Digital images of the sample at various temperatures were acquired with a Canon DLSR camera at 40× magnification attached to a Leitz Dialux 22 polarised microscope (Leica, Germany). Similar images can be found in ref. 35.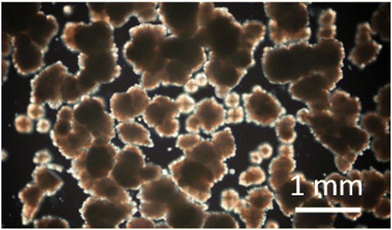 | ||
| Fig. 1 Polarised optical microscopy pictures of AMF crystals and crystal clusters formed during cooling. | ||
Complex shear modulus determined by conventional shear rheology
The authors of a detailed study of the rheology of pure AMF and its blends with rapeseed oil35 point out that shearing of the sample changes the crystallisation behaviour during cooling. Hence, they subjected the sample to a period of no shear whilst cooling the sample from 65 °C down to 15 °C at 5 °C min−1 and then held isothermally with different shear rates of 0, 1, 50 and 500 s−1. Low frequency oscillatory shear measurements of the real part of the shear modulus are also given in ref. 25, 36 and 37.Published data37,38 for AMF indicates that G′ is independent of frequency up to an angular frequency of 500 rad s−1 (∼80 Hz), and it is therefore reasonable to conclude that our low frequency measurements (70 rad s−1) of G′ may be used at the high frequency of our ultrasound data. This assumption is supported by our observation of approximately Newtonian behaviour of the AMF melt at the lower end of the ultrasound frequency range studied here and reported below.
Our measurements of the viscosity of AMF melt indicate a temperature dependent viscosity of log![[thin space (1/6-em)]](https://www.rsc.org/images/entities/char_2009.gif) 10(ηs) = −0.155T − 0.0597 where T is °C which gives a viscosity of 0.03 Pa s at 40 °C. Our measured values of ηs, G′ and G′′ for the melt are given in Table 1.
10(ηs) = −0.155T − 0.0597 where T is °C which gives a viscosity of 0.03 Pa s at 40 °C. Our measured values of ηs, G′ and G′′ for the melt are given in Table 1.
| Temperature | η long | η b | η s | M′ | M′′ | G′ | |G*| | G′′ | G′′ | K′ | K′′ | ρ 57 | c long | |
|---|---|---|---|---|---|---|---|---|---|---|---|---|---|---|
| Pre-exponential factor | Exponent | |||||||||||||
| 2–10 MHz | 2–10 MHz | 10 MHz | 1 Hz, 70 rad s−1 | 10 MHz Fig. 3 | 10 MHz | 1 Hz, 70 rad s−1 | 1 Hz, 70 rad s−1 | 1 Hz, 70 rad s−1 | 10 MHz | 10 MHz | 10 MHz | 10 MHz | ||
| Fig. 5 eqn (20) | Fig. 5 | Fig. 5 eqn (16) | This work | Eqn (18) and (19) | Eqn (18) | Fig. 2 | Fig. 2 | Fig. 2 | Eqn (33) | Fig. 3 eqn (19) | Eqn (21) | Fig. 3 | ||
| °C | Pa s | Pa s | Pa s | GPa | MPa | Pa | Pa | Pa | MPa | GPa | MPa | kg m−3 | m s−1 | |
| 43 | 0.41 | 0.035 | 0.29 | 0.03 | 1.99 | 22.22 | 40.00 | 5.65 | 0.565 | 5.65 | 1.99 | 14.7 | 900.02 | 1488.00 |
| 40 | 0.41 | 0.035 | 0.29 | 0.03 | 1.99 | 22.22 | 78.13 | 5.65 | 0.565 | 5.65 | 1.99 | 14.7 | 900.02 | 1488.00 |
| 36 | 0.38 | −0.006 | 0.33 | 0.04 | 2.03 | 23.33 | 69.90 | 5.65 | 0.565 | 5.65 | 2.03 | 15.8 | 900.02 | 1500.00 |
| 26 | 0.61 | −0.055 | 0.51 | 0.05 | 2.12 | 33.38 | 78.82 | 5.65 | 0.565 | 5.65 | 2.12 | 25.8 | 900.02 | 1535.00 |
| 23 | 1.30 | −0.31 | 0.96 | 0.06 | 2.18 | 40.01 | 71.21 | 5.65 | 0.565 | 5.65 | 2.18 | 32.5 | 900.03 | 1555.00 |
| 19–17 | 18.42 | −1.69 | 3.95 | 0.06 | 1.97 | 23.63 | 79.73 | 12.3 | 0.565 | 5.65 | 1.97 | 16.1 | 900.03 | 1480.00 |
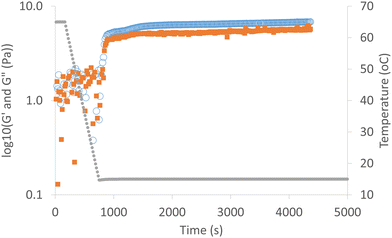
As the sample cools and crystals form, we observed the emergence of a storage modulus of order MPa, this is the elastic, solid-like part of the shear modulus. Our own data for AMF Fig. 2 is consistent with the appearance of soft solid material G′ ≫ G′′ when AMF is cooled to 15 °C as described above. We note a significant disparity between the oscillatory shear data for AMF in ref. 35 where |G*| at the end of cooling has a value of 0.3 MPa whilst in ref. 37G′ has the corresponding value of 1.2 MPa. These disparities are likely due to different stirring conditions40 and are also influenced by the fact that G′ ≫ G′′; for example, eqn (26) indicates that G′ > G* is physically impossible. Other rheological measurements in AMF also show that G′, G′′ and hence ηs are highly dependent on shear conditions during measurement.35
The most consistent comparable rheological data is available for the crystallisation of Palm Oil39 which exhibits similar crystallisation behaviour to AMF with an approximate value 0.09 Pa s for the molten material,38 (rising to extremely variable values at 22 °C in the range 0.6 to 10 Pa s).
Elastic modulus determined by acoustic velocity spectroscopy
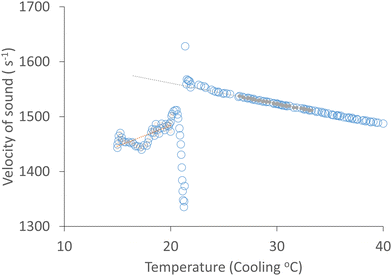
In Fig. 3 we plot the velocity of sound (Resoscan, ∼10 MHz) against temperature for AMF cooling down at a constant rate of 0.035 °C min−1 from 40 °C to 15 °C. The velocity of sound cannot be measured reliably in the Resoscan when crystalline material is in equilibrium with its melt due to the transfer of acoustic energy into the crystallising system.41 Like other animal fats,42 AMF comprises a wide range of triacylglycerol materials and as a result does not have a sharp melting point and possesses a wide melting range. Data is further confused by the existence of a frame modulus (defined above) associated with crystalline material and associated dissipation mechanisms which are poorly understood. Nevertheless, accurate speed of sound data was measured over a wide range of temperatures prior to the onset of crystallisation and whilst the behaviour of the measured speed of sound in the crystallising region is complicated, data is nevertheless still available. Crystallisation is also a kinetic process, so this is not a constitutive relationship but rather depends on the cooling rate and shearing conditions.Determination of longitudinal viscosity from acoustic attenuation measurements
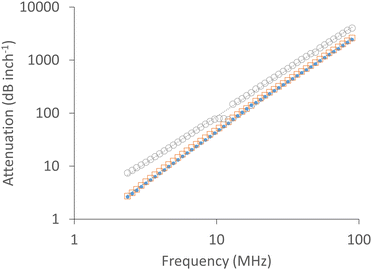
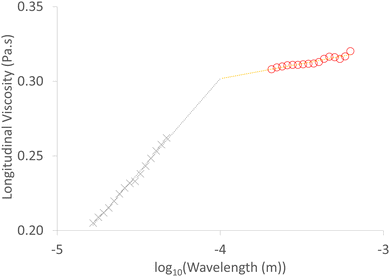
We use measurements of the ultrasound attenuation spectrum between 2 and 100 MHz (Fig. 4), and the velocity of sound measured in the Resoscan (Fig. 3) to determine the longitudinal viscosity of AMF using eqn (20). The results are plotted in Fig. 5 as a function of ultrasound wavelength. Recent measurements of AMF bulk viscosity were included in previous works.23The longitudinal viscosity was transformed to the corresponding imaginary part of the longitudinal modulus (eqn (21)); the corresponding (imaginary) shear modulus at the ultrasonic frequency was obtained from the shear viscosity as described above, thus also determining the imaginary part of the bulk modulus (which directly relates to bulk viscosity). We have therefore determined both real and imaginary parts of the bulk modulus at ultrasonic frequencies from acoustic speed and attenuation measurements, together with an estimate of shear viscosity from low frequency rheological measurements. This analysis treats the material as homogeneous, with any dissipation mechanisms being attributed to the bulk viscosity and shear viscosity.
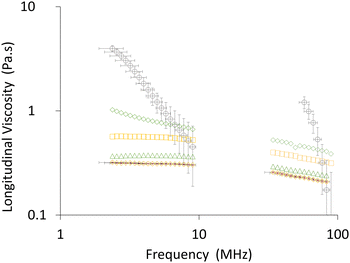
At low ultrasound frequency (2 to 6 MHz), molten AMF samples step-cooled from 65 °C to temperatures above the crystallisation point (43 to 26 °C) behave approximately as a Newtonian fluid (long wavelength fit in Fig. 5), whose viscosity is almost independent of frequency (frequency independence of viscosity is equivalent to shear rate independence). This is indicated by a power law exponent of approximately zero. For a Newtonian fluid (such as water), the attenuation has a frequency exponent of 2 and the viscosity is independent of frequency (eqn (20)). Adopting a Newtonian shear viscosity from literature as described above, the bulk viscosity (Table 1) is larger than the shear viscosity. Below 26 °C, the fitted power law exponent of the longitudinal viscosity departs significantly from zero indicating non-Newtonian behaviour and at 19 °C to 17 °C measurement errors become large as the material rheology becomes increasingly solid-like (G′ ≫ G′′). Additional contributions to attenuation may become important, which are not correctly described through the bulk viscosity, for example effects due to interaction of acoustic waves with crystals and crystal clusters, and the effects of the longer-range material structuring (frame modulus defined above). At high ultrasound frequency (60 to 90 MHz), the viscosity consistently behaves in a non-Newtonian manner, probably because at short wavelengths (20 to 80 μm) and low temperature, shear interactions between the crystal clusters that form at 23 °C become significant. Even in the melt there is significant frequency dependence in this high frequency range, possibly arising from relaxation phenomena. In Fig. 6, (but not in Fig. 4) data in the region 10 MHz to 40 MHz has been omitted because of an instrumental artefact arising from a coincidence between the size of the crystal clusters (Fig. 1) in relation to wavelength (Fig. 4 and 5), the stirring speed alters the time spent by a cluster in the measurement zone. In the overlap region and the averaging time window, the instrument attempts to reconcile data from the high frequency (10 MHz to 120 MHz) and low frequency (2 MHz to 20 MHz) transducers. The effects of this are apparent in Fig. 4–6 at around 10 MHz and a wavelength of 100 μm which is of the same order as the size of the crystal clusters. These effects are absent in a homogeneous sample such as DI water.
Discussion
Table 1 shows that acoustical and rheological data can be used together to determine both low frequency and high frequency rheological measurements in a heterogeneous system such as AMF. It is worth noting that although the real part of the longitudinal modulus is dominated by the bulk modulus (with negligible storage modulus, G′ ≪ K′) under the assumptions applied here, the imaginary part of the longitudinal modulus has a significant contribution from both bulk and shear components (K′′ and G′′ are of the same order at 10 MHz). The longitudinal viscosity responds strongly to the emergence of solid crystalline material, probably because it relates to the acoustical loss mechanisms arising in part from viscous dissipation in the bulk liquid but also due to dissipation mechanisms at the crystals. So, the change in longitudinal viscosity could be used as a surrogate for bulk viscosity, due to a relatively small contribution from shear viscosity. The velocity also changes markedly as crystals form on cooling, reflecting the change in the real (elastic) part of the bulk modulus, or equivalently the compressibility.Our rheological data agrees with that of the other groups to within an order of magnitude, the differences are unsurprising due to the sensitivity of AMF rheology to the conditions under which it is cooled and stirred. Nevertheless, the general trend of increasingly solid-like behaviour is evident in the complex elastic moduli.
Isothermal or adiabatic?
When comparing low frequency with high frequency measurements it is important to identify if the measurement is adiabatic or isothermal since there are significant differences of the order of the ratio of specific heats in the sample. Most non-oscillatory techniques are isothermal. This is because the measured piece is allowed to come into thermal equilibrium at each measurement point. Even if the measurement is carried out in the form of a step taking place quickly, isothermal conditions will prevail. On the other hand, high frequency (>1 kHz) oscillatory techniques deliver adiabatic data and in particular, measurements of the speed of sound are always adiabatic, except at extremely high frequencies (>THz!). These issues are discussed in more detail elsewhere.29,32,43Conclusions
Our rheological and ultrasonic measurements in different frequency regimes have been used to extract the complex elastic and shear moduli of a material undergoing crystallisation by cooling, namely anhydrous milk fat. The results indicate the effect of the solid structure emerging from the liquid melt, imbuing an increasingly solid-like character to the soft-solid material, owing not only to the formation of microcrystals, but also to their longer-range structuring corresponding to a dramatic increase in the real part of the shear modulus observed in oscillatory rheometry at 1 Hz. Whilst the imaginary part of the shear modulus also increases dramatically as the AMF crystallises, it remains much smaller than the real part of the modulus.The ultrasonics, at much higher frequencies, 2 to 100 MHz, demonstrated that the longitudinal attenuation exhibits a change in frequency-dependence as crystallisation develops compared with the liquid melt, owing the solid–liquid interactions of the crystals in the liquid phase and in the presence of the longitudinal acoustic oscillatory wave. This frequency-dependence of attenuation corresponds to a frequency-dependent (or equivalently non-Newtonian) longitudinal viscosity, a combination of both shear and bulk viscosities. In different parts of the spectrum, a different exponent for the frequency-dependence is observed; and these frequency regimes are determined by the crystal size. The ultrasonic measurements are therefore sensitive to the development of crystalline structure and of changes in viscosity. Whilst the real (elastic) moduli are dominated by the bulk modulus with negligible contribution from the real shear modulus, the imaginary parts of the moduli (relating to viscosity) have significant contributions from both bulk and shear viscosities. In addition, the resonant ultrasound measurement of speed was found to be indeterminate when crystal nucleation and growth were taking place, due to the interaction of the oscillatory acoustic energy with the crystallisation process.41
The close relationship between rheology and ultrasonics due to their connection to the complex elastic and shear moduli is important for the extension of the study of soft solid materials to a wider frequency range, and to provide further complementary information from the two techniques. Acoustic techniques significantly expand the application of rheological techniques, they can be implemented in a non-invasive manner into a process, and therefore augment and enhance conventional rheology.
Author contributions
Conceptualization: MJP. Data curation: MJP. Formal Analysis: MJP and DIH. Funding acquisition: MJP. Investigation: MJP & DIH. Methodology: MJP &DIH. Resources: MJP. Writing – original draft: MJP & DIH Writing – review & editing: MJP & DIH.Glossary
Conflicts of interest
There are no conflicts to declare.Acknowledgements
Arla foods funded part of the work on AMF contained in this paper. MJP thanks all her colleagues and students whose work is referenced here and without whom this article could not have been written. The original work and previously unpublished work contained herein have been realised with a great deal of help from my colleagues. Firstly, Professor Valerie Pinfield (Loughborough University) and Dr Rammile Ettelaie (University of Leeds) for invaluable and detailed discussions contributing to the theoretical development of the theory of acoustic wave propagation in soft solids. Secondly, MJP is grateful to Arla Foods and to Dr Ulf Anderson of Arla Foods for their support for a Post Doctoral position which enabled the work on AMF. MJP is also indebted to Dr Theresa Roncal-Herrero and Dr Lorenzo Metilli for their contribution to the rheological and microscopy work on AMF. MJP would like to thank the Isaac Newton Institute for Mathematical Sciences, Cambridge, for support and hospitality during the programme Multiple Wave Scattering where part of the work on this paper was undertaken. This work was supported by EPSRC grant no EP/R014604/1.References
- M. J. W. Povey, in Handbook of Elastic Properties of Solids, Liquids, and Gases, ed. H. B. Moises Levy and R. Stern, Academic Press, 2001, pp. 129–145 DOI:10.1016/b978-012445760-7/50058-7.
- I. Wilson, Soft solids and the science of cake, (https://www.cam.ac.uk/research/features/soft-solids-and-the-science-of-cake).
- B. E. Brooker, N. Krog, E. Dickinson and K. Boode, Food Struct., 1993, 12, 285–296 Search PubMed.
- G. G. Fuller, M. Lisicki, A. J. T. M. Mathijssen, E. J. L. Mossige, R. Pasquino, V. N. Prakash and L. Ramos, Phys. Fluids, 2022, 34 Search PubMed.
- M. J. W. Povey, Curr. Opin. Colloid Interface Sci., 2017, 28, 1–6 CrossRef CAS.
- M. G. Scanlon, A. J. Day and M. J. W. Povey, Int. J. Food Sci. Technol., 1998, 33, 461–464 CrossRef CAS.
- M. Aboonajmi, M. Jahangiri and S. R. Hassan-Beygi, J. Food Process. Preserv., 2015, 39, 3175–3188 CrossRef CAS.
- B. De Ketelaere, M. S. Howarth, L. Crezee, J. Lammertyn, K. Viaene, I. Bulens and J. De Baerdemaeker, Postharvest Biol. Technol., 2006, 41, 275–284 CrossRef.
- M. Povey, Contemp. Phys., 1998, 39, 467–478 CrossRef.
- F. Costa, L. Cappellin, S. Longhi, W. Guerra, P. Magnago, D. Porro, C. Soukoulis, S. Salvi, R. Velasco, F. Biasioli and F. Gasperi, Postharvest Biol. Technol., 2011, 61, 21–28 CrossRef.
- E. E. Ungar and E. M. Kerwin, Jr., J. Acoust. Soc. Am., 2005, 34, 741 CrossRef.
- O. H. Yeoh, Rubber Chem. Technol., 1997, 70, 175–182 CrossRef CAS.
- T. Zhang, Extreme Mech. Lett., 2019, 26, 40–45 CrossRef.
- J. C. Gerdeen, J. C. Gerdeen, H. W. Lord, R. A. L. Rorrer and R. A. L. Rorrer, Engineering Design with Polymers and Composites, CRC Press, 1st edn, 2005 DOI:10.1201/9781420056372.
- G. Attenburrow, D. J. Barnes, A. P. Davies and S. J. Ingman, J. Cereal Sci., 1990, 12, 1–14 CrossRef.
- M. J. W. Povey, Ultrasonic Techniques for Fluids Characterization, Academic Press, San Diego, 1997 Search PubMed.
- P. M. Morse and K. U. Ingard, Theoretical Acoustics, McGraw Hill, Princeton, 1968 Search PubMed.
- J. P. Charlier and F. Crowet, J. Acoust. Soc. Am., 1986, 79, 895–900 CrossRef CAS.
- G. G. Stokes, Trans. Cambridge Philos. Soc., 1845, 8, 287 Search PubMed.
- G. G. Stokes, Philos. Mag., 1848, 33, 349 Search PubMed.
- A. D. Pierce, Acoustics: An Introduction to its Physical Principles and Applications, McGraw Hill, New York, 1994 Search PubMed.
- A. S. Dukhin and P. J. Goetz, J. Chem. Phys., 2009, 130, 124519 CrossRef.
- S. Ghosh, M. Holmes and M. Povey, J. Food Process. Technol., 2017, 08 Search PubMed.
- M. J. W. Povey, Particuology, 2013, 11, 135–147 CrossRef.
- S. Rønholt, A. S. Madsen, J. J. K. Kirkensgaard, K. Mortensen and J. C. Knudsen, Food Struct., 2014, 2, 14–26 CrossRef.
- A. J. Barlow and J. Lamb, Discuss. Faraday Soc., 1967, 43, 223–230 RSC.
- O. F. Manfredi, R. S. Mills, M. M. Schirru and R. S. Dwyer-Joyce, Ultrasonics, 2019, 94, 332–339 CrossRef CAS PubMed.
- A. Dukhin, Colloid J., 2021, 83, 1–19 CrossRef CAS.
- D. Weitz, H. Wyss and R. Larsen, GIT Lab. J. Eur., 2007, 11, 68–70 Search PubMed.
- B. Schroyen, D. Vlassopoulos, P. Van Puyvelde and J. Vermant, Rheol. Acta, 2020, 59, 1–22 CrossRef CAS.
- S. Meyer, S. Berrut, T. I. I. J. Goodenough, V. S. S. Rajendram, V. J. J. Pinfield and M. J. W. J. W. Povey, Meas. Sci. Technol., 2006, 17, 289–297 CrossRef CAS.
- Y. Wang, Boundaries of the crystal memory effect in saturated triacylglycerols, Dalhousie University, 2016 Search PubMed.
- A. Svalova, N. G. Parker, M. J. W. W. Povey and G. D. Abbott, Sci. Rep., 2017, 7, 1–11 CrossRef CAS PubMed.
- S. S. Narine and A. G. Marangoni, Phys. Rev. E: Stat. Phys., Plasmas, Fluids, Relat. Interdiscip. Top., 1999, 60, 6991–7000 CrossRef CAS PubMed.
- N. Kaufmann, V. De Graef, K. Dewettinck and L. Wiking, Food Biophys., 2012, 7, 308–316 CrossRef.
- J. Wang, W. Liu, G. Luo, Z. Li, C. Zhao, H. Zhang, M. Zhu, Q. Xu, X. Wang, C. Zhao, Y. Qu, Z. Yang, T. Yao, Y. Li, Y. Lin, Y. Wu and Y. Li, Energy Environ. Sci., 2018, 11, 3375–3379 RSC.
- S. Rønholt, K. Mortensen and J. C. Knudsen, J. Texture Stud., 2014, 45, 20–29 CrossRef.
- A. Shukla and S. S. Rizvi, J. Food Sci., 1995, 60, 901–905 CrossRef.
- V. De Graef, P. Van Puyvelde, B. Goderis and K. Dewettinck, Eur. J. Lipid Sci. Technol., 2009, 111(3), 290–302 CrossRef CAS.
- T. Tran and D. Rousseau, Food Res. Int., 2016, 81, 157–162 CrossRef CAS.
- V. A. Akulichev and V. A. Bulanov, Int. J. Heat Mass Transfer, 1983, 26, 289–300 CrossRef CAS.
- Y. Pratama, E. Simone and M. Rappolt, Cryst. Growth Des., 2021, 21, 2113–2127 CrossRef CAS.
- D. Bikos, G. Samaras, P. Cann, M. Masen, Y. Hardalupas, C. Hartmann, J. Vieira and M. N. Charalambides, Food Funct., 2021, 12, 4864–4886 RSC.
Footnote |
| † Electronic supplementary information (ESI) available. See DOI: https://doi.org/10.1039/d3sm01097j |
| This journal is © The Royal Society of Chemistry 2023 |



![[B with combining tilde]](https://www.rsc.org/images/entities/i_char_0042_0303.gif)
