
Preparation, characterization and properties of PLA/TiO2 nanocomposites based on a novel vane extruder
Haichen Zhang,
Jintao Huang,
Li Yang,
Rongyuan Chen,
Wei Zou,
Xiangkun Lin and
Jinping Qu*
National Engineering Research Center of Novel Equipment for Polymer Processing, The Key Laboratory of Polymer Processing Engineering of the Ministry of Education, South China University of Technology, Guangzhou 510640, Guangdong, People's Republic of China. E-mail: jpqu@scut.edu.cn; Fax: +86 020 87112503; Tel: +86 020 87112803
First published on 3rd December 2014
Abstract
Polylactide/TiO2 nanocomposites with different contents of nanoscale TiO2 were prepared by melt blending with a vane extruder in this work. SEM and TEM microphotographs indicate that the nanoparticles were well dispersed in the polymer matrix under the elongational flow field of the vane extruder. Crystallization and melting behavior were examined with DSC. The results show that TiO2 nanoparticles have an inhibition for the cold crystallization process of PLA to some extent and the cold crystallization temperature of nanocomposites shifted to a maximum value at about 106 °C with low TiO2 loadings (0.5 wt% or 1 wt%). Dynamic rheological measurements and TGA results show that the introduction of TiO2 has significantly improved the thermal stability. The toughness, surface wettability and UV resistance of the composites were also investigated in detail.
Introduction
Poly(lactic acid) (PLA) is an environmentally benign aliphatic bio-polyester which can be produced from renewable plant resources (mainly starch and sugar).1,2 PLA has excellent comprehensive performance and it possesses reasonably good mechanical and optical properties, biocompatibility, processability and so on. PLA holds tremendous market potential for packaging materials, fibers, agricultural films, and biomaterials.2–4Despite the favorable properties, the poor thermal stability and the inherent brittleness of PLA severely limit its more widespread implementation, such as the engineering plastics and the electronics field. Several techniques including copolymerization and blending with other polymers have been developed to further improve the physical properties of PLA.5–9 Besides, compounding with nanofillers,5,10–14 such as silica, nanotubes, nanoclay, graphene and metal oxides nanoparticles (i.e. TiO2, MgO and Fe3O4), is also an effective way to fabricate high performance composites. Among the metallic oxides, titanium dioxide (TiO2), has been used most widely in paints, cosmetics, food packing materials, biomaterial as well as catalyst/photocatalyst in waste water treatment, since TiO2 is inert, non-toxic, inexpensive, and environmentally-friendly with antimicrobial activity against a wide variety of microorganisms.15–18
Biodegradable PLA nanocomposites with TiO2 nanoparticles have gained much scientific attention due to the special surface characteristics of TiO2. According to the literature, there exists plentiful dangling bonds on the surface of nano-TiO2 which could interact with polymer molecules, thus resulting in improving the properties of nanocomposites.16,17,19 Zhuang et al. have found that the PLA/TiO2 nanocomposites, which prepared by in situ polymerization method, showed markedly improved thermal and mechanical properties with loading 3 wt% of TiO2 nanoparticles.20 Meng et al. reported that PLA can be also toughened by TiO2 nanoparticles coated with polycaprolactone (PCL).21 Luo et al. have fabricated PLA/TiO2 nanocomposites with improved mechanical properties by functionalization TiO2.22,23 Man and co-authors reported that the anti-UV performance of PLA was significantly improved by adding TiO2 nanoparticles into PLA matrix resin.24
Although many studies have demonstrated to improve the physical properties of PLA/TiO2 nanocomposites with considering the influences of multifunctional modification or different loading content of TiO2 nanoparticles, the effects of different flow field during processing on the degree of dispersion and the physical and mechanical behaviors have less investigation.
In the present study, PLA/TiO2 nanocomposites have been prepared using vane extruder which the extruder is a novel polymer processing equipment dominated by elongational flow field. The vane extruder is beneficial for the dispersion of composites and especially suitable for the processing of thermo-sensitive polymer because of its short thermal–mechanical history and thus resulting in the reduction of degradation.25–27 The plasticizing and conveying mechanism and the detailed structural design of vane extruder have been reported in detail in our previous work.28,29 The purpose of this work is to detect the dispersion of nanoparticles in PLA matrix under elongational flow field and to determine the physical properties of its nanocomposites.
Experimental
Materials
A commercial PLA (trade name 4032D, 1.2–1.6% D-isomer lactide) was obtained from NatureWorks LLC, USA. The nanosized titanium dioxide (VK-TAKH570, Jing Rui New Material, China) was an anatase type with an average primary particle size of approximately 20 nm. PLA pellets and TiO2 were dried to remove moisture in a vacuum before processing.Preparation of PLA/TiO2 nanocomposites by vane extruder
A novel polymer processing equipment known as the vane extruder was employed to compound PLA/TiO2 nanocomposites in this research. The structure schematic diagram of the vane extruder is shown in Fig. 1. The vane extruder consists of a number of vane plasticizing and conveying units (VPCU).25,28–30 The stator, vanes, baffles and the rotor of VPCU composes a closed chamber. Due to the stator has an eccentric distance to the rotor, the volume of the closed chamber is changed periodically when the rotor is rotating. A converging channel can be obtained in the circumferential direction, thus generating higher stress and dynamic elongational flow field. The detailed working principle and process of the vane extruder has been described detailedly in our previous works.28,31,32 The temperature profile used for the extruder was 150, 165, 180 and 160 °C from hopper to die, respectively, and the rotation was maintained at 50 rpm. | ||
| Fig. 1 The structure schematic diagram of the vane extruder. | ||
Before extrusion, PLA pellets and TiO2 nanoparticles were dried in vacuum at 80 °C for more than 6 h. The mixture of PLA and TiO2 was premixed in a high-blender at 400 rpm min−1 for 5 min, and subsequently fed into the vane extruder for melt blending. The extrudant was cooled in air and subsequently granulated by a pelletizer.
The samples with 0, 0.5, 1.0, 2.0, 5.0, 10.0 and 15.0 wt% TiO2 were prepared and marked as PLA, PLA-0.5, PLA-1, PLA-2, PLA-5, PLA-10 and PLA-15 nanocomposites. The pure PLA was also subjected to the mixing treatment so as to have the same thermal history as the composites.
Tensile test specimens were fabricated by injection molding. The barrel temperatures for the injection were set at 170, 180, 185 and 190 °C from hopper to the nozzle, respectively. Prior to injection molding, all pellets prepared by vane extruder were dried in vacuum oven at 50 °C for 12 h.
Characterization
| χc (%) = (ΔHc/ΔHo) × (100/φ) | (1) |
![[thin space (1/6-em)]](https://www.rsc.org/images/entities/char_2009.gif) δ) were carried out in the temperature range of 0 to 100 °C at a heating rate of 3 °C min−1. The test specimen dimensions were approximately 4.0 × 10.0 × 50.0 mm (thickness–width–length).
δ) were carried out in the temperature range of 0 to 100 °C at a heating rate of 3 °C min−1. The test specimen dimensions were approximately 4.0 × 10.0 × 50.0 mm (thickness–width–length).Results and discussion
Morphology of TiO2/PLA nanocomposites
It is well known that the dispersion of nanoparticles in the polymer matrix is the key factor influencing the physical properties of the nanocomposites. A homogeneous dispersion of TiO2 nanoparticles, together with strong interfacial interactions between nanoparticles and the matrix, can effectively improve the thermal, rheological, and mechanical properties of the nanocomposites.The fracture surface morphologies of PLA/TiO2 nanocomposites were observed by scanning electron microscopy (SEM) as shown in Fig. 2 and the detail dispersion of the TiO2 nanoparticles in the PLA matrix were determined by transmission electron microscopy (TEM) as shown in Fig. 3. It can be clearly seen that nanoparticles have been uniformly dispersed in the matrix when the TiO2 content is less than or equal to 5 wt%. When the TiO2 content was 10 wt%, some individual TiO2 nanoparticles aggregated into clusters. This may be due to the strong interaction among the TiO2 nanoparticles.17 However, the number of big clusters was not too much and the TiO2 particles were evenly dispersed in the PLA matrix. It indicates that the continuous volume extensional flow generated in the vane extruder had good effects on the dispersion of nanoparticles in polymer matrix.
 | ||
| Fig. 2 SEM micrographs of fracture surfaces (a) 1 wt% TiO2, (b) 2 wt% TiO2, (c) 5 wt% TiO2, (d) 10 wt% TiO2; 5000×. | ||
 | ||
| Fig. 3 TEM images of PLA/TiO2 nanocomposites (a) 2 wt% TiO2, (b) 5 wt% TiO2, (c) 10 wt% TiO2. | ||
The possible dispersing mechanism for nanoparticles under the steady or elongational flow field is shown in Fig. 4. For the steady shear case, the velocity gradient is almost perpendicular to the flow direction. The nanoparticle aggregates were inclined to move in a shear layer and generated the rotation of itself (as shown in Fig. 4a). Thus the nanoparticle aggregates in steady shear flow were difficult to disperse as separated particles. However, according to recent published works, the melt drops of polymer are more efficiently broken under elongational flow than shear flow.26,33–37 Logically, there is reason to believe that these nanoparticle aggregates will be easy to be separated if they withstand a strong stretched force during the polymer processing (as shown in Fig. 4b). In this work, the vane extruder has improved significantly the elongational flow during polymer processing and it is much larger than the shear flow in the vertical direction.28,32 This is conducive to the uniform dispersion of TiO2 nanoparticles in PLA matrix.
 | ||
| Fig. 4 The schematic diagram of dispersing process for the nanoparticles in different flow field (a) steady shear flow; (b) volume elongational flow. | ||
Rheological measurements
The dynamic oscillatory shear measurements were performed on pure PLA and its nanocomposites to investigate the response of nanoparticles to the dynamic shearing. As shown in Fig. 5, the complex viscosities (η*) of the pure PLA and PLA/TiO2 nanocomposites are plotted as a function of frequency (ω) in rad s−1. The η* of the PLA and its nanocomposites melt show only a small frequency dependence, revealing a Newtonian plateau at low frequency. Fig. 5 also indicates the dependence of complex viscosities of nanocomposites on the TiO2 content. Obviously, with low loading content of TiO2 (0.5 wt% and 1 wt%), the nanocomposites melt has a higher complex viscosity and theirs values are twice higher than that of the pure PLA. However, the complex viscosity values are close to the neat matrix when the TiO2 content is greater than 2 wt%. | ||
| Fig. 5 Complex viscosity curves of PLA and PLA/TiO2 nanocomposites with different weight fractions of TiO2 at 170 °C. | ||
As shown in Fig. 6, the storage modulus G′ and loss modulus G′′ for the PLA/TiO2 nanocomposites were increased as compared with the neat PLA. For the nanocomposites, the values of G′ increased with increasing TiO2 content, which was more obvious in the lower frequency region. It is well known that the viscoelasticity of nanocomposites at low frequency (ω) range is sensitive to the structure evolution. It can be found in Fig. 6a that the second plateau appears in the logarithmic plots of the dynamic storage modulus versus frequency, G′ ∼ ω, in low frequency region for nanoparticles filled systems, confirming the occurrence of network structure of filler in nanocomposites. The second plateau starts to appear when the TiO2 content is 0.5 wt% and begins to be more and more obvious with increasing nanoparticle content. The G′′ of the nanocomposites have a similar trend as pure PLA at all frequency range and the values of nanocomposites have a small increase as compared to the neat matrix.
 | ||
| Fig. 6 G′ (a) and G′′ (b) versus frequency for PLA and PLA/TiO2 nanocomposites with different weight fractions of TiO2 at 170 °C. | ||
Effect of TiO2 nanoparticles on the crystallization behavior
It is well known that nanoparticles could have considerable effect on the crystallization process of polymer, acting as nucleating. The thermal behaviors of pure PLA and its nanocomposites with TiO2 were detected by the differential scanning calorimetry (DSC). The DSC cooling scans and the second heating scans of PLA/TiO2 nanocomposites were performed after first melting runs.The crystallization exotherms of the neat PLA and its nanocomposites are shown in Fig. 7a. At a constant cooling and heating rate of 10 °C min−1, crystallization melting peak temperature (Tm) for all investigated samples are around 170 °C as listed in Table 1, showing considerable independence of the TiO2 content. As shown in Table 1, comparing to the neat PLA, the degree of crystallinity (χc) for the nanocomposites has no significant difference when the TiO2 nanoparticle content was increased to 15 wt%. These results might suggest that TiO2 nanoparticles do not play active role in heterogeneous nucleation for the PLA matrix during the cooling process. Similar results could be found in other PLA nanocomposites.19,22
 | ||
| Fig. 7 (a) DSC thermograms of the second heating for PLA and PLA/TiO2 nanocomposites (b) the cold crystallization temperature of nanocomposites with different TiO2 content. | ||
| Samples | Tcc (°C) | Tm (°C) | χc (%) |
|---|---|---|---|
| Pure PLA | 100.5 | 169.1 | 6.51 |
| PLA-0.5 | 106.1 | 169.5 | 6.63 |
| PLA-1 | 106.5 | 169.5 | 5.91 |
| PLA-2 | 104.5 | 170.0 | 5.84 |
| PLA-5 | 100.4 | 169.0 | 5.47 |
| PLA-10 | 98.6 | 168.5 | 4.83 |
| PLA-15 | 99.0 | 169.3 | 4.67 |
As shown in Fig. 7a, each curve of the investigated samples appears a clear exothermic peak because of the cold crystallization process. It is interesting to note that the cold crystallization temperature (Tcc) seems to depend on the nanoparticle content. The relationship is shown in Fig. 7b by plotting Tcc versus TiO2 content. Obviously, with the increase of TiO2 content (up to 15 wt%), the cold crystallization peak of nanocomposites with low TiO2 content (less than or equal to 2 wt%) is first shifted to a higher temperature and then it decreases to the characteristic cold crystallization temperature of PLA when the TiO2 content is more than or equal to 5 wt%. The same examination for the nanocomposite with 0.2 wt% TiO2 has also been performed under the same process and the cold crystallization temperature was about 104 °C. (The heating scan curve and detail results are not shown here.) Evidently, the cold crystallization temperature of nanocomposites reached a maximum value at about 106 °C when the nanoparticle content was 0.5 wt% or 1 wt%. This fact implies a stronger inhibition for cold crystallization process with appropriate nanoparticles content.
Although the exact cause of this phenomenon is not yet clear, but there are several aspects should be taken into account, such as the content and dispersion of nanoparticles, the initial crystallinity, intermolecular interactions between nanoparticles and the matrix, and so on. Obviously, due to the inactive heterogeneous nucleation of TiO2 nanoparticles and the poor crystallization ability of the PLA resin itself, only a few crystalline was formed during the cooling process at a rate of 10 °C min−1 and the nanocomposites have a low crystallinity degree about 5% which is close to the pure PLA sample. Therefore, the effect of the initial crystallinity on this change of Tcc can be ignored in the second heating process. Therefore, the dispersion and the intermolecular interactions should be two important factors. On one hand, TiO2 nanoparticles could be easily dispersed into the macromolecular chains, which disrupted the regularity of the PLA chain structure and hindered the crystallization. On the other hand, according to the published researches, there were a lot of hydroxyl groups (Ti–OH) covering the surface region of TiO2 nanoparticles which could form a strong interfacial bond Ti–O–C with carbonyl groups of PLA.16,17,22,23 The strong interfacial bond would strengthen the molecular chain rigidity and decrease the mobility, thus resulting in a stronger inhibitory effect on the crystallization. Similar results or conclusions could be found in other reported researches.13,14,38
Effect of TiO2 nanoparticles on the thermal stability
PLA is a biodegradable polyester and it is prone to degradation induced by various factors, such as heat, moisture and UV radiation. Fig. 8a shows the thermogravimetric (TG) curves of pure PLA and PLA/TiO2 nanocomposites at a heating rate of 10 °C min−1 in an N2 atmosphere. Fig. 8b shows their respective derivative thermograms (DTG) curves. For the neat PLA resin and its nanocomposites, the decomposition temperature at 5% and 10% weight loss (respectively recorded as T0.05 and T0.10), the maximum decomposition temperature (Tmax) and the char formation at 500 °C are listed in Table 2. In this study, the temperature at 5% weight loss (T0.05) was defined as the onset degradation temperature to evaluate the effect of TiO2 nanoparticles on the thermal stability. It is obvious to note that the onset degradation temperature of nanocomposites shifted to a higher temperature with loading TiO2 nanoparticles. The peaks in the DTG curves represented the temperatures at maximum degradation rates. As shown in Fig. 8b, the fastest degradation rate occurred at a higher temperature for PLA/TiO2 nanocomposites than that for the neat PLA. Consequently, the thermal stability of PLA/TiO2 was improved as compared with that of pure PLA resin. This is possible because that the TiO2 particles acted as heat barrier in the early stages of thermal decomposition.19,38 | ||
| Fig. 8 (a) TGA profile of PLA and PLA/TiO2 nanocomposites (b) derivative thermograms curves of TGA. | ||
| Sample | T0.05 (°C) | T0.10 (°C) | Tmax (°C) | Char formation at 500 °C (wt%) |
|---|---|---|---|---|
| Pure PLA | 338.2 | 347.9 | 372.6 | 1.38 |
| PLA-0.5 | 343.5 | 352.0 | 376.6 | 1.78 |
| PLA-5 | 347.3 | 354.6 | 374.8 | 7.15 |
The influence of TiO2 nanoparticles on the thermal stability for the nanocomposites can also be demonstrated by the dynamic rheological properties. It is well known that the pure PLA resin is prone to thermal oxidative degradation under long-time effect of heat and oxygen. At a constant strain of 3%, dynamic frequency sweep tests were performed from 100 to 0.01 rad s−1 within the linear viscoelastic regime. For the pure PLA and PLA/TiO2 nanocomposites, the running time of testing and the thermodynamic effect were consistent. As shown in Fig. 9, the complex viscosity of pure PLA was deviated from the Newtonian plateau at low frequency when the sweeping was in the range of 0.1 to 0.01 rad s−1. However, the complex viscosity of PLA/TiO2 did not deviated from the Newtonian plateau until finishing the sweeping from 100 to 0.01 rad s−1. This indicates clearly that nano-TiO2 contributed in promoting the thermal stability for the PLA resin.
 | ||
| Fig. 9 The influences of TiO2 nanoparticles on the thermal stability of composites. | ||
Dynamic mechanical properties
Fig. 10 illustrates the temperature dependence of storage modulus (E′) and tanδ of neat PLA and various PLA/TiO2 nanocomposites. All the investigated samples show similar storage modulus behaviors with increasing temperature. It is seen that the storage modulus exhibits a long plateau in the temperature range 15 to 60 °C and then followed by a dramatic drop at about 50 to 60 °C. The variation of the damping factor tanδ as a function of temperature is shown in Fig. 10b. The maximum peak point corresponds to the glass transition temperature (Tg). It is clear to note that the Tg for PLA/TiO2 nanocomposites with 1 wt% and 5 wt% is 64 °C and 63.8 °C, respectively, which are higher than that of neat PLA (62 °C). This phenomenon may be ascribed to the restricted chain mobility which caused by the TiO2 nanoparticles.39
 | ||
| Fig. 10 Temperature dependence of (a) storage modulus (E′) and (b) tanδ for pure PLA and various PLA/TiO2 composites. | ||
Tensile properties
Fig. 11 depicts typical stress–strain curves of pure PLA and nanocomposites with different TiO2 loadings and the main tensile properties are listed in Table 3. Obviously, all investigated samples exhibit a clearly distinguished yield point as shown in Fig. 11. With increasing TiO2 content (up to 2 wt%), the tensile strength of nanocomposites has a slightly shifting to a higher value as compared with pure PLA as listed in Table 3. When the TiO2 content is more than or equal to 2 wt%, the nanocomposites show a lower tensile strength than neat PLA. Although there is no big variation in the tensile modulus and tensile strength for the nanocomposites, but the elongation at break show an obvious variation as increasing the content of nanoparticles. All samples except for 15 wt% TiO2/PLA show a higher elongation at break which the detail is listed in Table 3. In particular, the elongations of nanocomposites with 1 wt% and 2 wt% TiO2 are about 19.1% and 24%, respectively, which are 64.6% and 106.8% higher than the neat PLA. This indicates that an appropriate loadings of TiO2, to some extent, can improve the toughness of the rigid PLA resin.21 A similar results were obtained in the g-TiO2 (surface grafted TiO2)/PLA nanocomposites by Wang group, which the strain at break was increased to 25.3% at 0.5 wt% content of g-TiO2, and reached a maximum at approximately 37.6% at 1 wt% g-TiO2, increasing 5 times larger than that of neat PLA.22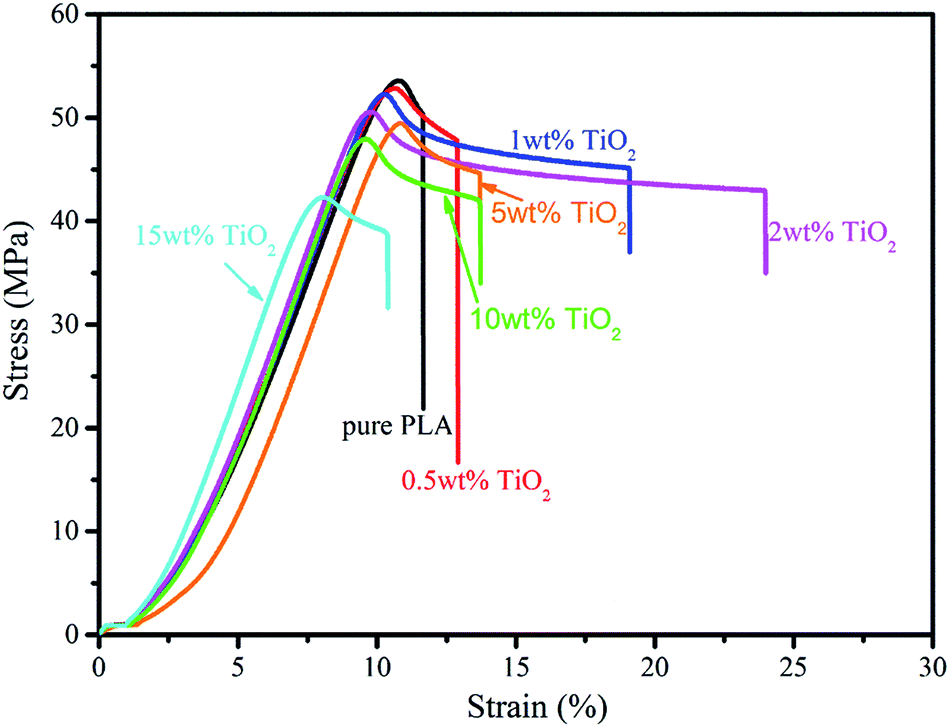 | ||
| Fig. 11 Stress–strain behavior of the pure PLA and PLA/TiO2 nanocomposite with varying TiO2 contents. | ||
| Sample | Tensile strength (MPa) | Tensile modulus (GPa) | Elongation at break (%) |
|---|---|---|---|
| Pure PLA | 59.8 ± 0.8 | 2.3 ± 0.1 | 11.6 ± 0.2 |
| PLA-0.5 | 61.7 ± 1.1 | 2.4 ± 0.3 | 12.9 ± 0.3 |
| PLA-1 | 61.5 ± 1.0 | 2.4 ± 0.1 | 19.1 ± 0.3 |
| PLA-2 | 60.7 ± 1.5 | 2.3 ± 0.5 | 24.0 ± 0.7 |
| PLA-5 | 57.6 ± 0.5 | 2.4 ± 0.3 | 13.7 ± 0.5 |
| PLA-10 | 55.9 ± 0.8 | 2.3 ± 0.2 | 13.7 ± 0.5 |
| PLA-15 | 50.3 ± 0.7 | 2.8 ± 0.4 | 10.4 ± 0.1 |
UV transmittance
Fig. 12 shows the UV transmittance spectra of the neat PLA and the nanocomposites with different TiO2 loads. All films for investigating have the same thickness (0.07 cm). As shown in Fig. 12, the transmittance of pure PLA was approximately 87% and decreased as TiO2 nanoparticles were added to the PLA matrix. With increasing the TiO2 content, the transmittance of ultraviolet has greatly reduction. When the addition of TiO2 was more than or equal to 2 wt%, the ultraviolet in the wavelength region from 250 to 350 nm was not allowed through and the transmittance was zero. Evidently, the TiO2 particles have greatly improved the UV resistance of the nanocomposites. This improvement is probably ascribed to the excellent UV light screening effects of TiO2 which is linked to the quantum size effect of nanoscale particles.16,24,27 This would render a contribution in improving the aging resistance properties of composites. As shown in Fig. 12, the transmittance spectra for all samples in visible range (>400 nm) were also measured to determine the effect of TiO2 on the transparency of nanocomposites. As an example, the transmittance of PLA, PLA-0.5, PLA-1, PLA-2, and PLA-5 in 600 nm which the value is in visible range are 93.1%, 89.5%, 86.7%, 71.6%, and 57.1%. The transmittance in other visible wavelength have the same trends. The results indicate that the transparency of nanocomposites trended to reduce with increasing the content of TiO2 particles. However, the reduction of the transparency of nanocomposites films was not great when the content of TiO2 nanoparticles was less than 2 wt%. | ||
| Fig. 12 UV transmittance spectra of the PLA/TiO2 nanocomposites. | ||
Wettability
The surface wettability of neat PLA and its nanocomposites were determined by water contact angle measurement. The contact angles of 0.5 wt% TiO2/PLA, 2 wt% TiO2/PLA and 5 wt% TiO2/PLA nanocomposites are about 68.2°, 70.5° and 70.3°, respectively, which are slightly higher than that of pure PLA in about 66°. According to the literature, the surface wettability of nanocomposites is related to the physical–chemical properties of nanocomposites and the dispersion of nanoparticles.40 The water drop will not easily penetrate into the pores on the rough surface of the polymer/particles system if the particles were uniformly distributed within the polymer matrix, resulting the increase of the contact angle.41,42 TiO2 nanoparticles were incorporated in PLA matrix and resulted in increasing the surface roughness of nanocomposites, then increased the contact angle slightly.Conclusions
In this study, PLA/TiO2 nanocomposites with different contents of nano-TiO2 were prepared by vane extruder which it is a novel polymer processing equipment dominated by elongational flow field. The dispersion of nanoparticles and physical properties of PLA/TiO2 composites were examined in detail. Results show that TiO2 nanoparticles were well dispersed in the polymer matrix via elongational flow and these nanoparticles have an inhibition for cold crystallization process to some extent. Dynamic rheological measurements and TGA results show that the introduction of TiO2 has improved the thermal stability of composites. The toughness and UV resistance of composites were also enhanced by adding TiO2. This provides a method to develop functional PLA nanocomposites which it can be applied in food packaging and agriculture films applications.Acknowledgements
This work was supported by the National Natural Science Foundation of China-Guangdong Joint Foundation Project (U1201242), 973 Program (2012CB025902), the National Research Foundation for the Doctoral Program of Higher Education of China (20120172130004), Program for the Fundamental Research Funds for the Central Universities (2014ZB0021), New Century Excellent Talents in University (NCET-11-0152) and the Pearl River Talent Fund for Young Sci-Tech Researchers of Guangzhou City (2011J2200058).References
- R. E. Drumright, P. R. Gruber and D. E. Henton, Adv. Mater., 2000, 12, 1841–1846 CrossRef CAS
.
- L.-T. Lim, R. Auras and M. Rubino, Prog. Polym. Sci., 2008, 33, 820–852 CrossRef CAS PubMed
- M. Jamshidian, E. A. Tehrany, M. Imran, M. Jacquot and S. Desobry, Compr. Rev. Food Sci. Food Saf., 2010, 9, 552–571 CrossRef CAS PubMed
- R. Auras, B. Harte and S. Selke, Macromol. Biosci., 2004, 4, 835–864 CrossRef CAS PubMed
- Y. Li, C. Han, J. Bian, L. Han, L. Dong and G. Gao, Polym. Compos., 2012, 33, 1719–1727 CrossRef CAS
- H. Xu, C. Teng and M. Yu, Polymer, 2006, 47, 3922–3928 CrossRef CAS PubMed
- T. Dobreva, J. Perena, E. Pérez, R. Benavente and M. García, Polym. Compos., 2010, 31, 974–984 CrossRef CAS
- T. Wang, P. J. Colver, S. A. F. Bon and J. L. Keddie, Soft Matter, 2009, 5, 3842–3849 RSC
- Y. Bian, C. Han, L. Han, H. Lin, H. Zhang, J. Bian and L. Dong, RSC Adv., 2014, 4, 41722–41733 RSC
- J. T. Yeh, W. L. Chai and C. S. Wu, Polym.-Plast. Technol. Eng., 2008, 47, 887–894 CrossRef CAS
- S. H. Park, S. G. Lee and S. H. Kim, Composites, Part A, 2013, 46, 11–18 CrossRef CAS PubMed
- S. H. Kim, S. H. Ahn and T. Hirai, Polymer, 2003, 44, 5625–5634 CrossRef CAS
- N. Najafi, M. Heuzey and P. Carreau, Polym. Eng. Sci., 2013, 53, 1053–1064 CAS
- D. Wu, Y. Cheng, S. Feng, Z. Yao and M. Zhang, Ind. Eng. Chem. Res., 2013, 52, 6731–6739 CrossRef CAS
- J. Pena, M. Vallet-Regi and J. S. Román, J. Biomed. Mater. Res., 1997, 35, 129–134 CrossRef CAS
- H. Mehranpour, M. Askari, M. S. Ghamsari and H. Farzalibeik, J. Nanomater., 2010, 2010, 31 Search PubMed
- X. Chen, J. Mater. Sci. Lett., 2002, 21, 1637–1639 CrossRef CAS
- D. Yang, M. Tian, Y. Dong, H. Kang, D. Gong and L. Zhang, J. Appl. Phys., 2013, 114, 154104 CrossRef PubMed
- A. Buzarovska and A. Grozdanov, J. Appl. Polym. Sci., 2012, 123, 2187–2193 CrossRef CAS
- W. Zhuang, J. Liu, J. H. Zhang, B. X. Hu and J. Shen, Polym. Compos., 2009, 30, 1074–1080 CrossRef CAS
- B. Meng, J. Tao, J. Deng, Z. Wu and M. Yang, Mater. Lett., 2011, 65, 729–732 CrossRef CAS PubMed
- Y. B. Luo, W. D. Li, X. L. Wang, D. Y. Xu and Y. Z. Wang, Acta Mater., 2009, 57, 3182–3191 CrossRef CAS PubMed
- Y. B. Luo, X. L. Wang, D. Y. Xu and Y. Z. Wang, Appl. Surf. Sci., 2009, 255, 6795–6801 CrossRef CAS PubMed
- C. Man, C. Zhang, Y. Liu, W. Wang, W. Ren, L. Jiang, F. Reisdorffer, T. P. Nguyen and Y. Dan, Polym. Degrad. Stab., 2012, 97, 856–862 CrossRef CAS PubMed
- J. P. Qu, G. Z. Zhang, H. Z. Chen, X. C. Yin and H. Z. He, Polym. Eng. Sci., 2012, 52, 2147–2156 CAS
- J. P. Qu, H. Z. Chen, S. R. Liu, B. Tan, L. M. Liu, X. C. Yin, Q. J. Liu and R. B. Guo, J. Appl. Polym. Sci., 2013, 128, 3576–3585 CrossRef CAS
- J. Huang, X. Lu, N. Zhang, L. Yang, M. Yan, H. Liu, G. Zhang and J. Qu, Polym. Compos., 2014, 35, 53–59 CrossRef CAS
- J. P. Qu, Z. T. Yang, X. C. Yin, H. Z. He and Y. H. Feng, Polym.-Plast. Technol. Eng., 2009, 48, 1269–1274 CrossRef CAS
- J. P. Qu, L. M. Liu, T. Bin, S. R. Liu, H. X. Chen and Y. H. Feng, Polym. Compos., 2012, 33, 185–191 CrossRef CAS
- J. P. Qu and S. Jia, A vane extruder for polymer processing, The Society of Plastics Engineers (SPE), 2013. DOI:10.2417/spepro.004849
- Z. H. Wu, Y. Q. Zhao, G. Z. Zhang, Z. T. Yang and J. P. Qu, J. Appl. Polym. Sci., 2013, 130, 2328–2335 CrossRef CAS
- J. P. Qu, Y. S. Xu, J. J. Chen, G. Z. Zhang and N. Zhang, Polym. Eng. Sci., 2014, 54, 1403–1411 CAS
- H. P. Grace, Chem. Eng. Commun., 1982, 14, 225–277 CrossRef CAS
- J. M. H. Janssen and H. E. H. Meijer, J. Rheol., 1993, 37, 597–608 CrossRef CAS
- C. E. Scott and C. W. Macosko, Polymer, 1995, 36, 461–470 CrossRef CAS
- J. Kang, T. G. Smith and D. I. Bigio, AIChE J., 1996, 42, 649–659 CrossRef CAS
- S. Jia, J. P. Qu, S. Zhai, Z. Huang, C. Wu, R. Chen and Y. Feng, Polym. Compos., 2014, 35, 884–891 CrossRef CAS
- P. Fei, B. Fei, Y. Yu, H. Xiong and J. Tan, J. Appl. Polym. Sci., 2014, 131, 39846 Search PubMed
- X. Wang, H. Yang, L. Song, Y. Hu, W. Xing and H. Lu, Compos. Sci. Technol., 2011, 72, 1–6 CrossRef CAS PubMed
- M. Parvinzadeh, S. Moradian, A. Rashidi and M.-E. Yazdanshenas, Polym.-Plast. Technol. Eng., 2010, 49, 874–884 CrossRef CAS
- X. Xu, X. Chen, A. Liu, Z. Hong and X. Jing, Eur. Polym. J., 2007, 43, 3187–3196 CrossRef CAS PubMed
- N. Lin, J. Huang, P. R. Chang, J. Feng and J. Yu, Carbohydr. Polym., 2011, 83, 1834–1842 CrossRef CAS PubMed
| This journal is © The Royal Society of Chemistry 2015 |