 Open Access Article
Creative Commons Attribution 3.0 Unported Licence
Phase distribution regulation of formamidinium-based quasi-2D perovskites through solution engineering†
Xiao
Zhang
 a,
Lisanne
Einhaus
 b,
Annemarie
Huijser
 b and
Johan E.
ten Elshof
 *a
*a
aInorganic Materials Science Group, MESA+ Research Institute, University of Twente, 7500 AE Enschede, The Netherlands. E-mail: j.e.tenelshof@utwente.nl; x.zhang-6@utwente.nl
bPhotoCatalytic Synthesis Group, MESA+ Research Institute, University of Twente, 7500 AE Enschede, The Netherlands. E-mail: l.m.einhaus@utwente.nl; j.m.huijser@utwente.nl
First published on 22nd August 2024
Abstract
Quasi-2D perovskites have attracted attention as potential solar energy absorber materials due to their balanced efficiency and stability and their unique quantum-well structures. In order to facilitate directional excitons and charge carrier transport and preferential energy transfer landscape in photovoltaic thin films, the phase distribution formed by different types of microstructural domains should be regulated. In this work, the Dion–Jacobson-type spacer 1,4-phenylenedimethanammonium (PDMA) was used, and different strategies were pursued to control the phase distribution in formamidinium-based (FA) quasi-2D perovskites based on the composition of (PDMA)FA4Pb5I16. In general, doping with FACl modulated the crystallization kinetics, forming 2D low-n crystals on the top surface or a reversed-gradient phase distribution, depending on whether excess or substitutional doping was employed. Alternatively, mixing with a Ruddlesden–Popper spacer helped bridging to adjacent octahedra in pure PDMA-based perovskites and improved crystallization, while regulating the quantum-well structures to give a normal-gradient phase distribution, where 2D domains resided on the bottom side. By combining FACl doping and spacer mixing, the film showed both a reversed-gradient phase distribution and larger vertically aligned grains. This work contributes to the knowledge of how to manipulate and regulate the phase distribution in FA-based quasi-2D perovskites and further paves the way for fabricating corresponding devices with high efficiency and stability.
1. Introduction
Metal halide perovskites (MHPs) are currently one of the most popular solar energy absorber materials used to boost photovoltaic performance. Among the different types of MHPs, two-dimensional (2D) perovskites have attracted extensive attention in more recent years, since they comprise hydrophobic organic spacers which provide higher long-term stability against external stimuli under operational conditions, such as moisture, heat, oxygen and ion migration, compared to their 3D analogues.1–11 Although the power conversion efficiency (PCE) of 2D perovskites is still lagging behind that of the 3D perovskites, the record PCE of formamidinium (FA)-based 2D perovskite solar cells (PSCs) has reached over 20%, achieving a balanced efficiency and intrinsic stability.12As depicted in Fig. 1, by introducing large organic spacers along the (100) plane of 3D perovskites,13–15 2D and quasi-2D perovskites with a chemical formula of (L)m(A)n−1(B)n(X)3n+1 are formed, where L represents the large organic spacers, A are small monovalent cations (e.g., methyl ammonium MA+, FA+, and Cs+) fitting in the [BX6]4− octahedral frameworks, B are divalent cations (e.g., Pb2+ and Sn2+), X are halide ions (e.g., I−, Br−, and Cl−), m depends on the spacer type (m = 2 for a monovalent Ruddlesden–Popper spacer and m = 1 for a divalent Dion–Jacobson spacer), and n represents the average number of inorganic layers between two organic spacers (n = 1 for pure 2D perovskites, n ≥ 2 for quasi-2D perovskites, and n = ∞ for 3D perovskites).16–21 Since the value of n can vary locally on a microscale, we employ the term 〈n〉 further on to denote the global average value in this paper.
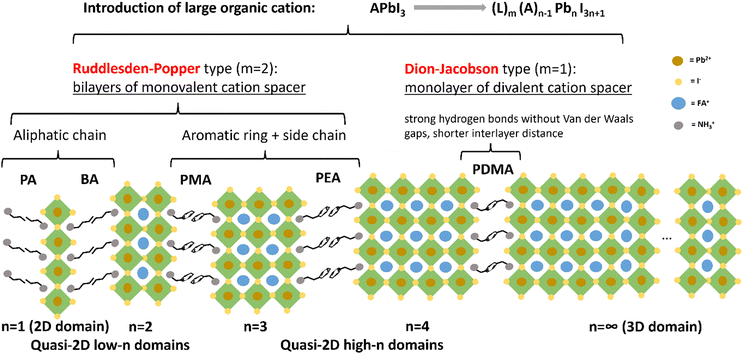 | ||
| Fig. 1 Schematic illustration of the structure and phase distribution of quasi-2D perovskites with Ruddlesden–Popper-type and Dion–Jacobson-type spacers. | ||
In our work, the Dion–Jacobson (DJ) spacer 1,4-phenylenedimethanammonium (PDMA) was primarily used as the L-site spacer. Other Ruddlesden–Popper (RP) spacers, such as propylammonium (PA), n-butylammonium (BA), allylammonium (ALA), phenylmethylammonium (PMA), and phenethylammonium (PEA), were also used for comparison or for mixing with PDMA. FA was used as the A-site cation, since FA-based perovskites have higher thermal stability than the methylammonium (MA) series, owing to the higher sublimation temperature of FA compared with that of MA.22 Moreover, FA-based perovskites have a smaller bandgap than the MA series because of the increasing Pb–I–Pb angles induced by the larger size of FA, thus covering a larger part of the solar spectrum.23–26 Therefore, FA-based perovskites have higher potential to generate solar cells with both high efficiency and high thermal stability. However, due to the large size of FA, the Goldschmidt tolerance factor of the FAPbI3 perovskite structure approaches its maximum value 1, beyond which the cubic phase with corner-shared octahedra is not structurally stable.27,28 In fact, FAPbI3 has multiple polymorphic phases, the photo-inactive hexagonal δ-phase, or the yellow phase, of which is the stable phase at room temperature. The phase transition into the desired cubic α-phase, or the black phase, takes place at higher temperature (150–185 °C).29,30 The use of N-methyl-2-pyrrolidone (NMP) as a co-solvent together with the primary solvent dimethyl formamide (DMF) can yield a stable α-phase FAPbI3. NMP has a weak intermolecular interaction with DMF but strongly coordinates with PbI2 and FAI. The as-formed PbI2-NMP intermediate phase can directly convert into the α-phase after annealing.31
Additive doping is another effective way to form α-phase FAPbI3. Chloride salt derivatives (e.g. MACl, FACl, and PbCl2) can suppress the formation of the δ-phase and support the formation of the α-phase, regulating the crystal growth orientation.32–34 By incorporating N,N-dimethylimidodicarbonimidic diamide hydroiodide (DIAI), the intermediate phase FAI–PbI2–dimethyl sulfoxide (DMSO) complex is eliminated, so that the δ-phase is directly converted into the desired phase α-FAPbI3.35 Bu et al. used both the co-solvent systems DMF/NMP and MACl as additives to grow high-quality α-phase FA-based 3D perovskite solar cells with a PCE of 24.02%.36 However, a comprehensive understanding of what controls the crystallization, and especially the phase distribution in quasi-2D perovskites, is still lacking.
For quasi-2D perovskite thin films fabricated with the solution method with a certain 〈n〉 value, there are typically multiple local microstructural domains of different n values coexisting, where low-n domains (n = 1, 2) and high-n domains (n = 4, 5…) are heterogeneously distributed or concentrated in different areas within the film. The multiple quantum-well structures form a so-called phase distribution, which determines the charge carrier transport pathways and energy transfer landscapes.37–43 Different phase distributions (e.g. normal-gradient with low-n domains at the bottom and high-n domains at the top of the film, or a reversed-gradient with the reversed distribution of low-n and high-n domains) are suitable for different solar cell configurations (e.g. p–i–n where the hole transport layer is at the bottom interface and the electron transport layer is at the top interface, or the n–i–p configuration) due to different energy level alignments. Therefore, knowing how to tune the phase distribution of quasi-2D perovskites is of vital importance.
Our work aims at fabricating stable α-phase FA-based quasi-2D perovskites with controlled phase distribution. Through FACl doping, by both excess and substitutional doping, the phase distribution can be regulated into a reversed-gradient manner, enabling steering of the directionality of excitons and charge transport, and protecting the film from moisture penetration. Spacer engineering was also carried out by mixing the Dion–Jacobson spacer PDMA and two Ruddlesden–Popper spacers, ALA and PA. The phase distribution of n-domains can be further regulated into either a similar reversed-gradient or a normal-gradient manner, facilitating an energy transfer cascade, favouring directional excitons and charge transport and a potential electron tunnelling through the interlayer,44 thus paving the way towards future devices with high efficiency and stability.
2. Results and discussion
2.1. Fabrication of stable α-phase quasi-2D perovskites (PDMA)(FA)4Pb5I16
Following the same fabrication conditions as with the MA series in our previous work45, i.e. using a 10![[thin space (1/6-em)]](https://www.rsc.org/images/entities/char_2009.gif) :
:![[thin space (1/6-em)]](https://www.rsc.org/images/entities/char_2009.gif) 1 volume ratio of DMF
1 volume ratio of DMF![[thin space (1/6-em)]](https://www.rsc.org/images/entities/char_2009.gif) :
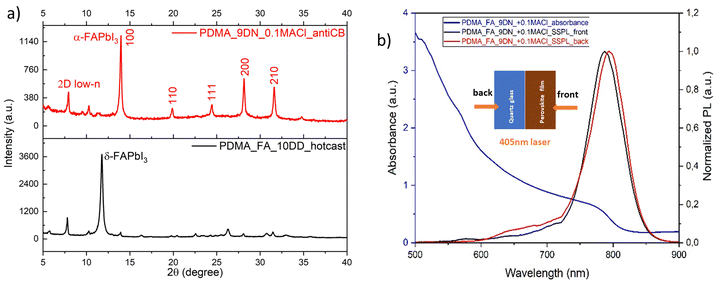
:![[thin space (1/6-em)]](https://www.rsc.org/images/entities/char_2009.gif) DMSO as the solvent mixture, using the hot-casting processing method and post-annealing at 100 °C, the quasi-2D perovskite (PDMA)(FA)4Pb5I16 showed the photo-inactive yellow phase or δ-phase (Fig. 2a), which is the stable phase at room temperature for FAPbI3. The phase transition into a corner-shared cubic phase can only occur by providing more thermal energy. Therefore, we increased the post-annealing temperature to 150 °C. Since the hot-casting method by pre-heating the substrate only changed the reaction kinetics, but not intermediate chemistry, we changed the process to the anti-solvent method, by dripping chlorobenzene (CB) onto the as-spin-coated perovskite precursor solution, to induce a fast supersaturation state and solvent extraction. Then, we conducted an orthogonal experiment to investigate which solvent combination and additive ratios could produce a stable black phase or α-phase. For the solvent mixture, we selected 4
DMSO as the solvent mixture, using the hot-casting processing method and post-annealing at 100 °C, the quasi-2D perovskite (PDMA)(FA)4Pb5I16 showed the photo-inactive yellow phase or δ-phase (Fig. 2a), which is the stable phase at room temperature for FAPbI3. The phase transition into a corner-shared cubic phase can only occur by providing more thermal energy. Therefore, we increased the post-annealing temperature to 150 °C. Since the hot-casting method by pre-heating the substrate only changed the reaction kinetics, but not intermediate chemistry, we changed the process to the anti-solvent method, by dripping chlorobenzene (CB) onto the as-spin-coated perovskite precursor solution, to induce a fast supersaturation state and solvent extraction. Then, we conducted an orthogonal experiment to investigate which solvent combination and additive ratios could produce a stable black phase or α-phase. For the solvent mixture, we selected 4![[thin space (1/6-em)]](https://www.rsc.org/images/entities/char_2009.gif) :
:![[thin space (1/6-em)]](https://www.rsc.org/images/entities/char_2009.gif) 1 (v/v) DMF
1 (v/v) DMF![[thin space (1/6-em)]](https://www.rsc.org/images/entities/char_2009.gif) :
:![[thin space (1/6-em)]](https://www.rsc.org/images/entities/char_2009.gif) DMSO and 9
DMSO and 9![[thin space (1/6-em)]](https://www.rsc.org/images/entities/char_2009.gif) :
:![[thin space (1/6-em)]](https://www.rsc.org/images/entities/char_2009.gif) 1 (v/v) DMF
1 (v/v) DMF![[thin space (1/6-em)]](https://www.rsc.org/images/entities/char_2009.gif) :
:![[thin space (1/6-em)]](https://www.rsc.org/images/entities/char_2009.gif) NMP, while for additive doping, we selected MACl and ammonium thiocyanate (NH4SCN) in different molar ratios with respect to the constant Pb2+ concentration or a mixture of the two (Table S1, ESI†). The results are shown in Fig. 2a and Fig. S1 (ESI†), with 9
NMP, while for additive doping, we selected MACl and ammonium thiocyanate (NH4SCN) in different molar ratios with respect to the constant Pb2+ concentration or a mixture of the two (Table S1, ESI†). The results are shown in Fig. 2a and Fig. S1 (ESI†), with 9![[thin space (1/6-em)]](https://www.rsc.org/images/entities/char_2009.gif) :
:![[thin space (1/6-em)]](https://www.rsc.org/images/entities/char_2009.gif) 1 (v/v) DMF
1 (v/v) DMF![[thin space (1/6-em)]](https://www.rsc.org/images/entities/char_2009.gif) :
:![[thin space (1/6-em)]](https://www.rsc.org/images/entities/char_2009.gif) NMP as the solvent combination and 10 mol% of excess MACl addition indicated a clean α-phase without other phase impurities, prevailing other solvent combinations and additive doping ratios.
NMP as the solvent combination and 10 mol% of excess MACl addition indicated a clean α-phase without other phase impurities, prevailing other solvent combinations and additive doping ratios.
In order to verify the universal feasibility of the new fabrication conditions, other Ruddlesden–Popper spacers (PA, BA, PMA, and PEA) were also employed. As shown in the X-ray diffractograms in Fig. S2a (ESI†), the fabricated quasi-2D perovskite films with 〈n〉 = 5 all showed the α-phase without the δ-phase. The appearance of a small fraction of PbI2 in (PEA)(FA)4Pb5I16 may have been caused by annealing-induced thermal degradation. The bandgaps of the quasi-2D perovskites were in the range of 1.53–1.54 eV (see the Tauc plot in Fig. S2b, ESI†), smaller than those of the MA series (1.60–1.63 eV), which illustrates the advantage over the MA series in absorbing a larger part of the solar spectrum. Therefore, it can be concluded that the synergistic strategies of solvent engineering, additive doping and processing methods successfully fabricated the stable α-phase of FA-based quasi-2D perovskites with multiple L-site spacers.
Fig. 2b shows the UV-vis absorption and steady-state photoluminescence (PL) spectra. The latter were recorded using both front and back excitation with a 405 nm laser source. Considering that the local 2D low-n domains (between 530 and 730 nm) existed at both the top and the bottom sides of the film, it implies that the phase distribution in quasi-2D perovskites (PDMA)(FA)4Pb5I16 was not fully regulated. Different model systems were built to describe the phase distribution in the quasi-2D perovskites. From a molecular-scale (local) perspective, 2D domains with different n values are interspersed in the 3D domain matrix with a concentration variation in different areas of the film. This may also explain why the PL bands of the 3D domains were observed by both front side and back side excitation. In contrast, in a continuum model, the 3D domains reside mainly on one side, and the 2D low-n domains lie mostly on the other side, thus forming a phase gradient in the film thickness direction. Both model systems with regulated phase distributions can induce a sequential energy transfer cascade and boost the photo-induced charge carrier separation and extraction.46 But irregular phase distributions, as in the case of the (PDMA)(FA)4Pb5I16 film in Fig. 2b, implies that microstructural domains with different quantum-well structures are randomly distributed in the film, which may lead to blocked and impeded charge transport paths and accelerated charge carrier recombination. Therefore, the phase distribution of FA-based quasi-2D perovskites needs further regulation through manipulating the precursor solution and processing methods.
2.2. Manipulation strategies for phase distribution regulation
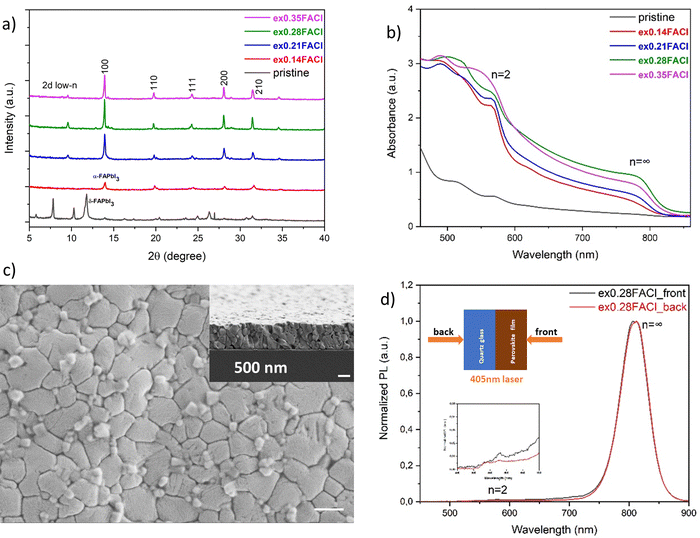
In principle, doping can be performed in two ways. The first one is to add excess FACl to the precursor solution of the stoichiometric composition of (PDMA)(FA)4Pb5I16. With increasing excess FACl, and the film showed a stable α-phase and increased crystallinity (Fig. 3a). The degree of light absorption was also enhanced, especially for the film with 28 mol% of excess FACl, which had a sharp absorption onset edge representing the 3D domain, and an excitonic band around 580 nm representing the 2D n = 2 domain (Fig. 3b). From the steady-state PL data in Fig. 3d, the 3D domain was detected by both front and back excitation, but there was also a weak n = 2 PL band from the perovskite side, consistent with the UV-vis absorption spectra. This likely implies that the 2D n = 2 domain grew preferentially on the top surface of the film, while the bulk was the 3D domain, hence forming a regulated phase distribution. This result was confirmed by the surface morphology shown in Fig. 3c, where compared to the pristine quasi-2D film (Fig. S3a, ESI†), the grains were larger (average grain size: 500 nm) with some crystals on the surface, especially at grain boundaries. A possible reason may be that with the increasing FACl additive, the crystallization kinetics are retarded, and the large spacer cations at the bottom of the solution have more time to diffuse towards the top surface upon post-annealing. The crystals of 2D n = 2 local domains eventually accumulate at the grain boundaries of the 3D domain, passivating defects and suppressing the non-radiative recombination centers. The proposed mechanism of film growth and regulated phase distribution is schematically illustrated at the end of this section.
![[double bond, length as m-dash]](https://www.rsc.org/images/entities/char_e001.gif) C double bonds, both of which can form (conjugated) π-bonds, potentially facilitating electron tunnelling through the interlayer,44 mitigating the quantum and dielectric confinement, and having a high potential to increase the charge conductivity.55–59
C double bonds, both of which can form (conjugated) π-bonds, potentially facilitating electron tunnelling through the interlayer,44 mitigating the quantum and dielectric confinement, and having a high potential to increase the charge conductivity.55–59
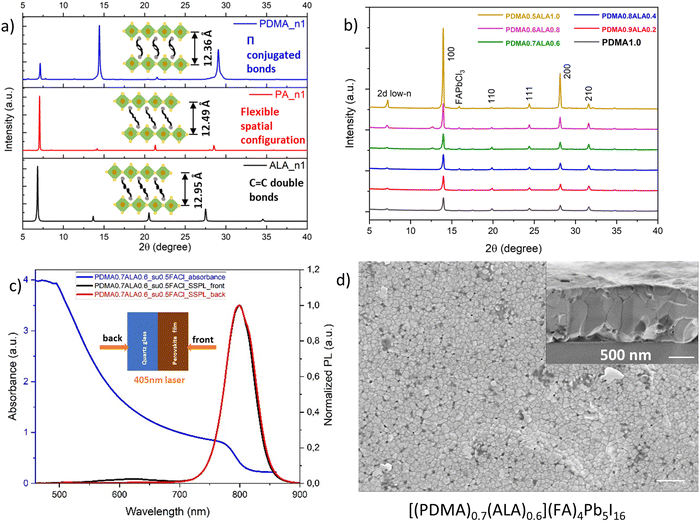
Adopting the substitutional FACl doping strategy and substituting 50 mol% of FAI for FACl, a perovskite-phase with the nominal chemical formula [(PDMA)1−x((ALA)2)x](FA)4Pb5I16 was formed. With an increasing ratio of ALA with respect to PDMA, the quasi-2D perovskites with 〈n〉 = 5 all showed the stable α-phase and increasing crystallinity (Fig. 5b). No XRD peak splitting was observed, possibly because ALA is a rigid molecule with C![[double bond, length as m-dash]](https://www.rsc.org/images/entities/char_e001.gif) C double bonds as compared to other Ruddlesden–Popper spacers with C–C single bonds such as PA, which have more degrees of freedom for spatial rearrangement and molecular relaxation. For example, the film [(PDMA)0.7(ALA)0.6](FA)4Pb5I16 (x = 0.3) had a strong light absorption with a sharp absorption onset edge (Fig. 5c). The steady-state PL spectra in Fig. 5c showed a similar reversed-gradient phase distribution as the film (PDMA)(FA)4Pb5I16 with substitutional FACl doping, i.e. the 2D low-n domains reside on the top side, and the 3D domains reside at the bottom side of the film. Thus, ALA spacer mixing did not change the phase distribution. It was the additive doping method and the different crystallization mechanism that determined the changed evolution of the phase distribution. It is worth noting that the dominant PL band from the back excitation had a small shoulder, implying that it may comprise two separate emission bands very close to each other. A possible reason might be that although the 3D domain normally does not contain spacers, the octahedra in quasi-2D perovskites are locally tilted induced by the two spacers, generating two distinct PL bands. Another possible reason lies on the trap state involved reabsorption and reemission. Furthermore, ALA spacer mixing did change the surface morphology. In contrast to the pristine film (PDMA)(FA)4Pb5I16, which had a rough surface (Fig. S3a, ESI†), and the film (ALA)2(FA)4Pb5I16 with crystallites (Fig. S3c, ESI†), the surface morphology of the film [(PDMA)0.7(ALA)0.6](FA)4Pb5I16 with spacer mixing contained grains resembling the film (PDMA)(FA)4Pb5I16 with the substitutional FACl additive (Fig. 4c). But the vertically aligned grains had grown even larger, spanning the whole film thickness (Fig. 5d), which may facilitate out-of-plane charge carrier transport. The most likely reason is that the ALA spacer can fix the missing bridging to adjacent octahedra left by the bulky PDMA spacers. The better aligned interlayer connections led to an improved vertically aligned crystal growth over larger distances.45
C double bonds as compared to other Ruddlesden–Popper spacers with C–C single bonds such as PA, which have more degrees of freedom for spatial rearrangement and molecular relaxation. For example, the film [(PDMA)0.7(ALA)0.6](FA)4Pb5I16 (x = 0.3) had a strong light absorption with a sharp absorption onset edge (Fig. 5c). The steady-state PL spectra in Fig. 5c showed a similar reversed-gradient phase distribution as the film (PDMA)(FA)4Pb5I16 with substitutional FACl doping, i.e. the 2D low-n domains reside on the top side, and the 3D domains reside at the bottom side of the film. Thus, ALA spacer mixing did not change the phase distribution. It was the additive doping method and the different crystallization mechanism that determined the changed evolution of the phase distribution. It is worth noting that the dominant PL band from the back excitation had a small shoulder, implying that it may comprise two separate emission bands very close to each other. A possible reason might be that although the 3D domain normally does not contain spacers, the octahedra in quasi-2D perovskites are locally tilted induced by the two spacers, generating two distinct PL bands. Another possible reason lies on the trap state involved reabsorption and reemission. Furthermore, ALA spacer mixing did change the surface morphology. In contrast to the pristine film (PDMA)(FA)4Pb5I16, which had a rough surface (Fig. S3a, ESI†), and the film (ALA)2(FA)4Pb5I16 with crystallites (Fig. S3c, ESI†), the surface morphology of the film [(PDMA)0.7(ALA)0.6](FA)4Pb5I16 with spacer mixing contained grains resembling the film (PDMA)(FA)4Pb5I16 with the substitutional FACl additive (Fig. 4c). But the vertically aligned grains had grown even larger, spanning the whole film thickness (Fig. 5d), which may facilitate out-of-plane charge carrier transport. The most likely reason is that the ALA spacer can fix the missing bridging to adjacent octahedra left by the bulky PDMA spacers. The better aligned interlayer connections led to an improved vertically aligned crystal growth over larger distances.45
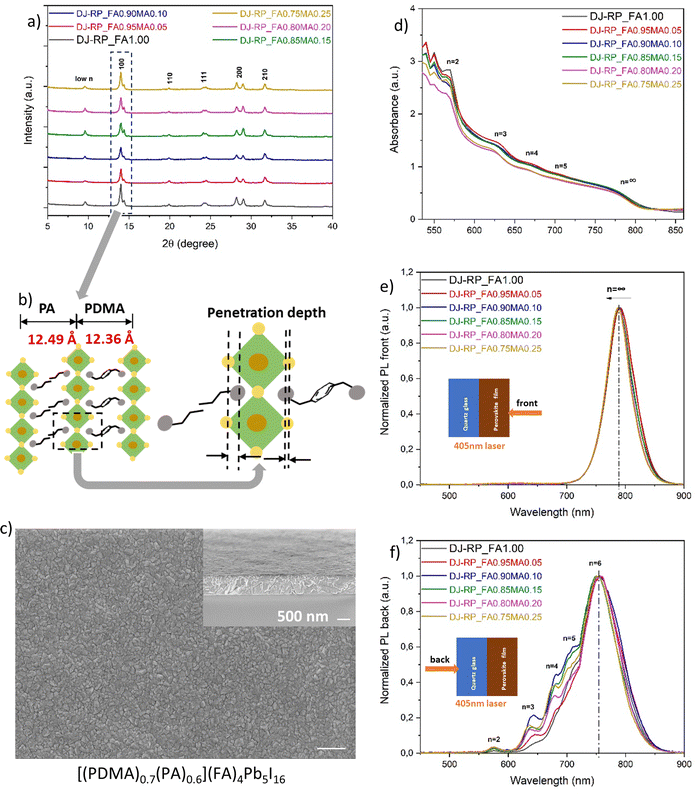
L-site spacers and A-site cations were mixed according to the chemical formula [(PDMA)0.7(PA)0.6][(FA)1−x(MA)x]4Pb5I16 (x = 0, 0.05, 0.1, 0.15, 0.2, 0.25). Since we want FA to dominate the properties for its smaller bandgap and higher thermal stability, the A-site cation mixing ratio was kept below 25 mol% of MA. Different mixing ratios all showed a stable α-phase, but the XRD data in Fig. 6a also showed a peak split. We assume that, although the two spacers have very similar interlayer distances, the penetration depth of the ammonium heads is slightly different, which probably induces octahedral tilting and splitting of the peak (Fig. 6b). The d-spacings from the split peak (6.32 Å and 6.16 Å) match the nuance of the interlayer distances of the two spacers (12.49 Å and 12.36 Å, respectively).
Fig. 6d shows the UV-vis absorption spectra. In addition to the absorption onset, multiple excitonic bands were present, representing multiple microstructural domains of different n values in the quasi-2D perovskites. In the steady-state PL spectra from the front excitation, only one dominating emission band in an average of 789 nm was observed, corresponding to the presence of 3D domains (Fig. 6e). The band was slightly blue-shifted from 792 nm to 788 nm upon MA substitution. For the back excitation, the steady-state PL spectra in Fig. 6f shows multiple emission bands of 2D low-n domains as expected and consistent with the UV-vis absorption spectra. The results imply that the phase distribution was regulated to a normal-gradient type, compared to the pristine film (PDMA)(FA)4Pb5I16 and its random phase distribution in Fig. 2b. A novel discovery was that the maximum emission at the bottom side of the film occurred around 754 nm. We assume that this belongs to an even higher n-valued domain, probably n = 6. Layered perovskites with n ≥ 6–7 domains have been proposed to be thermodynamically unfavourable or unstable,60 but the n = 6 domains may have formed because the spacer mixing of PDMA and PA favoured the thermodynamics and lowered the formation energy of higher n-valued domains. With 3D domains on the top side and 2D low-n domains at the bottom side, this normal-gradient phase distribution with regulated quantum-well structures can facilitate a preferential energy transfer cascade. Taking the film [(PDMA)0.7(PA)0.6](FA)4Pb5I16 as an example, the surface morphology in Fig. 6c showed fine grains and a relatively smooth surface compared to either the (PDMA)(FA)4Pb5I16 or the (PA)2(FA)4Pb5I16 film without spacer mixing (Fig. S3a and b, ESI†), implying that a lower number of defects and improved interfacial contact with another charge transport layer on top were generated by this spacer mixing method.
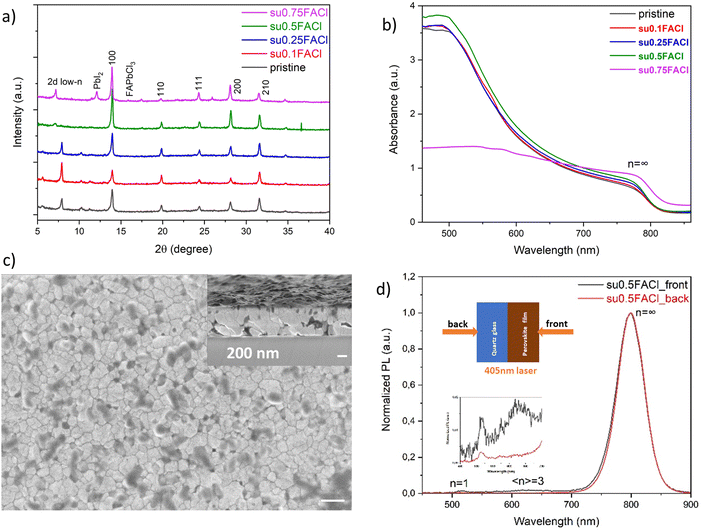
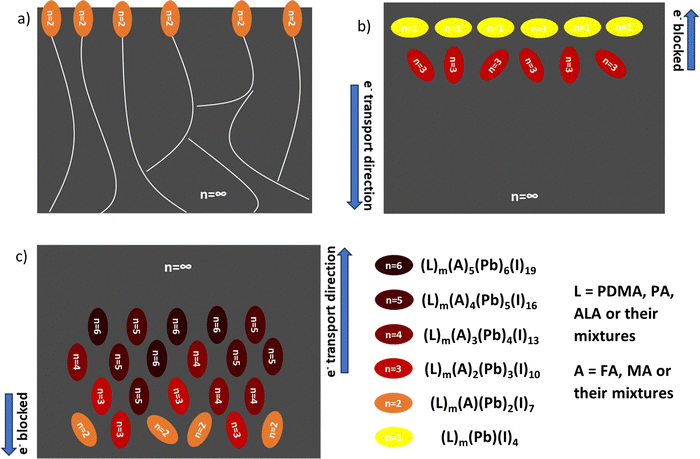
Film growth and phase distribution regulation via the different manipulation strategies are shown in Fig. 7. With excessive FACl additive doping, the n = 2 domain is eventually formed on the top surface of the film, especially at the grain boundaries (Fig. 7a). With substitutional FACl doping, the 2D low-n domains (n = 1, 3) are formed mainly at the top of the film and embedded in the 3D domain matrix, yielding a revered-gradient (Fig. 7b), whether using only a PDMA spacer or using mixed spacers PDMA and ALA. Finally, when using the mixed spacers PDMA and PA, the 2D domains (n = 2–6) are formed mainly at the bottom of the film, yielding a normal gradient (Fig. 7c). All crystallization engineering strategies can regulate the phase distribution of quasi-2D perovskites compared to the pristine film.
3. Conclusions
Different manipulation strategies were implemented to regulate the phase distribution of Dion–Jacobson-type quasi-2D perovskites based on the composition of (PDMA)FA4Pb5I16. In general, FACl additive doping changed the crystallization kinetics, leading to 2D low-n crystals on the top surface or a reversed-gradient phase distribution, following either an excess doping or a substitutional doping method. Alternatively, mixing with another Ruddlesden–Popper spacer fixed the missing bridging to the adjacent octahedra, regulating the quantum-well structures into a normal gradient phase distribution. Combining both FACl doping and spacer mixing, the film showed properties from both manipulation strategies, i.e. a reversed gradient phase distribution and larger vertically aligned grains.4. Experimental section
4.1. Materials
Lead (II) iodide (PbI2, 99.999%), methylammonium iodide (MAI,![[greater than or equal, slant]](https://www.rsc.org/images/entities/char_2a7e.gif) 99%), formamidinium iodide (FAI,
99%), formamidinium iodide (FAI, ![[greater than or equal, slant]](https://www.rsc.org/images/entities/char_2a7e.gif) 99%), N,N-dimethylformamide (DMF, 99.8%), dimethyl sulfoxide (DMSO,
99%), N,N-dimethylformamide (DMF, 99.8%), dimethyl sulfoxide (DMSO, ![[greater than or equal, slant]](https://www.rsc.org/images/entities/char_2a7e.gif) 99.9%), p-xylylenediamine (PDMA, 99%), allylamine (ALA, 98%), hydroiodic acid 57% (HI, for synthesis), and diethyl ether (
99.9%), p-xylylenediamine (PDMA, 99%), allylamine (ALA, 98%), hydroiodic acid 57% (HI, for synthesis), and diethyl ether (![[greater than or equal, slant]](https://www.rsc.org/images/entities/char_2a7e.gif) 99.9%) were purchased from Sigma-Aldrich. Propylamine (PA,
99.9%) were purchased from Sigma-Aldrich. Propylamine (PA, ![[greater than or equal, slant]](https://www.rsc.org/images/entities/char_2a7e.gif) 99.0%) was purchased from Fluka. The above-mentioned chemicals were used as received without further purification. Methylammonium chloride (MACl, for synthesis) was purchased from Sigma-Aldrich, and was further dried in a vacuum oven before use.
99.0%) was purchased from Fluka. The above-mentioned chemicals were used as received without further purification. Methylammonium chloride (MACl, for synthesis) was purchased from Sigma-Aldrich, and was further dried in a vacuum oven before use.
4.2. Synthesis of the PDMAI2 powder
First 3.485 g of PDMA was dissolved in ethanol with stirring. Then, 7.37 ml of HI was added and heated at 100 °C in an oil bath, until all precipitates were solidified and all liquids were evaporated. The yellowish clay-like precipitates were purified with diethyl ether, followed by transferring them into a Petri-dish. Finally, the precipitates were dried in a 60 °C vacuum oven for 3 days.4.3. Synthesis of the PAI powder
First, 13.20 ml of HI was added into 8.29 ml of PA, and then heated at 100 °C in an oil bath with continuous stirring, until all precipitates were solidified and all liquids were evaporated. The precipitates were purified with a large amount of diethyl ether until they turned white. This step was followed by transferring them into a Petri-dish. Finally, the precipitates were dried in a 60 °C vacuum oven for 3 days.4.4. Synthesis of the ALAI powder
First, 12.30 ml of cold HI was added dropwise into 7.50 ml of ALA dissolved in 20 ml of IPA in an ice bath and gradually brought back to room temperature. Then, the mixture was heated at 70 °C until the precipitates were solidified and all liquids were evaporated. The precipitates were purified with a large amount of diethyl ether until they turned beige. The precipitates were dried on a 60 °C hotplate for 30 min.4.5. Preparation of precursor solutions
For the 〈n〉 = 5 Dion–Jacobson precursor solution, PDMAI2, FAI and PbI2 powders were dissolved in a stoichiometric molar ratio of 1![[thin space (1/6-em)]](https://www.rsc.org/images/entities/char_2009.gif) :
:![[thin space (1/6-em)]](https://www.rsc.org/images/entities/char_2009.gif) 4
4![[thin space (1/6-em)]](https://www.rsc.org/images/entities/char_2009.gif) :
:![[thin space (1/6-em)]](https://www.rsc.org/images/entities/char_2009.gif) 5 with a Pb2+ concentration of 1M in the mixed solvent DMF
5 with a Pb2+ concentration of 1M in the mixed solvent DMF![[thin space (1/6-em)]](https://www.rsc.org/images/entities/char_2009.gif) :
:![[thin space (1/6-em)]](https://www.rsc.org/images/entities/char_2009.gif) NMP = 9
NMP = 9![[thin space (1/6-em)]](https://www.rsc.org/images/entities/char_2009.gif) :
:![[thin space (1/6-em)]](https://www.rsc.org/images/entities/char_2009.gif) 1. Doping with excess FACl was done by increasing the molar FACl:PbI2 ratio to a higher value than 4
1. Doping with excess FACl was done by increasing the molar FACl:PbI2 ratio to a higher value than 4![[thin space (1/6-em)]](https://www.rsc.org/images/entities/char_2009.gif) :
:![[thin space (1/6-em)]](https://www.rsc.org/images/entities/char_2009.gif) 5 while keeping Pb2+ in the precursor solution constant. For compensated FACl additive doping, FAI was substituted by FACl in the ratio of FAI
5 while keeping Pb2+ in the precursor solution constant. For compensated FACl additive doping, FAI was substituted by FACl in the ratio of FAI![[thin space (1/6-em)]](https://www.rsc.org/images/entities/char_2009.gif) :
:![[thin space (1/6-em)]](https://www.rsc.org/images/entities/char_2009.gif) FACl = (1 − x)
FACl = (1 − x)![[thin space (1/6-em)]](https://www.rsc.org/images/entities/char_2009.gif) :
:![[thin space (1/6-em)]](https://www.rsc.org/images/entities/char_2009.gif) x. For 〈n〉 =5, mixed Dion–Jacobson and Ruddlesden–Popper spacers and mixed A-site cation precursor solution, PDMAI2, PAI or ALAI, FAI, MAI and PbI2 powders were dissolved in the stoichiometric molar ratio (1 − x)
x. For 〈n〉 =5, mixed Dion–Jacobson and Ruddlesden–Popper spacers and mixed A-site cation precursor solution, PDMAI2, PAI or ALAI, FAI, MAI and PbI2 powders were dissolved in the stoichiometric molar ratio (1 − x)![[thin space (1/6-em)]](https://www.rsc.org/images/entities/char_2009.gif) :
:![[thin space (1/6-em)]](https://www.rsc.org/images/entities/char_2009.gif) 2x
2x![[thin space (1/6-em)]](https://www.rsc.org/images/entities/i_char_2009.gif) :
:![[thin space (1/6-em)]](https://www.rsc.org/images/entities/char_2009.gif) 4(1 − y)
4(1 − y)![[thin space (1/6-em)]](https://www.rsc.org/images/entities/char_2009.gif) :
:![[thin space (1/6-em)]](https://www.rsc.org/images/entities/char_2009.gif) 4y
4y![[thin space (1/6-em)]](https://www.rsc.org/images/entities/i_char_2009.gif) :
:![[thin space (1/6-em)]](https://www.rsc.org/images/entities/char_2009.gif) 5.
5.
4.6. Fabrication of quasi-2D perovskite thin films
First, the ultra-flat quartz-coated glass substrate was sequentially cleaned with a detergent, DI water, acetone and IPA in an ultrasonic bath. Then, the substrate was treated by O2 plasma. After this, the substrate was transferred to the N2 glovebox and attached to the chuck of the spin-coater, and 60 μL of precursor solution was dynamically spin-coated on the substrate with a stepwise spinning program of 1500 rpm for 15 s and 4000 rpm for 20 s. During the second step, 180 μL of chlorobenzene was dropped quickly onto the substrate. The final film was formed by post-annealing at 150 °C on a hotplate for 10 min.4.7. Characterization
Powder X-ray diffraction (XRD) was performed using a Panalytical X’pert Pro Powder diffractometer with Cu Kα1 radiation. The UV-vis absorption spectra were recorded using a UV/VIS/NIR PerkinElmer Lambda 950 Spectrometer in a transmittance (T) mode, after which the absorbance (A) was calculated from A = 2 – log![[thin space (1/6-em)]](https://www.rsc.org/images/entities/char_2009.gif) T. Steady-state photoluminescence was performed using a Blue-Wave Spectrometer from StellarNet Inc with a 405 nm laser from MatchBox series and a FGL435S color filter from Thorlabs. Scanning electron microscopy (SEM) (point resolution) was performed with a Zeiss Merlin HR-SEM equipped with energy dispersive X-ray spectroscopy (EDX) (spatial resolution).
T. Steady-state photoluminescence was performed using a Blue-Wave Spectrometer from StellarNet Inc with a 405 nm laser from MatchBox series and a FGL435S color filter from Thorlabs. Scanning electron microscopy (SEM) (point resolution) was performed with a Zeiss Merlin HR-SEM equipped with energy dispersive X-ray spectroscopy (EDX) (spatial resolution).
Author contributions
The manuscript was written through contributions of all authors. All authors gave approval to the final version of the manuscript.Data availability
The data supporting this article have been included as part of the ESI.†Conflicts of interest
The authors declare no conflicts of interest.Acknowledgements
Financial support of the Open Technology Programme project 17711 by the Dutch Research Council (NWO) Domain Applied and Engineering Sciences is gratefully acknowledged.References
- I. C. Smith, E. T. Hoke, D. Solis-Ibarra, M. D. McGehee and H. I. Karunadasa, Angew. Chem., Int. Ed., 2014, 53, 11232–11235 Search PubMed.
- Y. Yang, F. Gao, S. Gao and S.-H. Wei, J. Mater. Chem. A, 2018, 6, 14949–14955 RSC.
- Z. Huang, A. H. Proppe, H. Tan, M. I. Saidaminov, F. Tan, A. Mei, C.-S. Tan, M. Wei, Y. Hou, H. Han, S. O. Kelley and E. H. Sargent, ACS Energy Lett., 2019, 4, 1521–1527 CrossRef CAS.
- C. Liang, D. Zhao, Y. Li, X. Li, S. Peng, G. Shao and G. Xing, Energy Environ. Mater., 2018, 1, 221–231 CrossRef CAS.
- Y. Liu, H. Zhou, Y. Ni, J. Guo, R. Lu, C. Li and X. Guo, Joule, 2023, 7, 1016–1032 CrossRef CAS.
- D. Thrithamarassery Gangadharan and D. Ma, Energy Environ. Sci., 2019, 12, 2860–2889 RSC.
- I. Spanopoulos, I. Hadar, W. Ke, Q. Tu, M. Chen, H. Tsai, Y. He, G. Shekhawat, V. P. Dravid, M. R. Wasielewski, A. D. Mohite, C. C. Stoumpos and M. G. Kanatzidis, J. Am. Chem. Soc., 2019, 141, 5518–5534 CrossRef CAS PubMed.
- B. R. Wygant, A. Z. Ye, A. Dolocan, Q. Vu, D. M. Abbot and C. B. Mullins, J. Am. Chem. Soc., 2019, 141, 18170–18181 CrossRef CAS PubMed.
- T. L. Leung, I. Ahmad, A. A. Syed, A. M. C. Ng, J. Popović and A. B. Djurišić, Commun. Mater., 2022, 3, 63 CrossRef.
- H. Zheng, G. Liu, L. Zhu, J. Ye, X. Zhang, A. Alsaedi, T. Hayat, X. Pan and S. Dai, Adv. Energy Mater., 2018, 8, 1800051 CrossRef.
- S. Yang, Y. Wang, P. Liu, Y.-B. Cheng, H. J. Zhao and H. G. Yang, Nat. Energy, 2016, 1, 1–7 Search PubMed.
- M. Shao, T. Bie, L. Yang, Y. Gao, X. Jin, F. He, N. Zheng, Y. Yu and X. Zhang, Adv. Mater., 2022, 34, e2107211 CrossRef.
- V. M. Goldschmidt, Naturwissenschaften, 1926, 14, 477–485 CrossRef CAS.
- F. Zhang, H. Lu, J. Tong, J. J. Berry, M. C. Beard and K. Zhu, Energy Environ. Sci., 2020, 13, 1154–1186 RSC.
- C. Ortiz-Cervantes, P. Carmona-Monroy and D. Solis-Ibarra, ChemSusChem, 2019, 12, 1560–1575 CrossRef CAS.
- C. C. Stoumpos, D. H. Cao, D. J. Clark, J. Young, J. M. Rondinelli, J. I. Jang, J. T. Hupp and M. G. Kanatzidis, Chem. Mater., 2016, 28, 2852–2867 CrossRef CAS.
- C. C. Stoumpos, C. M. M. Soe, H. Tsai, W. Nie, J.-C. Blancon, D. H. Cao, F. Liu, B. Traoré, C. Katan, J. Even, A. D. Mohite and M. G. Kanatzidis, Chem, 2017, 2, 427–440 CAS.
- L. Mao, W. Ke, L. Pedesseau, Y. Wu, C. Katan, J. Even, M. R. Wasielewski, C. C. Stoumpos and M. G. Kanatzidis, J. Am. Chem. Soc., 2018, 140, 3775–3783 CrossRef CAS PubMed.
- X. Li, W. Ke, B. Traore, P. Guo, I. Hadar, M. Kepenekian, J. Even, C. Katan, C. C. Stoumpos, R. D. Schaller and M. G. Kanatzidis, J. Am. Chem. Soc., 2019, 141, 12880–12890 CrossRef CAS PubMed.
- G. Wu, R. Liang, Z. Zhang, M. Ge, G. Xing and G. Sun, Small, 2021, 17, e2103514 CrossRef PubMed.
- W. Paritmongkol, N. S. Dahod, A. Stollmann, N. Mao, C. Settens, S.-L. Zheng and W. A. Tisdale, Chem. Mater., 2019, 31, 5592–5607 CrossRef CAS.
- C. Fu, Z. Gu, Y. Tang, Q. Xiao, S. Zhang, Y. Zhang and Y. Song, Angew. Chem., Int. Ed., 2022, 61, e202117067 Search PubMed.
- Z. Xing, X. Meng, D. Li, Y. Zhang, B. Fan, Z. Huang, F. Wang, X. Hu, T. Hu and Y. Chen, Angew. Chem., Int. Ed., 2023, 62, e202303177 Search PubMed.
- L. Pedesseau, D. Sapori, B. Traore, R. Robles, H. H. Fang, M. A. Loi, H. Tsai, W. Nie, J. C. Blancon, A. Neukirch, S. Tretiak, A. D. Mohite, C. Katan, J. Even and M. Kepenekian, ACS Nano, 2016, 10, 9776–9786 CrossRef CAS PubMed.
- C. C. Stoumpos and M. G. Kanatzidis, Adv. Mater., 2016, 28, 5778–5793 CrossRef CAS PubMed.
- Y. Wei, B. Chen, F. Zhang, Y. Tian, X. Yang, B. Cai and J. Zhao, Solar RRL, 2021, 5, 2000661 CrossRef CAS.
- S. Masi, A. F. Gualdrón-Reyes and I. Mora-Seró, ACS Energy Lett., 2020, 5, 1974–1985 CrossRef CAS.
- Y. Huang, X. Lei, T. He, Y. Jiang and M. Yuan, Adv. Energy Mater., 2022, 12, 2100690 CrossRef CAS.
- K. Li and H. Zhou, Chin. J. Chem., 2023, 41, 2730–2745 CrossRef CAS.
- Y. Zhang, S. G. Kim, D. K. Lee and N. G. Park, ChemSusChem, 2018, 11, 1813–1823 CrossRef CAS.
- G. Li, Z. Wang, Y. Wang, Z. Yang, P. Dong, Y. Feng, Y. Jiang, S. P. Feng, G. Zhou, J. M. Liu and J. Gao, Small, 2023, 19, e2301323 CrossRef PubMed.
- L. Cheng, Z. Liu, S. Li, Y. Zhai, X. Wang, Z. Qiao, Q. Xu, K. Meng, Z. Zhu and G. Chen, Angew. Chem., Int. Ed., 2021, 60, 856–864 Search PubMed.
- G. Wu, T. Liu, M. Hu, Z. Zhang, S. Li, L. Xiao, J. Guo, Y. Wang, A. Zhu, W. Li, H. Zhou, Y. Zhang, R. Chen and G. Xing, Adv. Mater., 2023, 35, e2303061 CrossRef PubMed.
- T. Bu, J. Li, H. Li, C. Tian, J. Su, G. Tong, L. K. Ono, C. Wang, Z. Lin and N. Chai, Science, 2021, 372, 1327–1332 CrossRef CAS.
- X. Du, J. Zhang, H. Su, X. Guo, Y. Hu, D. Liu, N. Yuan, J. Ding, L. Gao and S. F. Liu, Adv. Mater., 2022, 34, e2204098 CrossRef.
- T. Bu, L. K. Ono, J. Li, J. Su, G. Tong, W. Zhang, Y. Liu, J. Zhang, J. Chang, S. Kazaoui, F. Huang, Y.-B. Cheng and Y. Qi, Nat. Energy, 2022, 7, 528–536 CrossRef CAS.
- J. Yan, W. Qiu, G. Wu, P. Heremans and H. Chen, J. Mater. Chem. A, 2018, 6, 11063–11077 RSC.
- N. Liu, P. Liu, H. Ren, H. Xie, N. Zhou, Y. Gao, Y. Li, H. Zhou, Y. Bai and Q. Chen, ACS Appl. Mater. Interfaces, 2020, 12, 3127–3133 CrossRef CAS.
- L. Min, W. Tian, F. Cao, J. Guo and L. Li, Adv. Mater., 2021, 33, e2101714 CrossRef PubMed.
- Z. Xu, D. Lu, F. Liu, H. Lai, X. Wan, X. Zhang, Y. Liu and Y. Chen, ACS Nano, 2020, 14, 4871–4881 CrossRef CAS PubMed.
- G. Wu, X. Li, J. Zhou, J. Zhang, X. Zhang, X. Leng, P. Wang, M. Chen, D. Zhang, K. Zhao, S. F. Liu, H. Zhou and Y. Zhang, Adv. Mater., 2019, 31, e1903889 CrossRef PubMed.
- S. Peng, J. Ma, P. Li, S. Zang, Y. Zhang and Y. Song, Adv. Funct. Mater., 2022, 32, 2205289 CrossRef CAS.
- Y. Yang, C. Liu, H. Kanda, Y. Ding, H. Huang, H. Chen, B. Ding, Y. Liang, X. Liu and M. Cai, Adv. Funct. Mater., 2021, 31, 2104868 CrossRef CAS.
- W. Li, X. Feng, K. Guo, W. Pan, M. Li, L. Liu, J. Song, Y. He and H. Wei, Adv. Mater., 2023, 35, e2211808 CrossRef PubMed.
- X. Zhang, L. Einhaus, A. Huijser and J. E. Ten Elshof, Inorg. Chem., 2024, 63, 5246–5259 CrossRef CAS PubMed.
- D. Yu, F. Cao, C. Su and G. Xing, Acc. Chem. Res., 2023, 56, 959–970 CrossRef CAS PubMed.
- G. Ren, Z. Zhang, Y. Deng, Z. Li, C. Liu, M. Wang and W. Guo, Energy Environ. Sci., 2023, 16, 565–573 RSC.
- Y. Ma, C. Zeng, P. Zeng, Y. Hu, F. Li, Z. Zheng, M. Qin, X. Lu and M. Liu, Adv. Sci., 2023, 10, e2205072 CrossRef PubMed.
- R. Azmi, E. Ugur, A. Seitkhan, F. Aljamaan, A. S. Subbiah, J. Liu, G. T. Harrison, M. I. Nugraha, M. K. Eswaran and M. Babics, Science, 2022, 376, 73–77 CrossRef CAS PubMed.
- Yukta, N. Parikh, R. D. Chavan, P. Yadav, M. K. Nazeeruddin and S. Satapathi, ACS Appl. Mater. Interfaces, 2022, 14, 29744–29753 CrossRef CAS PubMed.
- X. Jiang, J. Zhang, S. Ahmad, D. Tu, X. Liu, G. Jia, X. Guo and C. Li, Nano Energy, 2020, 75, 104892 CrossRef CAS.
- Y. Yu, R. Liu, M. Xu and H. Yu, EcoMat, 2023, 5, e12272 CrossRef CAS.
- G. Wu, R. Liang, M. Ge, G. Sun, Y. Zhang and G. Xing, Adv. Mater., 2022, 34, e2105635 CrossRef PubMed.
- M. Degani, Q. An, M. Albaladejo-Siguan, Y. J. Hofstetter, C. Cho, F. Paulus, G. Grancini and Y. Vaynzof, Sci. Adv., 2021, 7, eabj7930 CrossRef CAS PubMed.
- Y. Liu, J. Guo, H. Zhou, C. Li and X. Guo, J. Am. Chem. Soc., 2024, 146, 8198–8205 CrossRef CAS PubMed.
- S. Yu, Y. Yan, M. Abdellah, T. Pullerits, K. Zheng and Z. Liang, Small, 2019, 15, e1905081 CrossRef PubMed.
- A. H. Proppe, M. Wei, B. Chen, R. Quintero-Bermudez, S. O. Kelley and E. H. Sargent, J. Am. Chem. Soc., 2019, 141, 14180–14189 CrossRef CAS PubMed.
- S. Yu, M. Abdellah, T. Pullerits, K. Zheng and Z. Liang, Adv. Funct. Mater., 2021, 31, 2104342 CrossRef CAS.
- N. Zhou, B. Huang, M. Sun, Y. Zhang, L. Li, Y. Lun, X. Wang, J. Hong, Q. Chen and H. Zhou, Adv. Energy Mater., 2020, 10, 1901566 CrossRef CAS.
- C. M. M. Soe, G. P. Nagabhushana, R. Shivaramaiah, H. Tsai, W. Nie, J. C. Blancon, F. Melkonyan, D. H. Cao, B. Traore, L. Pedesseau, M. Kepenekian, C. Katan, J. Even, T. J. Marks, A. Navrotsky, A. D. Mohite, C. C. Stoumpos and M. G. Kanatzidis, Proc. Natl. Acad. Sci. U. S. A., 2019, 116, 58–66 CrossRef.
Footnote |
| † Electronic supplementary information (ESI) available. See DOI: https://doi.org/10.1039/d4tc02231a |
| This journal is © The Royal Society of Chemistry 2024 |

