
 Open Access Article
 This Open Access Article is licensed under a
 Creative Commons Attribution 3.0 Unported Licence
Carbon corrosion in low-temperature CO2 electrolysis systems†
Jack R.
Ferrell‡
III
 *,
Mathew
Rasmussen‡
and
W. Wilson
McNeary
*,
Mathew
Rasmussen‡
and
W. Wilson
McNeary
National Renewable Energy Laboratory, 15013 Denver W Pkwy, Golden, CO 80401, USA. E-mail: jack.ferrell@nrel.gov
First published on 31st May 2024
Abstract
Carbon corrosion has been widely documented in electrochemical systems such as fuel cells and water electrolyzers. In these systems, CO2 is neither a reactant or a product, and CO2 produced from carbon corrosion can be directly measured and attributed to the carbon corrosion process. In CO2 electrolysis, the CO2 feed masks the detection of CO2 produced from anodic carbon corrosion, making the quantification of carbon corrosion difficult. Additionally, current CO2 electrolysis systems operate in a different chemical environment than fuel cells and water electrolysis systems, often employing a carbonate-based anolyte. Understanding and quantifying failure modes is critical for the commercialization of CO2 electrolysis, where a durability of multiple years is required. However, at present, many published studies employ carbon-based materials on the anode. These carbon-based anodes may corrode and deteriorate under the oxidative potentials present on the anode under normal CO2 electrolysis operation. Carbon corrosion at the anode may also be convoluted with other common degradation mechanisms, making quantification of specific degradation pathways more challenging. Here, we have developed an ex situ carbon corrosion test for CO2 electrolysis that allows for the quantification of mass loss from carbon corrosion. Using this test, significant carbon corrosion has been quantified at realistic anodic voltages experienced in operating CO2 electrolysis cells. Based on these results, and informed from the past experiences in the development of fuel cell and water electrolysis systems, we provide a perspective on the use of carbon-based materials on the anode of CO2 electrolysis systems. The CO2 utilization community would benefit from rapidly transitioning away from the use of carbon-based materials on the anode of CO2 electrolysis systems. If carbon materials are used on the anode in CO2 electrolysis systems, it is only appropriate for short-term (<100 h) experiments.
1. Introduction
In recent years, it has become obvious that dramatic changes to our fossil fuel-based economy are needed to limit global warming to less than 2 °C.1 Decarbonization of electricity generation alongside deep electrification of our current economy is the leading strategy to accomplish this goal and avoid the worst effects of climate change. However, many sectors of our economy, such as aviation, chemicals manufacturing, and marine shipping will require hydrocarbon-based feedstocks for the foreseeable future.2 A prevailing strategy to move away from fossil-based feedstocks is the use of waste CO2 as a carbon source. By using CO2 that already exists within the anthropogenic carbon cycle, fuels and chemicals can be synthesized with a dramatically lower carbon footprint when CO2 conversion is powered by renewable energy.3 Additionally, CO2 is available in all regions of the world, at a scale that can meet global demand for fuels and chemicals. This is advantageous to other sustainable carbon sources such as biomass, which can vary regionally and does not exist at a sufficient scale to replace all carbon-based products used today.4Of the many CO2 utilization pathways available, low-temperature CO2 electrolysis has many advantages,5 including the direct use of renewable electricity to drive the energy-intensive conversion of CO2, potential for higher energy efficiency as compared to thermochemical and biochemical conversions, scalability and modularity (including the potential for smaller-scale distributed deployment as compared to the large-scale centralized facilities employed in fuel and chemical production today), and the benefit of shorter startup/shutdown times allowing for coupling with the intermittency of renewable electricity sources. Despite significant recent interest in low-temperature CO2 electrolysis, this technology remains at a relatively low technology readiness level (TRL) of ∼3–5, and advances are needed in performance (e.g., increasing current density, single-pass conversion, product selectivity, and lowering cell voltage), durability, scaling up to larger electrolyzer designs, and scaling out to larger electrolyzer stack sizes.6–8
Several electrolyzer designs have been studied over the years for electrochemical CO2 reduction. Many initial, fundamental studies utilized liquid phase batch type reactors (e.g., H-cells), but due to a variety of issues, including significant mass transport limitations, it is widely understood that H-cells are not practical for industrial-scale deployment.9 Continuous flow electrolyzers are needed to achieve relevant current densities for commercial adoption.6,9,10
Most continuous flow CO2 electrolyzer designs can be broadly classified into three categories: membrane electrode assemblies (MEAs), microfluidic reactors, and solid oxide electrolysis cells (SOECs).9 SOECs utilize an ion-conducting solid oxide material, typically yttria-stabilized zirconia, and operate at high temperatures (>600 °C) with gas-phase CO2 diffusing and reacting directly on the cathode to form gas-phase products.11,12 Microfluidic reactors and MEAs share many common characteristics, including the use of gas diffusion electrodes (GDEs). In essence, GDEs are porous electrodes that allow for diffusion of gas phase CO2 to reaction sites. GDEs are usually designed with two main components: a nanoparticle catalyst layer, and a highly porous gas diffusion layer (GDL) support, which is often composed of carbon paper and a carbon-based microporous layer (MPL).13,14 The most common microfluidic reactor architecture relies on two GDEs separated by a flowing electrolyte solution, with gas-phase CO2 being fed continuously to the cathode GDE.15 MEAs, on the other hand, typically utilize two GDEs separated by an ion-exchange membrane, which may consist of a proton exchange membrane (PEM) or an alkaline exchange membrane (AEM). In one of the most common MEA configurations, CO2 is delivered to the cathode GDE (often as a humidified gas) where it diffuses to the catalyst layer and is reduced to the desired product, while pure water or an anolyte solution is fed to the anode GDE as a source of electrons through the oxygen evolution reaction (OER).16,17 Shown in Fig. 1 is a common architecture for MEA based electrolyzers.
 | ||
| Fig. 1 Cross section of a common MEA used in CO2 electrolysis. Here, an AEM membrane transports anions from cathode to anode, an Ag cathode catalyst produces CO, and the IrO2 anode catalyst evolves oxygen from the OER reaction and CO2 is produced from carbonate crossover through the membrane. | ||
Proving the long-term durability these low-temperature CO2 electrolysis MEAs remains a critical challenge for commercialization of this technology. The vast majority of published studies on CO2 MEAs do not report durability data; those that do typically report a durability of <100 hours.18 However, techno-economic analyses that estimate the minimum selling price of products from CO2 electrolysis typically assume an MEA lifetime of >4 years.6,19 This large discrepancy in MEA lifetime must be met by targeted research efforts focused on understanding and mitigating failure modes.20 Numerous failure modes exist, including membrane failure, MEA delamination, salt precipitation, catalyst degradation, poor water management, binder degradation, and carbon corrosion.21
Carbon corrosion, in particular, has been identified as a persistent problem for all types of low-temperature electrochemical devices, including fuel cells and electrolyzers. In proton exchange membrane fuel cells (PEMFCs), carbon corrosion occurs rapidly during voltage excursions caused by fuel starvation, poor flow distribution, gas blockages, sudden current changes, and startup/shutdown processes.22,23 The PEMFC community has studied the effects of these voltage excursions through a variety of different carbon corrosion accelerated stress tests (ASTs), including voltage holds24 as well as voltage cycling.25 Overall, the PEMFC community has documented multiple degradation pathways resulting from carbon corrosion, including reduced catalyst layer thickness and porosity, catalyst agglomeration, reduction in electrochemical surface area (ECSA),26 water flooding, reduced capillary pressure, increased electrical resistance,27 and loss of mechanical strength.28 Anion exchange membrane fuel cells (AEMFCs) have shown performance and durability improvements in recent years, but still suffer from many of the same adverse effects of carbon corrosion observed in PEMFCs.29 Water electrolyzers, on the other hand, experience higher anodic voltages for longer periods of time than fuel cells, due to the high onset potential (1.23 V vs. SHE in acidic media) for the anode reaction – the oxygen evolution reaction (OER). As a result, strict material requirements have been put in place for these electrolysis systems. Alkaline water electrolysis (AWE) systems have employed nickel and stainless-steel materials for the past 100 years.30 Similarly, PEM water electrolyzers rely on materials that are highly resistant to corrosion, such as platinum group metal catalysts, titanium bipolar plates,31 and various types of non-carbon porous transport layers (PTLs).32
CO2 electrolyzers rely on the same electrochemical reaction on the anode (i.e., OER) as water electrolyzers, so similar anodic material requirements are expected. However, at present, many published studies in CO2 electrolysis employ carbon-based gas diffusion media on the anode.33–43 In contrast to the research literature, most industrial CO2 electrolysis startups (Det Norske Veritas,10,44 Mantra Energy,10,45,46 Dioxide Materials,43,47,48 Siemens/Evonik,49–53 Liquid Light/Avantium,54–58 and Twelve/Opus 12![[thin space (1/6-em)]](https://www.rsc.org/images/entities/char_2009.gif) 59–63) have already switched to alternative materials on the anode, such as stainless steel or TiO2. This dichotomy represents a gap between fundamental research and practical application that should be addressed with focused research efforts. Thorough characterization of carbon corrosion under conditions relevant to CO2 electrolysis is needed to understand the impact of carbon corrosion on electrolyzer lifetime and to identify compatible anode materials.
59–63) have already switched to alternative materials on the anode, such as stainless steel or TiO2. This dichotomy represents a gap between fundamental research and practical application that should be addressed with focused research efforts. Thorough characterization of carbon corrosion under conditions relevant to CO2 electrolysis is needed to understand the impact of carbon corrosion on electrolyzer lifetime and to identify compatible anode materials.
Several challenges exist for quantifying and mitigating carbon corrosion in CO2 electrolyzers. For one, long-term durability testing is time-consuming and resource-intensive, and as a result, may be infeasible for many research institutions. ASTs and accelerated durability tests (ADTs) are needed to rapidly screen the stability of materials and components under relevant conditions. Some ADT and AST protocols have already been developed for other low-temperature electrochemical devices such as proton exchange membrane fuel cells (PEMFCs)64 and water electrolyzers,65 and these learnings can be leveraged to quickly develop ADT/AST tests relevant to CO2 electrolysis.18 Another challenge with measuring carbon corrosion in CO2 electrolyzers is related to the presence of alkaline media. Many CO2 electrolysis systems employ an alkaline exchange membrane (AEM) to improve faradaic efficiency, but carbon exhibits low thermodynamic stability in alkaline conditions. Pourbaix diagrams show that carbon is thermodynamically stable only between −0.23 and 0.00 V (vs. SHE) at pH = 7,66 and the kinetics for carbon corrosion accelerate in alkaline environments due to OH-anions being efficient nucleophiles. Quantification of CO2 as a marker for carbon corrosion in basic solutions is challenging, because alkaline electrolytes tend to convert gaseous CO2 into solvated (bi)carbonate anions, which cannot be detected by gas chromatography (GC).67 Additionally, quantification of CO2 in operating AEM MEAs is particularly difficult due to the presence of CO2 at both the cathode (as a feed gas) and at the anode (from CO2 crossover), thereby masking the CO2 that is produced from the carbon corrosion process. As a result of these factors, relatively few studies have been published on the mechanism and rate of carbon corrosion in alkaline environments, such as for AEM-based CO2 electrolyzers.67
In this work, we report on the development of a simple, accelerated ex situ test to study anodic carbon corrosion for CO2 electrolysis. This ex situ test can easily be operated as an AST or a long-term durability test by adjusting the oxidative voltage at the working electrode. Additionally, this test avoids the challenges with quantifying carbon corrosion in an operating MEA by removing the CO2-fed cathode from the system, thereby minimizing convolution of the CO2 corrosion product. Finally, by employing multiple quantification techniques (mass loss, CO2 evolved, and total current passed), we are better able to measure and verify the rate of carbon corrosion during each experiment.26
2. Experimental
2.1. Carbon corrosion testing
Ex situ carbon corrosion experiments were conducted using a three-electrode setup in a Gamry Eurocell. Corrosion samples were cut from a carbon paper-based gas diffusion layer (AvCarb GDS 5130, Sigracet 39BB, or Toray Paper 120 with MPL) an IrO2-coated carbon paper-based gas diffusion electrode (Dioxide Materials, CO2 Anode), or a non-carbon porous transport layer (Titanium Fiber Felt 0.2–0.3 mm, Fuel Cell Store) depending on the experiment. Samples were cut consistently using a rigid, 3-D printed stencil to a size of 5 cm × 1.9 cm (9.5 cm2 total area) with a 2 cm × 0.9 cm tab on the end for clipping to the potentiostat (BioLogic SP-300). The threaded sample rod (Gamry Eurocell Kit) was modified with a toothless alligator clip for clamping onto the corrosion sample. A saturated Ag/AgCl electrode (36% w/w, Gamry) was used as the reference and was introduced to the cell solution through a bridge tube. The counter electrode for each experiment was a Pt wire with Pt mesh. The electrochemical cell was filled with an electrolyte solution containing either potassium bicarbonate (KHCO3) or potassium phosphate (KH2PO4/K2HPO4) solution, depending on the experiment. The concentration and pH of the potassium phosphate electrolyte was matched to the concentration and pH of the potassium bicarbonate electrolyte, typically 5 mM and pH ≈ 8. N2 was continuously bubbled through the airtight cell with a fritted bubbler at 15 sccm, pushing gas-phase products to the downstream micro gas chromatograph (Agilent 490 μGC). Each experiment was conducted in potentiostatic-mode, holding the corrosion sample at a given oxidative potential for a period of time long enough to detect changes in the sample mass. All potentials are reported versus the Ag/AgCl reference electrode.2.2. Electrode mass loss calculations
Mass loss through carbon corrosion was quantified through several methods. The actual net mass loss was determined by weighing the corrosion sample before and after each experiment on a mass balance. Samples were rinsed thoroughly with DI water and dried in an oven at 110 °C for 30 minutes before each weight measurement.Estimates for the expected mass loss during each experiment were calculated based on measurements at the potentiostat and gas chromatograph (GC). Gas phase products were carried to the GC by a continuous flow of 15 sccm N2 through the cell. The only gas-phase carbon corrosion product detected was CO2 (i.e., no CO was detected by the GC). This is consistent with the unfavourable thermodynamics for carbon oxidation to CO compared to CO2.68,69 The total mass loss was calculated by summing the CO2 detected during each GC injection according to the following equation:
Mass loss via carbon corrosion was also calculated based on the current measured at the potentiostat throughout the experiment according to the following equation:
 485.3 C mol−1), Δt represents the time between potentiostat measurements, and FE is the faradaic efficiency (FE) for carbon corrosion to CO2. For carbon-based GDL samples, the faradaic efficiency for carbon corrosion to CO2 was assumed to be unity. No gas-phase corrosion products other than CO2 were detected during any experiment, and no oxygen was detected, indicating that the OER reaction was negligible for GDLs without a catalyst. For experiments involving carbon-based GDLs with an IrO2 catalyst, the FE value was calculated based on the molar ratio of CO2:O2 detected by the GC near the end of the experiment, due to the substantial rate of OER.
2.3. Corrosion sample characterization
Physicochemical changes in the electrode from carbon corrosion were visually analysed through scanning electron microscopy (SEM) using an FEI Quanta 400 FEG instrument under high vacuum operating with the Everhart Thorney Detector. Samples were prepared for imaging by mounting on aluminum stubs using carbon tape with conductive silver paint applied to the sides to reduce sample charging. Imaging was performed at beam accelerating voltages from 20 to 30 kV. An EDAX element energy dispersive spectroscopy (EDS) system was utilized to create spectral maps of the front and back of electrode samples. All EDS spectral maps shown in this paper (including the ESI†) were corrected in PowerPoint with +40% saturation and −40% contrast to make the coloring more apparent. The Elements software was utilized to determine approximate weight percentages of each element detected in each spectral map. These weight percentages were utilized to calculate ratios of certain species (such as a C:F ratio) for comparison between different samples.
Changes in the elemental composition of electrodes and electrolytes were determined through inductively coupled plasma optical emission spectroscopy (ICP-OES) using an Agilent 5110 ICP-OES. Solid samples were digested in 4 mL of aqua regia solution (3:1 – HCl:HNO3). Elements quantified included iridium, potassium, phosphorus, and copper.
3. Results
The rate of carbon corrosion was tested over a variety of oxidative voltages (1.0–2.0 V vs. Ag/AgCl) for a commercial, carbon-based GDL from AvCarb. The AvCarb GDL is comprised of a carbon fiber layer (CFL) backbone, a polytetrafluoroethylene (PTFE) treatment, and a MPL on one side.Shown in Fig. 2 is a semi-log plot of the current density (as measured by the potentiostat) and CO2 evolved (as measured by the GC) over the course of a series of corrosion tests in phosphate electrolyte. These two measurements represent different strategies for quantifying the rate of carbon corrosion. Lower voltage tests were held for longer periods of time to obtain measurable mass losses: 24 h at 2.0 V vs. Ag/AgCl (Fig. 2A), 72 h at 1.6 V vs. Ag/AgCl (Fig. 2B), 128 h at 1.2 V vs. Ag/AgCl (Fig. 2C), and roughly 1300 h at 1.0 V vs. Ag/AgCl (Fig. 2D). At the two lower corrosion potentials, 1.2 V and 1.0 V vs. Ag/AgCl, the rate of CO2 production was below the detection limits of the GC, so no CO2 flowrate is displayed for those tests.
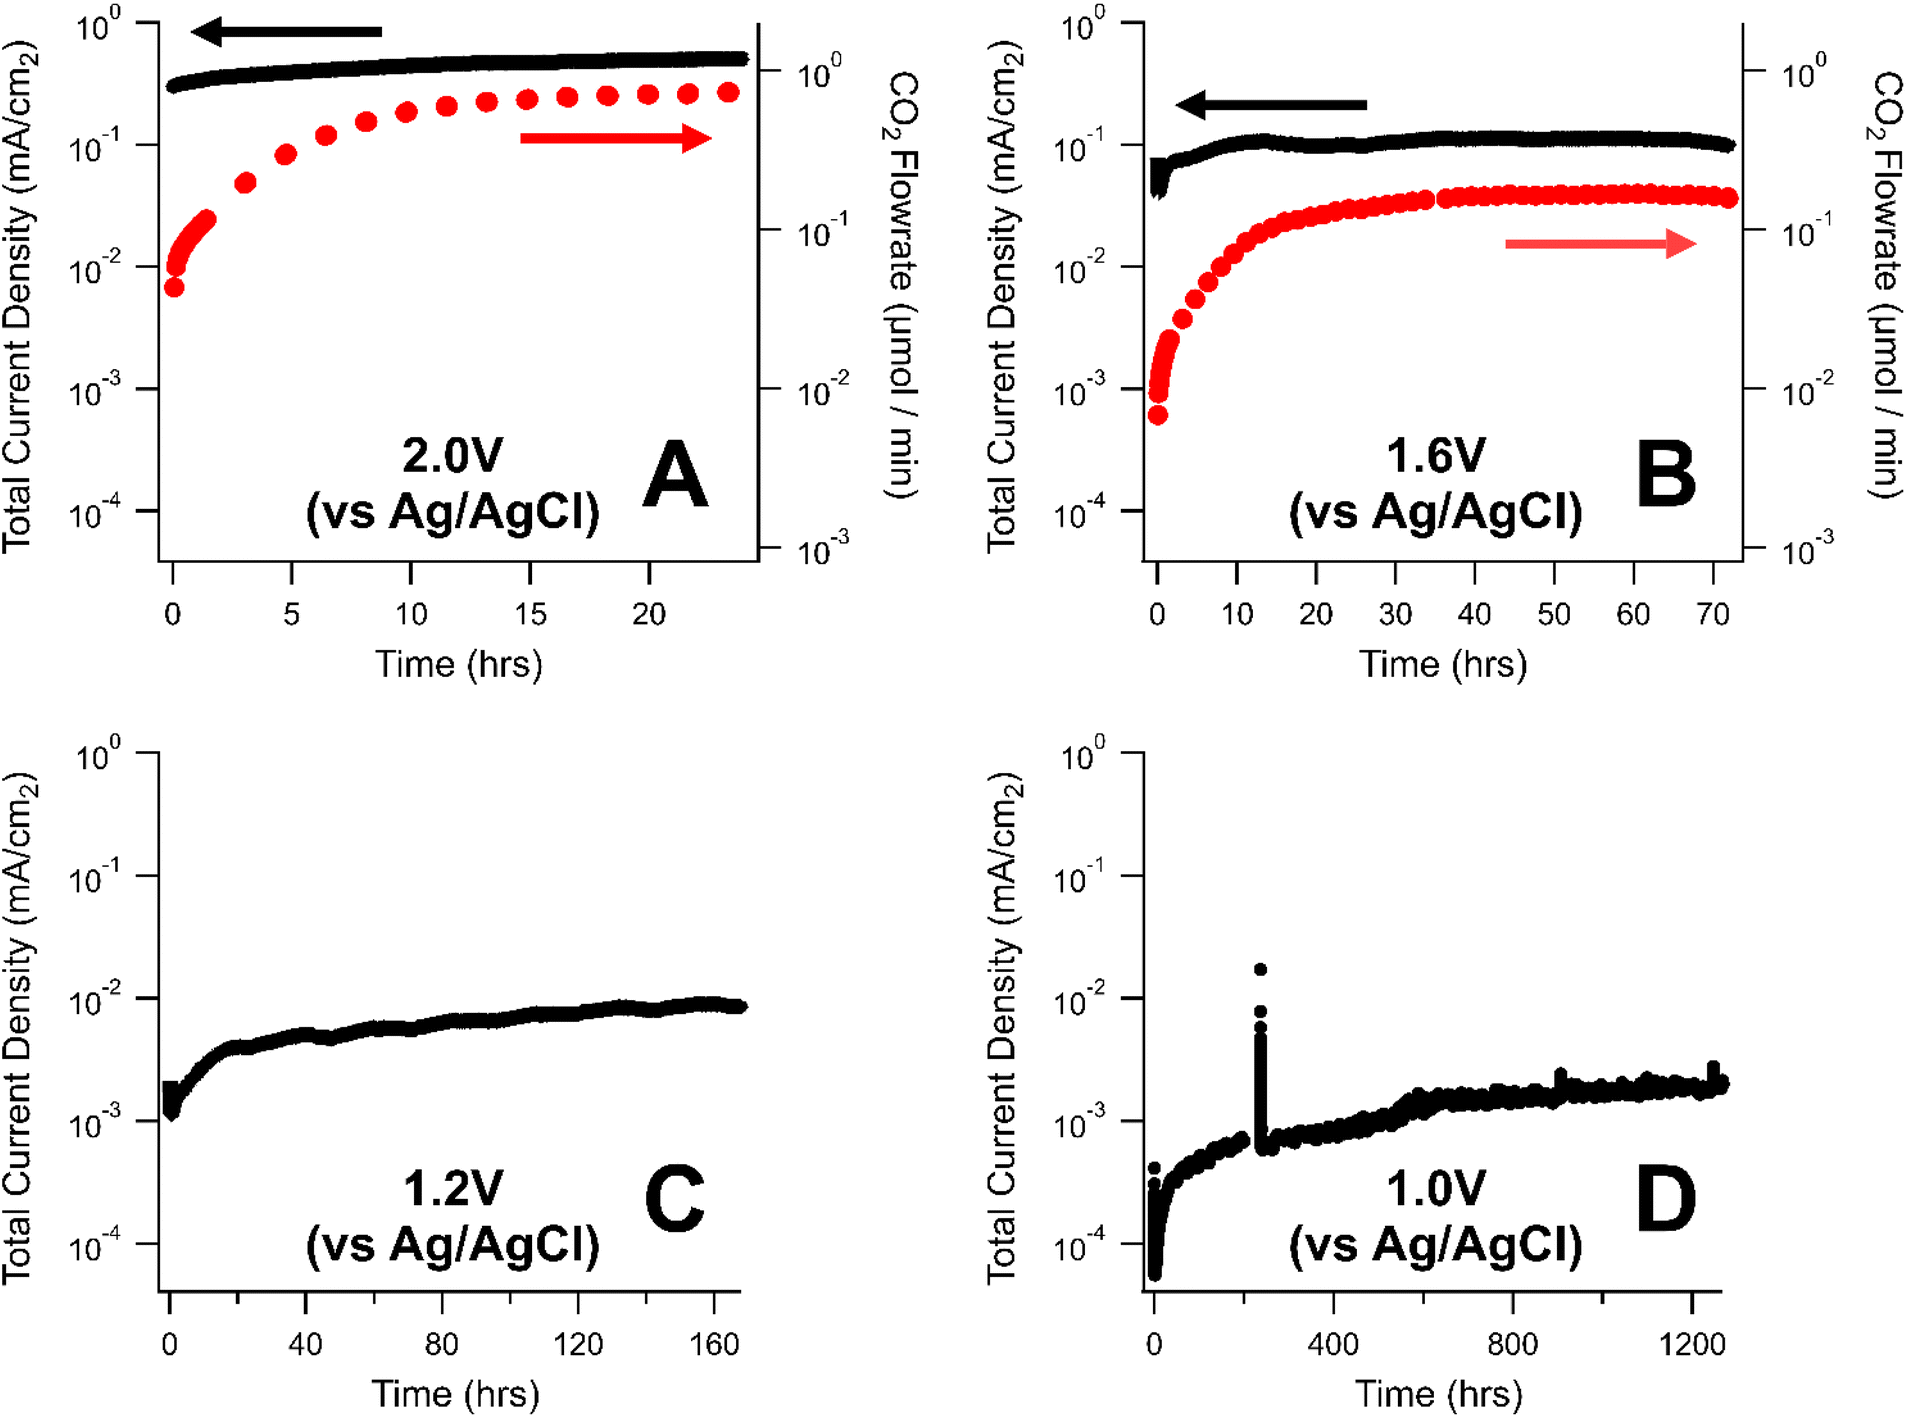 | ||
| Fig. 2 Carbon corrosion rates of a GDL held at oxidative potentials of 2.0 V (A), 1.6 V (B), 1.2 V (C), and 1.0 V (D) with respect to a saturated Ag/AgCl reference electrode. Electrolyte was a phosphate solution (5 mM, pH = 8). Black markers represent the current density (measured by the potentiostat) while red markers represent the flowrate of CO2 evolved from the GDL (calculated from the online GC). | ||
The corrosion current measured the potentiostat varied by nearly three orders of magnitude between the highest (2.0 V, Fig. 2A) and lowest voltages (1.0 V, Fig. 2D) explored in this study. Generally, the rate of carbon corrosion increased over the course of each experiment. This may be due to carbon corrosion creating imperfections in the electrode surface, thereby increasing the surface area in contact with the electrolyte. For experiments where CO2 was detectable, the CO2 flowrate gradually increased to a steady-state value at the beginning of the experiment. This transient behavior was likely due to the equilibrium between CO2 and bicarbonate in basic solutions:
| CO2(g) + OH−(aq) ⇌ HCO3−(aq) |
The normalized mass loss per day calculated for the GDLs in these experiments are reported in Table 1. In general, the mass loss exhibited an exponential relationship with the oxidative potential with 0.1%, 0.3%, 2.8%, and 10.9% of the initial GDLs mass being lost per day at 1.0 V, 1.2 V, 1.6 V, and 2.0 V vs. Ag/AgCl, respectively. Clearly, for any electrochemical system using carbon-based GDLs, it is essential to minimize the oxidative potential experienced at the anode to avoid the irreversible loss of carbon by the carbon corrosion process.
| Mass loss (mg) | % Mass loss per dayc | |||||||
|---|---|---|---|---|---|---|---|---|
| Voltage (vs. Ag/AgCl) | Voltage (vs. SHE) | Corrosion time (h) | Electrolyte type | Initial electrode mass (mg) | Potentiostat estimatea | GC estimateb | Mass balance measurementc | |
| a Estimated from the potentiostat-measured current. b Estimated from the GC-measured CO2 flowrate. c Reported value comes from mass balance measurements before and after corrosion experiment. | ||||||||
| 2.0 | 2.197 | 24 | Phosphate | 83.2 | 11.3 | 10.0 | 9.1 | 10.9% |
| KHCO3 | 82.6 | 11.6 | 11.2 | 7.5 | 9.1% | |||
| 1.6 | 1.797 | 72 | Phosphate | 82.1 | 7.9 | 7.0 | 7.0 | 2.8% |
| KHCO3 | 81.9 | 10.7 | 10.0 | 7.1 | 2.9% | |||
| 1.2 | 1.397 | 168 | Phosphate | 82.1 | 1.1 | — | 1.5 | 0.3% |
| 1.0 | 1.197 | 1293 | Phosphate | 80.5 | 1.7 | — | 2.2 | 0.1% |
Typically, potassium bicarbonate (KHCO3) electrolyte is utilized for operation of AEM MEA electrolyzers, rather than the potassium phosphate (KH2PO4/K2HPO4) utilized in this study. However, bicarbonate electrolyte makes quantification of carbon corrosion more difficult, due to the potential decomposition of the bicarbonate into CO2(g), thereby convoluting the corrosion-based CO2(g) signal detected by the GC. This issue can be avoided by using a similar electrolyte, such as potassium phosphate, which does not contain carbon as a potential source of CO2 during the experiment. To determine the validity of corrosion experiments conducted in phosphate electrolyte, a series of corrosion tests were conducted in potassium bicarbonate solution (5 mM) and compared to identical tests in potassium phosphate solution (5 mM, pH = 8) at 2.0 V vs. Ag/AgCl for 24 h (Fig. S2A†) and 1.6 V vs. Ag/AgCl for 72 h (Fig. S2B†). The potentiostat, GC, and mass balance estimates of mass loss were similar in both electrolyte solutions, but the GC-estimated mass loss was slightly higher for the bicarbonate electrolyte compared to the phosphate electrolyte at both 1.6 and 2.0 V vs. Ag/AgCl. This result was expected and was likely due to convolution of CO2 produced through carbon corrosion and CO2 produced through decomposition of KHCO3. The normalized daily mass loss was similar for both electrolytes (Table 1); phosphate solution gave 10.9% mass loss per day at 2.0 V and 2.8% mass loss per day at 1.6 V, while bicarbonate solution gave 9.1% mass loss per day at 2.0 V and 2.9% mass loss per day at 1.6 V. Overall, these results demonstrate that phosphate and bicarbonate electrolytes exhibit similar rates of carbon corrosion, but the phosphate electrolyte allows for more detailed corrosion measurements via reliable detection of CO2 produced from the carbon corrosion process.
Another control experiment in 5 mM KHCO3 was conducted with Pt mesh as the working electrode rather than a carbon-based GDL to determine whether the bicarbonate solution was electrochemically active. This experiment generated measurable amounts of CO2, particularly at highly oxidative potentials (i.e., 2.0 V vs. Ag/AgCl). This experiment highlighted the benefit of using electrolytes other than bicarbonate when quantifying and characterizing carbon corrosion.
The replicability of this corrosion testing protocol was investigated via a triplicate experiment in phosphate electrolyte (5 mM, pH = 8) at 2.0 V vs. Ag/AgCl for 24 h using smaller, hand-cut 7.5 cm2 AvcCarb GDL electrodes (Fig. S1†). Electrodes were weighed before and after each experiment to determine the relative weight loss due to carbon corrosion. The relative mass loss as a percentage of the initial GDL mass was calculated as 12.37% ± 0.04% for this triplicate study. This low standard deviation demonstrates the high degree of reproducibility for the corrosion tests utilized in this study.
SEM-EDS images of a fresh and corroded GDL were collected to obtain a visual representation of the effects of carbon corrosion (Fig. 3). The corroded electrode was exposed to harsh, accelerated corrosion conditions at 2.0 V vs. Ag/AgCl for 48 h in bicarbonate electrolyte. The measured mass loss for the GDL during this experiment was 11.0 mg, or 19.7% of its initial mass.
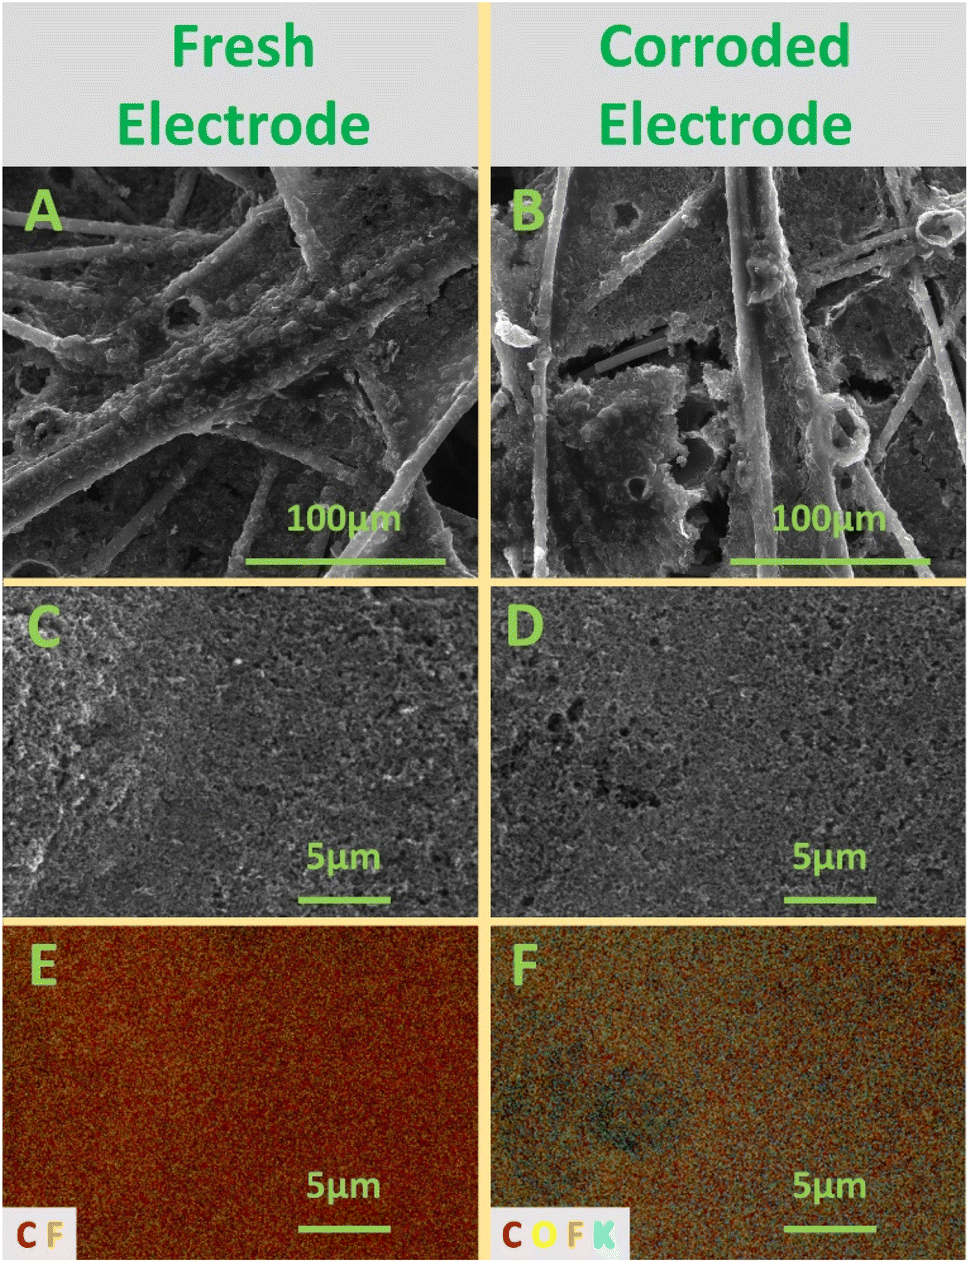 | ||
| Fig. 3 SEM images and EDS mapping for a fresh (A, C and E) and corroded (B, D and F) carbon-based GDL. Corrosion conditions were 48 h at 2.0 V vs. Ag/AgCl in bicarbonate electrolyte solution. SEM images of the carbon fiber layer (A and B) are displayed. SEM images of the microporous layer (C and D) are displayed along with the corresponding EDS map (E and F) for those images. | ||
After corrosion, the CFL (Fig. 3B) showed clear signs of degradation, with the interstitial region between individual fibers exhibiting significant erosion. Evidence for fracturing of carbon fibers can also be seen within the eroded region in the middle-left of Fig. 3B. Indications of corrosion on the MPL (Fig. 3D) were more difficult to discern through SEM, although the corroded sample appeared to exhibit some pockmarking. Very similar SEM results have been reported in PEMFCs for the CFL and the MPL.27 EDS elemental mapping of the MPL (Fig. 3E and F), however, revealed dramatic signs of carbon corrosion. Before corrosion, the SEM-EDS map is dominated by red (carbon) pixels, whereas after corrosion, the EDS map displays a much higher proportion of orange (fluorine) pixels. In fact, the weight-based ratio of C:F detected in the EDS maps dropped from 3.0:1.0 before corrosion to 1.1:1.0 after corrosion. This change is caused by carbon particles oxidizing into the gas phase as CO2, thereby revealing the underlying fluorine-based PTFE. The post-corrosion sample also exhibited detectable amounts of oxygen and potassium in the EDS map. The presence of oxygen in the sample after corrosion may indicate that surface oxide intermediates were formed on the way to complete oxidation to CO2. The potassium detected in the sample was likely due to precipitation of the KHCO3 electrolyte on the MPL. Similar changes were seen in the EDS map of the CFL, as shown in Fig. S3,† with the weight-based ratio of C:F dropping from 3.0:1.0 before corrosion to 1.6:1.0 after corrosion.
Another series of experiments were conducted on commercially available GDLs from various manufacturers to determine whether any specific GDL properties are related to the rate of carbon corrosion. The AvCarb GDS 5130 results (Fig. 1 and 2) were compared to Sigracet 39BB, Toray Paper TGP-H-120 w/MPL, and a TiO2 Fiber Felt all purchased from the Fuel Cell Store. Relevant properties for each anode material are compiled in Table S1.† Triplicate corrosion tests were performed for each GDL in potassium phosphate solution (5 mM, pH = 8) at 2.0 V vs. Ag/AgCl for 24 h. The TiO2 Fiber Felt anode was tested only once under the same conditions. Shown in Table 2 are the averaged results from these experiments.
| Mass loss (mg) | % mass loss per dayc | |||||||
|---|---|---|---|---|---|---|---|---|
| Anode material | Voltage vs. Ag/AgCl | Corrosion time (h) | Electrolyte type | Initial electrode mass (mg) | Potentiostat estimatea | GC estimateb | Mass balance measurementc | |
| a Estimated from the potentiostat-measured current. b Estimated from the GC-measured CO2 flowrate. c Reported value comes from mass balance measurements before and after corrosion experiment. | ||||||||
| AvCarb GDS 5130 | 2.0 | 24 | Phosphate | 65 ± 5 | 12 ± 2 | 11 | 8 ± 1 | 12.37 ± 0.04% |
| Sigracet 39BB | 2.0 | 24 | Phosphate | 105 ± 1 | 18 ± 5 | 15 ± 4 | 11 ± 4 | 10 ± 4% |
| Toray paper (TGP-H-120 w/MPL) | 2.0 | 24 | Phosphate | 286 ± 5 | 22 ± 12 | 18 ± 10 | 12 ± 6 | 4 ± 2% |
| Titanium fiber felt | 2.0 | 24 | Phosphate | 563.5 | 1 | 0 | −1 | 0% |
The various GDLs tested for carbon corrosion exhibited a range of physical properties, including different area densities and PTFE loadings (Table S1†). Regardless, the measured mass loss from corrosion at 2.0 V for 24 h was similar for all GDLs (within error) regardless of manufacturer. The overall measured % mass loss per day (Table 2) for each GDL was inversely correlated with the area density (Table S1†) and initial electrode mass. This result suggests that electrodes with a greater thickness and area density may last longer in corrosive environments, simply because there is a larger amount of carbonaceous material that must be oxidized before the anode fails. The impact of GDL properties on electrolyzer performance has only recently gained attention for the CO2 reduction reaction.70 On the cathode, studies have found that thicker MPLs and GDLs help suppress electrolyte flooding,71 maximize selectivity to the desired reduction product (particularly at high current densities),70,71 and improve long-term electrolyzer performance.70 On the anode, Schwartz et al. found that thicker GDLs exhibited superior performance and attributed this to the their ability to retain water within the membrane and catalyst layers.72 Further research in this area is needed to develop structure–performance relationships for GDLs and rationally design anodes for CO2 electrolysis. It is possible that carbon-based anode GDLs with reasonable lifetimes could be developed in the future, but they are not currently on the market today.
Metal-based diffusion layers are widely utilized on the anode for water electrolyzers73 and represent an interesting alternative to carbon-based anode GDLs in CO2 electrolysis. Titanium,73–76 stainless-steel,77,78 and nickel-based73,79–81 materials have been studied as anode materials, depending on the pH and environment at the anode. Titanium-based PTLs are the most common diffusion media for polymer electrolyte membrane water electrolyzers,77 so we briefly explored the corrosion behavior of a titanium fiber felt. The Ti fiber felt exhibited no measurable mass loss from corrosion after exposure to the same conditions (2.0 V vs. Ag/AgCl for 24 h) as the various carbon-based GDLs (Table 2). This result does not suggest that Ti-based PTLs are strictly superior to carbon-based GDLs but does demonstrate that they are mechanically and structurally resistant to corrosion even at high oxidative voltages. However, utilization of Ti on the anode comes with a unique set of challenges. For example, Ti-based materials are significantly more expensive than carbon or stainless-steel components.77,78 Additionally, exposure of Ti to anodic voltages encourages the rapid growth of an insulating TiO2 layer on the surface.77,82 More research in this area is needed to determine the suitability of various metal PTLs as anode diffusion layers in CO2 electrolyzers.
While the above experiments were performed on catalyst-free GDLs, AEM CO2 electrolyzers include an OER catalyst layer on the anode to facilitate the generation of electrons at low oxidative voltages. IrOx-based electrocatalysts are the most commonly used OER catalyst due to their high activity and stability.83,84
IrOx-based catalysts have also been investigated in the PEMFC literature to limit the effects of carbon corrosion during extreme events such as startup/shutdown or anode fuel starvation.68,69 Typically, PEMFCs employ Pt-based catalysts on both the cathode (oxygen reduction reaction) and the anode (hydrogen oxidation reaction).85 However, when H2 fuel starvation occurs, the anodic hydrogen oxidation reaction is halted and replaced with water electrolysis and carbon corrosion. In response, the anode swings to high oxidative potentials to supply sufficient protons and electrons to maintain operation of the cell at a given current density.22,23 At these elevated oxidative potentials, carbon-based GDLs corrode and fail rapidly. Some groups have developed “reversal tolerant anodes” (RTAs) to combat this degradation pathway, primarily by adding an OER catalyst, such as IrOx, to the anode.22,23,86–88 During fuel starvation events, these RTAs provide an alternative reaction pathway for generating electrons and protons through OER at lower oxidative voltages. While carbon corrosion still occurs, the rate is minimized due to the lower oxidative potential experienced by the GDL.
Despite the popularity of IrOx as an OER catalyst, the effect of IrOx on the kinetics of carbon corrosion is not well understood. Other noble metal electrocatalysts, such as Pt, have been shown to accelerate the rate of carbon corrosion compared to catalyst-free GDLs under a given set of conditions.67,68,89–91 In contrast, IrOx-coated GDLs have been shown to limit carbon corrosion during operando PEMFC cell operation.22,23,86–88 However, the corrosion resistance imparted by IrOx comes about by removing the external driving force of the corrosion reaction (the oxidative potential), not necessarily by affecting the kinetics or mechanism of the reaction itself. More fundamental studies, including cyclic voltammetry, constant potential corrosion experiments, and other tests performed for Pt-based electrocatalysts, are needed to fully characterize the effect of IrOx-based catalysts on carbon corrosion in electrochemical devices.
In this work, we explored the effect of an OER catalyst layer on the rate of carbon corrosion using a Dioxide Materials IrO2-coated carbon-based GDL.34 Experiments were conducted in phosphate electrolyte solution at 2.0 V for 72 hours (Fig. 4A) and 1.6 V for 168 hours (Fig. 4B) and compared to corrosion tests performed on catalyst-free GDLs. The catalyst-coated GDLs were held under corrosive conditions for longer periods of time than the catalyst-free GDLs to obtain measurable mass losses.
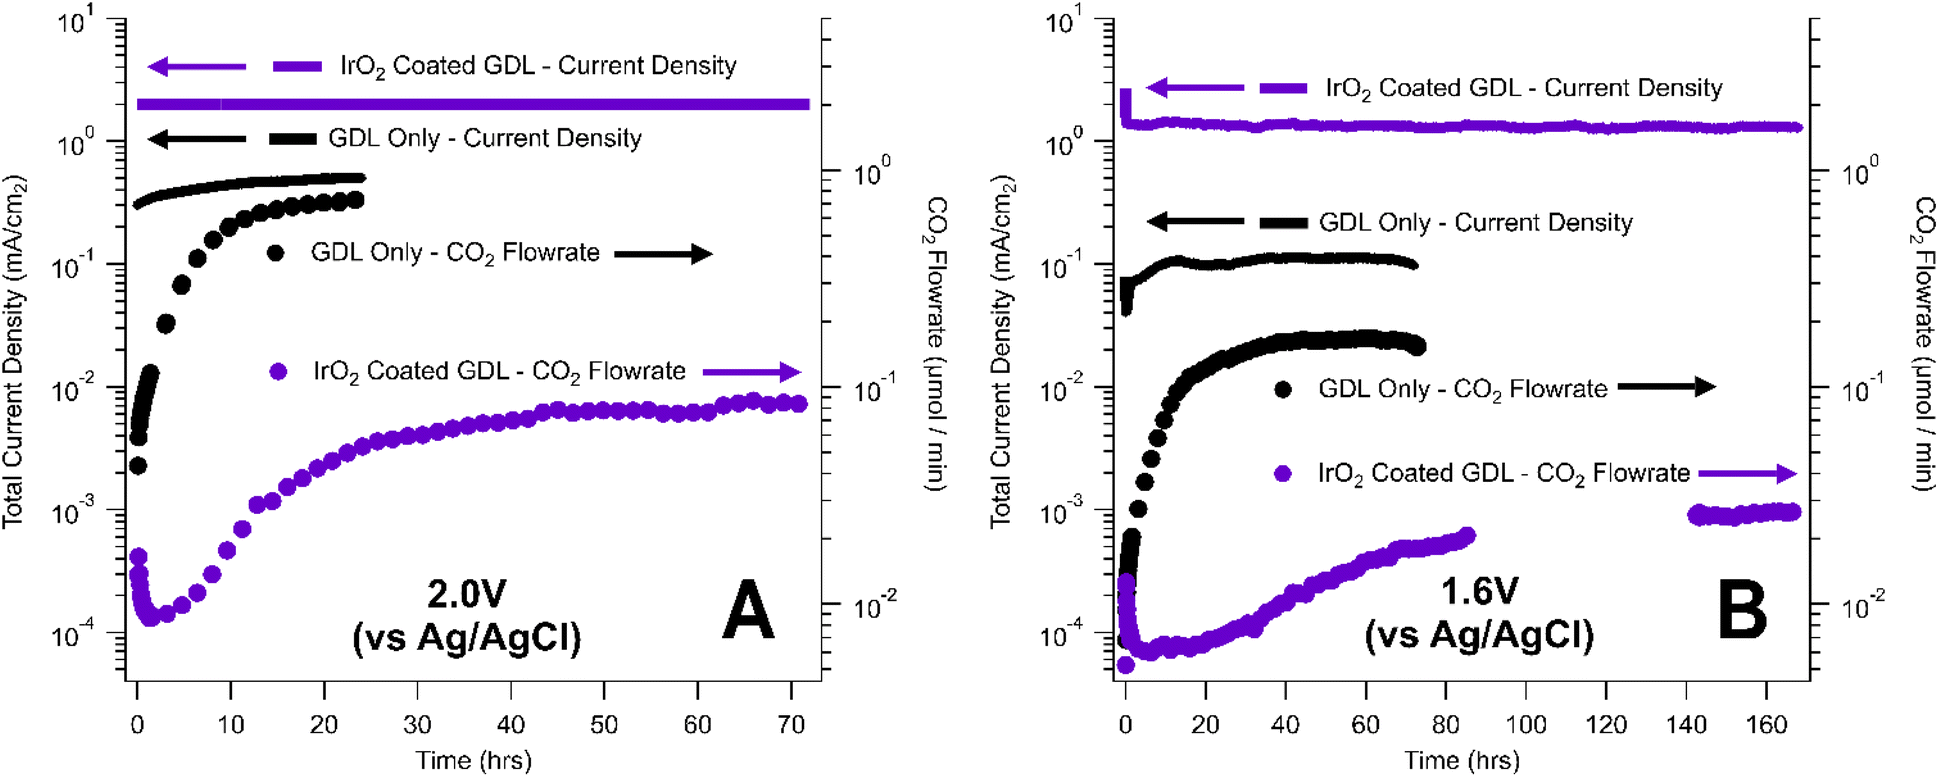 | ||
| Fig. 4 Comparison of carbon corrosion rates for an IrO2-coated GDL (purple) and AvCarb GDS 5130 GDL with no catalyst layer (black). Current density (lines, left axis) and CO2 evolved (dots, right axis) are plotted against time for experiments held at (A) 2.0 V and (B) 1.6 V vs. Ag/AgCl for 24 h. | ||
At both potentials (1.6 V and 2.0 V), the IrO2-coated GDLs generated higher current densities than the catalyst-free GDL, due to the enhanced OER kinetics (Fig. 4). Despite the increase in total current density, catalyst-coated GDLs also exhibited lower rates of CO2 generation via carbon corrosion than the catalyst-free GDLs. This result suggests that the presence of the catalyst layer assists in suppressing the rate of carbon corrosion under a given set of conditions. This conclusion could be convoluted by the fact that the two samples utilized two different carbon-based GDLs – the catalyst-free GDL was an AvCarb GDS 5130 while the IrO2-coated GDL was supported on Sigracet 35 BC. However, our corrosion tests of catalyst-free AvCarb GDS 5130 and catalyst-free Sigracet 39BB (the most similar commercially available substitute for Sigracet 35 BC) showed little or no difference between the overall rate of carbon corrosion for these two GDLs (Table 2). Perhaps more importantly, the IrO2-coated GDL from Dioxide Materials was synthesized by spray coating an IrO2 ink with a PTFE binder.34 The presence of an additional PTFE layer on the MPL could enhance the corrosion resistance of the IrO2-coated GDL compared to the native GDL. Overall, IrOx-based catalyst layers appear to enhance the corrosion resistance of carbon-based GDLs under oxidative conditions, but the source of this corrosion resistance is currently unclear. Further fundamental research and controls are needed to determine the role of each component of the catalyst layer in suppressing carbon corrosion, thereby enabling the design of better corrosion resistant GDLs in CO2 electrolysis and other electrochemical applications.
The measured and estimated mass losses during corrosion of the IrO2-coated electrodes are displayed in Table 3. During these experiments, a significant portion of the total current density was generated through the OER, rather than the carbon corrosion reaction. In alkaline solutions, the OER is understood to proceed through the following 4-electron process:92
| 4OH− → O2(g) + 2H2O(l) + 4e− |
| Mass loss (mg) | % mass loss per dayd | |||||||
|---|---|---|---|---|---|---|---|---|
| Voltage (vs. Ag/AgCl) | Voltage (vs. SHE) | Corrosion time (h) | Initial electrode mass (mg) | Corrosion FEa (%) | Potentiostat estimateb | GC estimatec | Mass balance measurementd | |
|
a Calculated based on molar ratio of CO2:O2 detected by GC near end of experiment.
b Estimated from the potentiostat-measured current and corrected using the calculated faradaic efficiency.
c Estimated from the GC-measured CO2 flowrate.
d Reported value comes from mass balance measurements before and after corrosion experiment.
|
||||||||
| 2.0 | 2.197 | 72 | 213.3 | 2.3% | 4.0 | 3.1 | 3.8 | 0.6% |
| 1.6 | 1.797 | 168 | 213.9 | 1.1% | 2.6 | 2.2 | 2.9 | 0.2% |
Both carbon corrosion and the OER are 4-electron processes that generate one molecule of gas-phase product, CO2(g) or O2(g) respectively. As a result, a faradaic efficiency was calculated for the IrO2-coated GDLs based on the molar ratio of CO2 to O2 detected by the GC near the end of each experiment. This FE was then used as a “correction factor” for the potentiostat-based mass loss estimate.
ICP-OES was performed for IrO2-coated and catalyst-free electrodes (Table S2†) and electrolyte solutions (Table S3†) from various corrosion experiments to characterize changes in chemical makeup resulting from carbon corrosion. Spent electrolyte solutions from corrosion tests involving IrO2-coated electrodes did not exhibit detectable concentrations of iridium (Table S3†), suggesting that iridium did not leach into the solution at significant quantities during those corrosion tests. This is consistent with our mass loss calculations, which also did not consider any mass losses associated with dissolution of catalyst particles. ICP results also revealed that the spent electrodes contained high levels of potassium and low levels of phosphorous (Table S2†), likely caused by precipitation of the potassium phosphate electrolyte. SEM images and EDS spectra were collected for fresh and spent IrO2-coated electrodes (Fig. S5†), but no obvious changes were seen in these samples. This is consistent with the ICP-OES results, which showed no evidence of iridium leaching and is likely due to the small overall amount of corrosion (∼2% total mass loss) that occurred during those experiments. At higher total mass loss percentages, we expect that the carbon-based MPL support would begin to disintegrate, as evidenced by SEM images of the highly corroded catalyst-free MPL (Fig. 3), resulting in significant mass losses from degradation and leaching of the catalyst layer.
4. Discussion
The mass loss results from the ex situ carbon corrosion test represent a significant and irreversible loss of carbon from the electrodes. For both bare GDLs and IrO2-coated GDLs, the estimates of mass loss by both the total current passed (potentiostat estimate) and the CO2 detected (GC estimate) closely match the actual mass loss as measured before and after each experiment (see Tables 1–3). This confirms the utility of the ex situ carbon corrosion test for quantifying rates of carbon corrosion in the alkaline CO2 electrolysis environment. In operating AEM MEAs used in CO2 electrolysis, the CO2 produced from carbon corrosion is not able to be detected because CO2 is present on both anode and cathode. CO2 is fed to the cathode as a reactant, and a significant amount of CO2 crosses over to the anode. Additionally, mass loss from carbon corrosion in AEM MEAs is very difficult to accurately measure, as the MEA must be disassembled following testing. This MEA disassembly often induces physical changes to the MEA, such as catalyst delamination. These physical changes prevent an accurate measurement of weight loss from carbon corrosion and make characterization of the spent MEA components more challenging. As such, we believe that ex situ corrosion tests, such as the one outlined in this manuscript, are best suited to characterizing and quantifying rates of carbon corrosion under conditions relevant to CO2 electrolyzers.Based on the mass loss results presented in Tables 1–3 anodic carbon corrosion is clearly a significant degradation pathway for CO2 electrolysis systems. At an extreme anodic voltage of 2.0 V, 10% of the mass of the bare GDL is lost per day. This represents an accelerated degradation condition, as this is much higher than the anode voltage in operating MEAs. However, it is not straightforward to determine the anode voltage in operating MEAs, and most MEA tests only report cell voltage via a 2-electrode measurement where cell voltages around 3 V are typically reported. To determine the actual voltage experienced by the anode, membrane, and cathode in operating CO2 MEAs, the Berlinguette group developed a cell with two reference electrodes, the first in contact with the membrane, and the second in contact with the anode GDE.93 At 200 mA cm−2 and an overall cell voltage of 2.73 V, the measured voltages were −1.43, 0.71, and 0.58 V vs. Ag/AgCl for the cathode, membrane, and anode, respectively. To compare these results to an MEA operating with a lower pH anolyte, the potential of the OER must be corrected for pH. The OER occurs at lower potentials at higher pH, and the standard reduction potential is 0.36 V lower at pH = 14 (1 M KOH) than at pH = 8 which was used in the ex situ carbon corrosion test in this study. Therefore, accounting for the lower pH, the anode voltage expected when using 5 mM KHCO3 as the anolyte is 0.94 V (0.58 V + 0.36 V) vs. Ag/AgCl. A similar study that integrated reference electrodes into operating MEAs for AEM water electrolysis reported anode voltages between 0.9 and 1.2 V vs. Ag/AgCl at 200 mA cm−2, depending on the GDL used.94 These results justify the use of 1 V as a realistic, or even optimistic anode voltage for operating AEM MEAs used in CO2 electrolysis. While the corrosion mass loss is reduced at lower anodic voltages, even the relatively mild 1.0 V corrosion test (Table 1) exhibited 0.1% GDL mass loss per day. This would result in a loss of 5% of the mass of the GDL in 50 days. Similar levels of mass loss have been reported for PEMFCs, with 5% mass loss in 2000 hours (83 days) at 0.75 V.21 Clearly, even at realistic anode voltages, carbon corrosion is too significant to lead to an acceptable MEA lifetime of at least 4 years.
Currently, a gap exists between CO2 electrolysis anode materials employed by commercial entities and research institutions. In the literature, many studies the use of carbon-based gas diffusion media on the anode.33–43 Contrastingly, most scale-up efforts have relied on metal-based anodes, such as Ti-based porous transport layers (PTLs). Shown in Table 4 is an overview of some industrial CO2 electrolyzer technologies, patents, and publications with a particular focus on the design of the anode.
| Company name | Target product | Electrolyzer architecture | Stack surface area (cm2) | Conversion rate | Anode material and info |
|---|---|---|---|---|---|
| Haldor Topsoe | CO95 | SOEC95 | — | ∼4500 kg CO2 per day (96 Nm3 CO2 per h)95 | (Not a low temperature electrolyzer) |
| Det Norske Veritas | Formate44 | Filter-press reactor44 | 600 (ref. 10) | 1 kg CO2 per day10 | Ti-based with Ta2O5 and IrO2 coatings44 |
| Mantra Energy | Formate45 | Trickle bed reactor96,97 | — | 100 kg CO2 per day10,45 | Stainless steel mesh96 |
| Dioxide Materials | Formic acid43 | MEA43 | 5 (ref. 43) | — | IrO2 on toray paper or IrO2 on expanded Ti43 |
| CO48,98 | MEA48,98 | 250 (ref. 98) | — | IrO2 on 5% carbon fiber paper98 or Pt catalyst coated membrane48 | |
| Siemens and Evonik | Syngas (CO + H2)49,50,99 | GDE in “flow-by Mode”99 | 3000 (ref. 49 and 99) | ∼10 kg CO2 per day (0.25 Nm3 CO per hr)99 | IrO2 coated Ti expanded metal50 |
| Liquid Light/Avantium | Formate (to oxalic acid)55,58 | 3-Chamber configuration58 | 2000 (ref. 58) | 6 kg CO2 per day58 | Electroless plated nickel sulfide on Cu foam58 or Ti-based54–57 |
| Twelve/Opus 12 | CO59 | MEA60–62 | — | Few kg CO2 per day59 | Titanium mesh or titanium felt60–62 |
Early adoption of PTLs on the anode of CO2 electrolyzers will allow for issues related to PTL-MEAs to be addressed sooner, which will ultimately lead to a quicker path to commercialization. PTL MEAs have not been sufficiently studied by the CO2 research community, and optimization of the anode PTL for CO2 electrolysis represents an area of impactful opportunity. Moving past the use of carbon materials on the anode for CO2 electrolysis, there could still be corrosion concerns for the non-carbon PTLs used. While these PTLs are significantly more resistant to corrosion than carbon GDLs, the oxidative potentials experienced on the anode can still lead to durability concerns, particularly for reaching the very long lifetimes (e.g., >4 years) needed for commercialization.22,23
Given the significant anodic carbon corrosion reported here, as well as reported carbon corrosion issues in low-temperature fuel cells and water electrolyzers, the CO2 electrolysis community would benefit from rapidly transitioning away from the use of carbon materials on the anode. CO2 electrolysis systems should leverage the experience in water electrolysis, as the anodic environment is similarly harsh in CO2 electrolysis. However, it is likely that for specific short-term experiments, many in the CO2 utilization field will continue to use carbon-based materials on the anode, as carbon GDLs have advantages including familiarity with researchers, facile mass transport of reactants and products, good electrical conductivity, low cost, and stability under mild conditions.77 Here, we recommend that carbon materials are only appropriate on the anode for short-term experiments (<100 hours) that are not probing system durability. This follows prior recommendations from PEM water electrolysis systems, where it is not recommended to use carbon on the anode for experiments longer than 20 hours.31 Most commercial and pilot scale CO2 electrolyzers already avoid the use of carbon on the anode, due to the stability-limiting effects of carbon corrosion. Moving forward, to better align research experiments with industry best practices, CO2 electrolysis MEA studies aimed at scale-up and commercial relevance should also move away from the utilization of carbon-based GDLs on the anode.
5. Conclusions
In this work, an ex situ carbon corrosion test has been developed to quantify anodic carbon corrosion in the CO2 electrolysis environment. Using this test, extensive carbon corrosion has been quantified at realistic anodic voltages experienced in operating CO2 electrolysis cells. The mass loss from carbon corrosion measured in the ex situ experiments was found to closely match mass loss estimates from both the total CO2 detected from the experiment and from the total current passed. An unacceptably high mass loss has been quantified for both IrO2-coated and catalyst-free carbon GDLs. Given the carbon corrosion results presented here and following guidance from scaled-up industrial CO2 electrolyzers, we recommend that the field moves away from using carbon-based materials on the anode of CO2 MEAs. If carbon materials are employed on the anode of CO2 electrolysis systems, it is only appropriate for short-term experiments at low cell voltages. However, for longer-term experiments (>100 hours) and experiments investigating durability of CO2 MEAs, carbon-based anodes should be avoided entirely.Author contributions
J. Ferrell: conceptualization, investigation, formal analysis, writing – original draft, writing – review & editing, supervision, funding acquisition, project administration. M. Rasmussen: investigation, formal analysis, writing – original draft, writing – review & editing. W. W. McNeary: investigation, writing – review & editing.Conflicts of interest
There are no conflicts to declare.Acknowledgements
This work was authored by the National Renewable Energy Laboratory, operated by Alliance for Sustainable Energy, LLC, for the U. S. Department of Energy (DOE) under Contract No. DE-AC36-08GO28308. Funding provided by the U. S. Department of Energy Office of Energy Efficiency and Renewable Energy Bioenergy Technologies Office. The views expressed in the article do not necessarily represent the views of the DOE or the U. S. Government. The U. S. Government retains and the publisher, by accepting the article for publication, acknowledges that the U. S. Government retains a nonexclusive, paid-up, irrevocable, worldwide license to publish or reproduce the published form of this work, or allow others to do so, for U. S. Government purposes.Notes and references
- AR6 Synthesis Report: Climate Change 2023, 2023 Search PubMed.
- S. J. Davis, N. S. Lewis, M. Shaner, S. Aggarwal, D. Arent, I. L. Azevedo, S. M. Benson, T. Bradley, J. Brouwer, Y. M. Chiang, C. T. M. Clack, A. Cohen, S. Doig, J. Edmonds, P. Fennell, C. B. Field, B. Hannegan, B. M. Hodge, M. I. Hoffert, E. Ingersoll, P. Jaramillo, K. S. Lackner, K. J. Mach, M. Mastrandrea, J. Ogden, P. F. Peterson, D. L. Sanchez, D. Sperling, J. Stagner, J. E. Trancik, C. J. Yang and K. Caldeira,
et al.
, Science, 2018, 360(6396), eaas9793 CrossRef
.
- R. G. Grim, D. Ravikumar, E. C. D. Tan, Z. Huang, J. R. Ferrell, M. Resch, Z. Li, C. Mevawala, S. D. Phillips, L. Snowden-Swan, L. Tao and J. A. Schaidle, Energy Environ. Sci., 2022, 15, 4798–4812 RSC
- 2016 Billion-Ton Report: Advancing Domestic Resources for a Thriving Bioeconomy, 2016 Search PubMed.
- R. G. Grim, Z. Huang, M. T. Guarnieri, J. R. Ferrell, L. Tao and J. A. Schaidle, Energy Environ. Sci., 2020, 13, 472–494 RSC
- H. Shin, K. U. Hansen and F. Jiao, Nat. Sustain., 2021, 4, 911–919 CrossRef
- Z. Huang, R. G. Grim, J. A. Schaidle and L. Tao, Energy Environ. Sci., 2021, 14, 3664–3678 RSC
- M. Goldman, A. Prajapati, E. Duoss, S. Baker and C. Hahn, Curr. Opin. Electrochem., 2023, 39, 101248 CrossRef CAS
- B. Endrődi, G. Bencsik, F. Darvas, R. Jones, K. Rajeshwar and C. Janáky, Prog. Energy Combust. Sci., 2017, 62, 133–154 CrossRef
- O. G. Sánchez, Y. Y. Birdja, M. Bulut, J. Vaes, T. Breugelmans and D. Pant, Curr. Opin. Green Sustainable Chem., 2019, 16, 47–56 CrossRef
- S. D. Ebbesen and M. Mogensen, J. Power Sources, 2009, 193, 349–358 CrossRef CAS
- Y. Song, X. Zhang, K. Xie, G. Wang and X. Bao, Adv. Mater., 2019, 31, 1902033 CrossRef CAS
- D. Higgins, C. Hahn, C. Xiang, T. F. Jaramillo and A. Z. Weber, ACS Energy Lett., 2019, 4, 317–324 CrossRef CAS
- E. W. Lees, B. A. W. Mowbray, F. G. L. Parlane and C. P. Berlinguette, Nat. Rev. Mater., 2021, 7, 55–64 CrossRef
- D. T. Whipple, E. C. Finke and P. J. A. Kenis, Electrochem. Solid-State Lett., 2010, 13, B109–B111 CrossRef CAS
- L. Ge, H. Rabiee, M. Li, S. Subramanian, Y. Zheng, J. H. Lee, T. Burdyny and H. Wang, Chem, 2022, 8, 663–692 CAS
- I. Merino-Garcia, E. Alvarez-Guerra, J. Albo and A. Irabien, Chem. Eng. J., 2016, 305, 104–120 CrossRef CAS
- U. O. Nwabara, M. P. De Heer, E. R. Cofell, S. Verma, E. Negro and P. J. A. Kenis, J. Mater. Chem. A, 2020, 8, 22557–22571 RSC
- S. Verma, B. Kim, H. R. M. Jhong, S. Ma and P. J. A. Kenis, ChemSusChem, 2016, 9, 1972–1979 CrossRef CAS
- R. G. Grim, J. R. Ferrell, Z. Huang, L. Tao and M. G. Resch, Joule, 2023, 7, 1684–1699 CrossRef CAS
- U. O. Nwabara, E. R. Cofell, S. Verma, E. Negro and P. J. A. Kenis, ChemSusChem, 2020, 13, 855–875 CrossRef CAS PubMed
- T. Labi, F. Van Schalkwyk, S. M. Andersen, P. Morgen, S. C. Ray and J. Chamier, J. Power Sources, 2021, 490, 229568 CrossRef CAS
- T. R. Ralph, S. Hudson and D. P. Wilkinson, ECS Trans., 2006, 1, 67–84 CrossRef CAS
- N. Garland, T. Benjamin and J. Kopasz, ECS Trans., 2007, 11, 923–931 CrossRef CAS
-
T. Abdel-Baset, T. Benjamin, R. Borup, K. Epping Martin, N. Garland, S. Hirano, J. Kopasz, B. Lakshmanan, D. Masten, M. Mehall, D. Myers, D. Papageorgopoulos, W. Podolski, T. Trabold, B. Vermeersch and J. Waldecker, Fuel Cell Technical Team Roadmap, 2013 Search PubMed
- P. Ren, P. Pei, Y. Li, Z. Wu, D. Chen and S. Huang, Prog. Energy Combust. Sci., 2020, 80, 100859 CrossRef
- J. Sim, M. Kang, K. Min, E. Lee and J. Y. Jyoung, Renew. Energy, 2022, 190, 959–970 CrossRef CAS
- T. Ha, J. Cho, J. Park, K. Min, H. S. Kim, E. Lee and J. Y. Jyoung, Int. J. Hydrogen Energy, 2011, 36, 12436–12443 CrossRef CAS
- K. Tomantschger, R. Findlay, M. Hanson, K. Kordesch and S. Srinivasan, J. Power Sources, 1992, 39, 21–41 CrossRef CAS
- K. Ayers, N. Danilovic, R. Ouimet, M. Carmo, B. Pivovar and M. Bornstein, Annu. Rev. Chem. Biomol. Eng., 2019, 10, 219–239 CrossRef CAS PubMed
- G. Bender, M. Carmo, T. Smolinka, A. Gago, N. Danilovic, M. Mueller, F. Ganci, A. Fallisch, P. Lettenmeier, K. A. Friedrich, K. Ayers, B. Pivovar, J. Mergel and D. Stolten, Int. J. Hydrogen Energy, 2019, 44, 9174–9187 CrossRef CAS
- Z. Kang, S. M. Alia, J. L. Young and G. Bender, Electrochim. Acta, 2020, 354, 136641 CrossRef CAS
- U. O. Nwabara, A. D. Hernandez, D. A. Henckel, X. Chen, E. R. Cofell, M. P. De-Heer, S. Verma, A. A. Gewirth and P. J. A. Kenis, ACS Appl. Energy Mater., 2021, 4, 5175–5186 CrossRef CAS
- R. B. Kutz, Q. Chen, H. Yang, S. D. Sajjad, Z. Liu and I. R. Masel, Energy Technol., 2017, 5, 929–936 CrossRef CAS
- S. Hernandez-Aldave and E. Andreoli, Catalysts, 2020, 10, 713 CrossRef CAS
- Z. Liu, H. Yang, R. Kutz and R. I. Masel, J. Electrochem. Soc., 2018, 165, J3371–J3377 CrossRef CAS
- B. Endrödi, E. Kecsenovity, A. Samu, F. Darvas, R. V. Jones, V. Török, A. Danyi and C. Janáky, ACS Energy Lett., 2019, 4, 1770–1777 CrossRef PubMed
- K. Jiang, S. Siahrostami, T. Zheng, Y. Hu, S. Hwang, E. Stavitski, Y. Peng, J. Dynes, M. Gangisetty, D. Su, K. Attenkofer and H. Wang, Energy Environ. Sci., 2018, 11, 893–903 RSC
- L. M. Aeshala, R. Uppaluri and A. Verma, Phys. Chem. Chem. Phys., 2014, 16, 17588–17594 RSC
- R. L. MacHunda, J. Lee and J. Lee, Surf. Interface Anal., 2010, 42, 564–567 CrossRef CAS
- Z. Bitar, A. Fecant, E. Trela-Baudot, S. Chardon-Noblat and D. Pasquier, Appl. Catal., B, 2016, 189, 172–180 CrossRef CAS
- S. Lee, H. K. Ju, R. Machunda, S. Uhm, J. K. Lee, H. J. Lee and J. Lee, J. Mater. Chem. A, 2015, 3, 3029–3034 RSC
- H. Yang, J. J. Kaczur, S. D. Sajjad and R. I. Masel, J. CO2 Util., 2017, 20, 208–217 CrossRef CAS
-
Y. Zhai, S. Guan, N. Sridhar and A. Agarwal, Method and Apparatus for the Electrochemical Reduction of Carbon Dioxide, WO2012040503A2, 2012
- P. Ganji, R. A. Borse, J. Xie, A. G. A. Mohamed and Y. Wang, Adv. Sustainable Syst., 2020, 4, 2000096 CrossRef CAS
-
C. Oloman and H. Li, Continuous Co-Current Electrochemical Reduction Of Carbon Doxde, US Pat., US20160068974A1, 2016 Search PubMed
-
J. J. Kaczur, H. Yang, S. D. Sajjad and R. I. Masel, Method And System For Electrochemical Production Of Formic Acid From Carbon Dioxide, US Pat., US10047446B2, 2018 Search PubMed
-
R. I. Masel, B. A. Rosen and W. Zhu, Devices And Processes For Carbon Doxde Conversion Into Useful Fuels And Chemicals, US Pat., US9181625B2, 2015 Search PubMed
- CO2 for a clean performance: Rheticus research project enters phase 2, https://press.siemens.com/global/en/pressrelease/research-project-rheticus, accessed 19 August 2023.
- R. Krause, D. Reinisch, C. Reller, H. Eckert, D. Hartmann, D. Taroata, K. Wiesner-Fleischer, A. Bulan, A. Lueken and G. Schmid, Chem. Ing. Tech., 2020, 92, 53–61 CrossRef CAS
- T. Haas, R. Krause, R. Weber, M. Demler and G. Schmid, Nat. Catal., 2018, 1, 32–39 CrossRef CAS
-
R. Krause, C. Reller, G. Schmid, B. Schmid and F. Steinbacher, Production Of Gas Diffusion Electrodes Comprising Ion Transport Resins For Electrochemical Reduction Of CO2, US Pat., US20200131649A1, 2020 Search PubMed
-
B. Schmid, C. Reller and G. Schmid, Two-Membrane Construction For Electrochemically Reducing CO, US Pat., US20200080211A1, 2020 Search PubMed
-
J. J Kaczur, P. Kaczur and K. Teamey, Method And System For Electrochemical Reduction Of Carbon Dioxide Employing A Gas Diffusion Electrode, US Pat., US10329676, 2019 Search PubMed
-
J. J. Kaczur and K. Teamey, Integrated Process For Producing Carboxylic Acids From Carbon Doxde, US Pat., US9085827B2, 2015 Search PubMed
-
J. J. Kaczur, P. Lakkaraju and J. Krasovic, Method and System for
Electrochemical Reduction of Carbon Dioxide Employing a Gas, WO2017118712A1, 2017
-
Z. Twardowski, E. B. Cole, J. J. Kaczur, K. Teamey, K. A. Keets, R. Parajuli, A. Bauer, N. Sivasankar, G. Leonard, T. J. Kramer, P. Majsztrik and Y. Zhu, Method and System for Production of Oxalic Acid and Oxalic Acid Reduction Products, US Pat., US9267212B2, 2016 Search PubMed
-
P. Moser, S. Schmidt, K. Stahl, A. Mol, D. Petrutiu, J. Krasovic, A. Smith, A. Turetta, A. Morosanu and M. Antonini, in 16th International Conference on Greenhouse Gas Control Technologies (GHGT-16), SSRN, 2022, DOI:10.2139/SSRN.4274076
- A. K. Buckley, S. Ma, Z. Huo, T. Z. Gao and K. P. Kuhl, Nat. Nanotechnol., 2022, 17, 811–813 CrossRef CAS PubMed
-
K. P. Kuhl, E. R. Cave and G. Leonard, Reactor With Advanced Architecture For The Electrochemical Reaction Of CO2, CO, And Other Chemical Compounds, US Pat., US20220010437A1, 2022 Search PubMed
-
E. R. Cave, S. Ma, Q. Zeng, S. Hunegnaw, K. P. Kuhl, G. Leonard, A. D. Mishra and A. R. Kashi, George Leonard, Ashley D. Mishra, Ajay R. Kashi, Electrolyzer and Method of Use, US Pat., US20230136397A1, 2023 Search PubMed
-
E. P. Kuhl, E. R. Cave and G. Leonard, Reactor With Advanced Architecture For The Electrochemical Reaction Of CO2, CO, And Other Chemical Compounds, US Pat., US20210395908A1, 2021 Search PubMed
-
S. Hunegnaw, A. R. Kashi, K. P. Kuhl, M. George, S. Ma, Z. Huo, E. R. Cave and K. X. Hua, System And Method For Methane Production, US Pat., US20200216968A1, 2020 Search PubMed
- United States Department of Energy, Energy Efficiency and Renewable Energy, Fuel Cell Technologies OfficeMulti-Year Research, Development, and Demonstration Plan Planned program activities for 2011–2020, ch. 3.4: Fuel Cells, https://www.energy.gov/sites/prod/files/2014/12/f19/fcto_myrdd_full_document.pdf.
-
G. Tsotridis and A. Pilenga, EU Harmonised Protocols for Testing of Low Temperature Water Electrolysers, 2021 Search PubMed
- J. R. Varcoe, P. Atanassov, D. R. Dekel, A. M. Herring, M. A. Hickner, P. A. Kohl, A. R. Kucernak, W. E. Mustain, K. Nijmeijer, K. Scott, T. Xu and L. Zhuang, Energy Environ. Sci., 2014, 7, 3135–3191 RSC
- S. G. Ji, H. Kim, W. H. Lee, H. S. Oh and C. H. Choi, J. Mater. Chem. A, 2021, 9, 19834–19839 RSC
- S. Maass, F. Finsterwalder, G. Frank, R. Hartmann and C. Merten, J. Power Sources, 2008, 176, 444–451 CrossRef CAS
- S. Möller, S. Barwe, J. Masa, D. Wintrich, S. Seisel, H. Baltruschat and W. Schuhmann, Angew. Chem., Int. Ed., 2020, 59, 1585–1589 CrossRef
- A. A. Samu, I. Szenti, Á. Kukovecz, B. Endrődi and C. Janáky, Commun. Chem., 2023, 6, 1–9 CrossRef PubMed
- Y. Wu, S. Garg, M. Li, M. N. Idros, Z. Li, R. Lin, J. Chen, G. Wang and T. E. Rufford, J. Power Sources, 2022, 522, 230998 CrossRef CAS
- N. Schwartz, J. Harrington, K. J. Ziegler and P. Cox, ACS Omega, 2022, 7, 29832–29839 CrossRef CAS PubMed
- B. J. M. Etzold, U. Krewer, S. Thiele, A. Dreizler, E. Klemm and T. Turek, Chem. Eng. J., 2021, 424, 130501 CrossRef CAS
- S. A. Grigoriev, P. Millet, S. A. Volobuev and V. N. Fateev, Int. J. Hydrogen Energy, 2009, 34, 4968–4973 CrossRef CAS
-
C. H. Lee, R. Banerjee, F. Arbabi, J. Hinebaugh and A. Bazylak, in ASME 2016 14th International Conference on Nanochannels, Microchannels, and Minichannels (ICNMM2016), American Society of Mechanical Engineers Digital Collection, 2016 Search PubMed
- T. Schuler, R. De Bruycker, T. J. Schmidt and F. N. Büchi, J. Electrochem. Soc., 2019, 166, F270–F281 CrossRef CAS
- T. L. Doan, H. E. Lee, S. S. H. Shah, M. J. Kim, C. H. Kim, H. S. Cho and T. Kim, Int. J. Energy Res., 2021, 45, 14207–14220 CrossRef CAS
- S. Stiber, N. Sata, T. Morawietz, S. A. Ansar, T. Jahnke, J. K. Lee, A. Bazylak, A. Fallisch, A. S. Gago and K. A. Friedrich, Energy Environ. Sci., 2022, 15, 109–122 RSC
- F. J. Pérez-Alonso, C. Adán, S. Rojas, M. A. Peña and J. L. G. Fierro, Int. J. Hydrogen Energy, 2014, 39, 5204–5212 CrossRef
- N. K. Chaudhari, H. Jin, B. Kim and K. Lee, Nanoscale, 2017, 9, 12231–12247 RSC
- J. E. Park, H. J. Choi, S. Y. Kang, G. Y. Jang, O. H. Kim, M. Karuppannan, Y. E. Sung, O. J. Kwon and Y. H. Cho, Int. J. Energy Res., 2022, 46, 16670–16678 CrossRef CAS
- T. Schuler, R. De Bruycker, T. J. Schmidt and F. N. Büchi, J. Electrochem. Soc., 2017, 166, F270 CrossRef
- C. C. L. McCrory, S. Jung, J. C. Peters and T. F. Jaramillo, J. Am. Chem. Soc., 2013, 135, 16977–16987 CrossRef CAS PubMed
- T. Reier, M. Oezaslan and P. Strasser, ACS Catal., 2012, 2, 1765–1772 CrossRef CAS
- K. Jiao, J. Xuan, Q. Du, Z. Bao, B. Xie, B. Wang, Y. Zhao, L. Fan, H. Wang, Z. Hou, S. Huo, N. P. Brandon, Y. Yin and M. D. Guiver, Nature, 2021, 595, 361–369 CrossRef CAS PubMed
- I. Jang, I. Hwang and Y. Tak, Electrochim. Acta, 2013, 90, 148–156 CrossRef CAS
- Y. Wang, C. Zhou, X. Xie, C. Yang, Q. Feng, J. Zou, X. Z. Yuan, J. Fan, L. Zeng, H. Li and H. Wang, Int. J. Hydrogen Energy, 2020, 45, 996–1007 CrossRef CAS
- H. E. Kim, S. Shin and H. Lee, J. Catal., 2021, 395, 404–411 CrossRef CAS
- F. Maillard, A. Bonnefont and F. Micoud, Electrochem. Commun., 2011, 13, 1109–1111 CrossRef CAS
- L. M. Roen, C. H. Paik and T. D. Jarvi, Electrochem. Solid-State Lett., 2004, 7, A19 CrossRef CAS
- J. Willsau and J. Heitbaum, J. Electroanal. Chem. Interfacial Electrochem., 1984, 161, 93–101 CrossRef CAS
- B. Zhang, N. Wang, T. Dwi Widodo, R. Raharjo, R. Bintarto, Q. Liang, G. Brocks and A. Bieberle-Hütter, J. Phys.: Energy, 2021, 3, 026001 Search PubMed
- D. Salvatore and C. P. Berlinguette, ACS Energy Lett., 2020, 5, 215–220 CrossRef CAS
- Q. Xu, S. Z. Oener, G. Lindquist, H. Jiang, C. Li and S. W. Boettcher, ACS Energy Lett., 2021, 6, 2238–2239 CrossRef CAS
- R. Küngas, P. Blennow, T. Heiredal-Clausen, T. Holt, J. Rass-Hansen, S. Primdahl and J. B. Hansen, ECS Trans., 2017, 78, 2879–2884 CrossRef
-
R. Gilliam, T. A. Albrecht, N. Jalani, N. A. Knott, V. Decker, M. Kostowsky, B. Boggs, A. Gorer and K. Farsad, Electrochemical System And Method For CO2 Utilization, 2007
-
C. W. Oloman and A. P. Watkinson, Electrochemical System And Method For CO2 Utilization, Electrolytic Production Of Alkaline Peroxide Solutions, US Pat., US3969201, 1976 Search PubMed
- J. J. Kaczur, H. Yang, Z. Liu, S. D. Sajjad and R. I. Masel, Front. Chem., 2018, 6, 377597 Search PubMed
-
G. Schmid, N. Martic, R. Krause, C. Reller, H. Eckert, K. Wiesner-Fleischer, H. Neubert, S. Energy, T. Haas, M. Demmler, L. Reinicke and A. Hecker, The Rheticus Project (Technical/Artificial Photosynthesis) Renewable Synthesis of chemical Feedstock and Specialties employing Electrolysis & Syngas Fermentation, Surfcat, Surfcat Summer School: The Science of Sustainable Fuels and Chemicals, Gilleleje, Denmark, 2022 Search PubMed
Footnotes |
| † Electronic supplementary information (ESI) available. See DOI: https://doi.org/10.1039/d4se00594e |
| ‡ J. Ferrell and M. Rasmussen contributed equally to this work. |
| This journal is © The Royal Society of Chemistry 2024 |