 Open Access Article
Creative Commons Attribution 3.0 Unported Licence
Spectroscopic investigation of size-dependent CO2 binding on cationic copper clusters: analysis of the CO2 asymmetric stretch†
A. M.
Reider
 a,
M.
Szalay
bc,
J.
Reichegger
 a,
J.
Barabás‡
 b,
M.
Schmidt
 a,
M.
Kappe
 a,
T.
Höltzl
 *bc,
P.
Scheier
 a and
O. V.
Lushchikova
 *a
*a
aInstitut für Ionenphysik und Angewandte Physik, Universität Innsbruck, Technikerstraße 25, Innsbruck 6020, Austria. E-mail: olga.lushchikova@uibk.ac.at
bHUN-REN-BME Computation Driven Chemistry Research Group, Department of Inorganic and Analytical Chemistry, Budapest University of Technology and Economics, Muegyetem rkp. 3, Budapest 1111, Hungary
cFurukawa Electric Institute of Technology, Késmárk Utca 28/A, Budapest 1158, Hungary
First published on 12th July 2024
Abstract
Photofragmentation spectroscopy, combined with quantum chemical computations, was employed to investigate the position of the asymmetric CO2 stretch in cold, He-tagged Cun[CO2]+ (n = 1–10) and Cun[CO2][H2O]+ (n = 1–7) complexes. A blue shift in the band position was observed compared to the free CO2 molecule for Cun[CO2]+ complexes. Furthermore, this shift was found to exhibit a notable dependence on cluster size, progressively redshifting with increasing cluster size. The computations revealed that the CO2 binding energy is the highest for Cu+ and continuously decreases with increasing cluster size. This dependency could be explained by highlighting the role of polarization in electronic structure, according to energy decomposition analysis. The introduction of water to this complex amplified the redshift of the asymmetric stretch, showing a similar dependency on the cluster size as observed for Cun[CO2]+ complexes.
Introduction
The increasing concentration of atmospheric carbon dioxide has become a pressing global concern due to its implications for climate change and environmental sustainability. However, its conversion into valuable chemicals remains a challenging process characterized by low CO2 conversion rates, poor selectivity, and high energy costs.1,2One of the most promising pathways for CO2 utilization is its conversion to methanol. Behrens et al. demonstrated that Cu nanoparticles serve as the active sites in the widely used industrial Cu/ZnO/Al2O3 catalyst, which has been on the market for over six decades.3 Recent reviews corroborate that Cu-based catalysts continue to show the greatest promise.4,5 The emergence of small sub-nanometer-sized metal clusters exhibit a high potential in sustainable CO2 conversion reactions due to their high number of uncoordinated sites and distinctive electronic and geometric properties, which can facilitate the activation and transformation of CO2 molecules.6 Over the past decade, copper clusters have attracted considerable attention for their potential to convert CO2 to methanol at lower temperatures and pressures compared to conventional catalysts.7–12
It is widely acknowledged that the size of a cluster can significantly influence its catalytic properties, potentially enhancing the activity of the catalyst. The active sites of catalysts can be imitated by gas-phase clusters to investigate the exact reaction mechanisms to obtain detailed knowledge of this phenomenon.13 Gas-phase studies offer the advantage of examining the interaction between CO2 and a cluster under well-controlled conditions. Over the years, substantial knowledge has been accumulated regarding the interaction between gas-phase ions and CO2, as comprehensively summarized by H. Schwarz.14
Spectroscopic studies, in particular, provide detailed information about the vibrational properties of adsorbed molecules, shedding light on the nature of the adsorption process and the strength of the metal–ligand bonds. Several research groups have employed IR photodissociation spectroscopy techniques, such as eliminating one or more intact CO2 molecules or employing Ar tagging for tightly bound complexes. Notably, Weber15–25 and his co-workers extensively explored the interaction of single metal anions with multiple CO2 molecules, while the groups of Duncan,26–32 Mackenzie,33,34 and Jiang35–38 focused on cations and their oxides. Their works cover the interactions of CO2 with most transition metal ions and beyond. Recently, the group of Beyer has published spectroscopic studies on the activation of CO2 by hydrated metal cations (Mg+ and Co+)39,40 and anions (NbO3−)41 solvated in water, revealing that a higher water load can lead to the activation of CO2 inducing charge transfer from the metal center to CO2.
Other spectroscopic investigations focusing mainly on the interactions of metal clusters with only a few CO2 molecules attached employed infrared multiphoton dissociation (IRMPD) spectroscopy with the free-electron lasers (FEL) at the Fritz Haber Institute (FHI) in Berlin, Germany, and at FELIX in Nijmegen, the Netherlands. While at the FHI the focus was more on anionic clusters (Ptn− and Con−),42,43 the research at FELIX was mostly leaning towards cationic clusters (Cun+ and MgnOm+),44,45 with the exception of CCun−.46 In addition, the activation of H2O and CO2 by NbO3− clusters was investigated at FELIX.41 Remarkably, all investigated anionic metal clusters exhibited pronounced size-dependent activation and dissociation of CO2.42,43,46
While it is evident that anions exhibit greater activity in CO2 dissociation due to their ability to donate an electron to the anti-bonding orbitals of CO2, surface studies highlight the crucial role of Cu particles with a positive partial charge in methanol synthesis.11,47,48 These particles stabilize reaction intermediates, promote hydrogenation reactions by facilitating the adsorption and activation of hydrogen molecules, and exhibit enhanced catalytic activity. This underscores the importance of understanding the reaction mechanism over positively charged metal particles. The research of Bakker's group, conducted at FELIX, delved into the elementary steps of methanol formation utilizing cationic Cu clusters, including hydrogenation of the clusters49 and CO2 and H2 co-adsorption.44 Those studies revealed that some cluster sizes have the capability to dissociate H2, and the co-adsorption studies suggest the formation of intermediates leading to the subsequent formation of formate—a critical step in methanol synthesis. Intriguingly, the reaction of bare cationic Cu clusters with CO2 revealed that clusters ranging from 7 to 25 Cu atoms physisorbed CO2 uniformly in monodentate (η1-O) fashion, regardless of the cluster size, as evidenced by absorption bands measured close to those of free CO2 and calculations.44
The measurements described above do not really capture the strongest fundamental vibration of CO2, the asymmetric stretch (ν3), since they were limited by the frequency capabilities of the FEL for intracavity experiments (FELICE) used for those studies, which is 100–2100 cm−1. The asymmetric stretch is only captured by the second harmonics of IR-light at 1185 cm−1, halving the frequency, and consequently reducing intensity to approximately 1%.44
In this work we employ photodissociation spectroscopy of He-tagged Cun[CO2]m+ complexes, facilitated by a table-top OPO laser, to investigate the strongest vibration of CO2, the asymmetric stretch. He-tagged ions are generated and extracted from multiply-charged superfluid He nanodroplets (HNDs).50 The narrower spectral bandwidth of the OPO laser compared to that of FELICE, lower dissociation energy of He compared to CO2 (<0.04 eV vs. >0.26 eV) and low temperature of the formed complexes (<1 K) contribute to the narrower bandwidth, making it possible to investigate the exact position of the ν3 band, which is expected around 2350 cm−1, according to both studies at FELIX44 and data obtained for free CO2.51
Previously, HNDs were already utilized to study the reactions of neutral metal–CO2 complexes. This method employs optically selected mass spectrometry with a narrow bandwidth laser, resulting in high-resolution IR spectra. It was observed that both studied metal atoms, Al and Mn, form two isomers with CO2. This conclusion was based on the presence of two bands around 2280 cm−1, assigned to the different asymmetric stretches of different isomers. The CO2 was found bound to the metal atom in either a monodentate or T-shaped configuration.52
By employing IR spectroscopy of He-tagged ions coupled with theoretical calculations, we systematically investigate the influence of cluster size and hydration on the binding motifs of CO2 characterized by the changes in the asymmetric stretch mode. This approach allows discerning size-dependent trends in CO2 adsorption on copper clusters, the effect of the additional water attachment, and correlating these to the changes in the binding energies. It sheds light on the underlying mechanisms governing the interaction between CO2 molecules and metal clusters.
The narrow bandwidth allows for tracking the shift of the ν3 band as a function of cluster size, which had not been observed previously. In earlier measurements, all investigated cluster sizes (n = 4–25) exhibited identical behavior, with all bands at the same position.44 High-level calculations accurately predicted this red shift and found a strong correlation with the reaction energy and polarization. The current work also includes clusters ranging in size from one to three atoms and investigates the influence of hydration on the interaction with CO2, areas that had not been studied before. The results show that the monoatomic Cu cation has the highest reaction energy with CO2, which decreases with increasing cluster size in both pristine and hydrated clusters.
Methods
Experimental
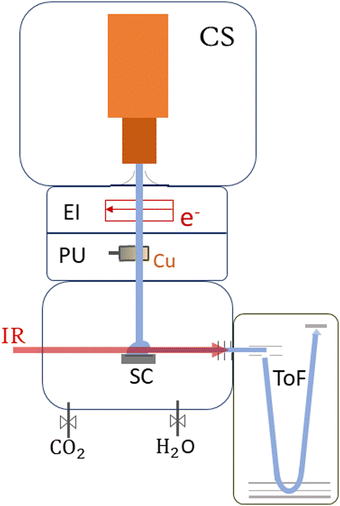
This section provides an overview of the setup of ClusTOF, adapted to the presented experiment. More detailed insights into the formation, ionization and doping processes of superfluid helium droplets in the apparatus are given in the literature.53,54The experimental process, see Fig. 1, is initiated by the formation of HNDs, several 105 helium atoms,55 when pre-cooled (9.4–9.7 K) and pressurized (20–22 bar, purity 99.9999%, Messer) helium is expanded through a pinhole nozzle, with the diameter around 5 μm, into the ultra-high vacuum. The temperature and pressure of the helium as well as the current and energy of the ionizing electron beam are finely controlled to ultimately optimize the ion yield of helium-tagged Cun[CO2]+ or Cun[CO2][H2O]+ clusters. The HNDs are ionized via electron impact to create multiply-charged droplets, resulting in this experiment in a charge state around +10e.56 In two consecutive, differentially pumped vacuum chambers, the droplets then pick up any species brought into the gas phase, explicitly copper atoms (isotopically enriched 63Cu, isotope Rosatom 99.8% purity; evaporated in a home-built, resistively heated ceramic oven), CO2 (isotopically enriched 13C16O2, Sigma Aldrich purity 99.0%) and H2O (both introduced via separate gas inlets with needle valves). This pickup of dopants in combination with charge transfer from Hen+ ionic cores leads to the formation of singly-charged dopant ions57 and attachment of further dopants results in cluster ions58 in the form of Cun[CO2]m+ and Cun[CO2]m[H2O]k+. The temperature of the oven as well as the partial pressures of water and carbon dioxide are tuned to optimize the ion yield of copper cluster ions complexed with one CO2 or one CO2 plus one H2O molecule. The charged droplets then collide with a surface,59 liberating cold, helium-tagged ions, which are analyzed using a time-of-flight mass spectrometer combined with infrared IR photon absorption from a tunable OPO laser (EKSPLA NT277, linewidth ∼8 cm−1). In this form of action spectroscopy, the absorption of a photon leads to the loss of He atoms and enables the determination of absorption spectra via the increase of the photoproducts.50 The mass spectrometer runs at a 10 kHz extraction rate, while the laser operates at 1 kHz. This ensures that every tenth extraction pulse coincides with laser illumination, facilitating side-by-side comparison of mass spectra with and without laser interaction. Absorption of a resonant photon leads to evaporation of the weakly bound He tags, observed in the mass spectrum as a depletion of the Cun[CO2]m[He]x+ ion signal and the simultaneous increase of the photoproduct, the bare Cun[CO2]m+ ion. The resulting ion yield is then defined as the ratio of the signal of the bare ion with and without laser exposure. All spectral results are corrected for background noise by subtracting the signal of IR-inactive ions from the IR-active ions at each ToF extraction. No power correction has been employed since it remains flat in the region where the complexes absorb the radiation. The laser power at each scanned wavelength can be found in Fig. S1 in the ESI.†
Computational
Density functional computations were carried out using the Q-Chem 6.1 program package60 to recompute previously reported most stable Cun+ (n = 1–14) cluster geometries.61,62 Here the pre-screened possible reaction products, both with intact CO2 (Cun[CO2]+); with intact CO2 and intact H2O (Cun[CO2][H2O]+); and with intact CO2 and H2O, dissociated to H and OH (Cun[CO2][H][OH]+) are reported using the PBE/LANL2DZ level of theory.The in-house code is utilized to systematically generate the initial geometries for different binding modes, similar to that in our previous works.46,63,64 The CO2 is bound to the Cun+ (n = 1–14) clusters in mono-(η1-O) or bidentate (η2-C, O) modes. H2O is bound to the most stable Cun[CO2]+ structures for n = 1–10. The monodentate mode (η1-H) was selected for intact H2O, while H was bound in bridge mode over adjacent coppers, or over a three-membered copper ring, and OH was bound in bridge mode over adjacent copper atoms or was bound to a single copper, as the water molecule may dissociate on copper clusters.65,66 Please note that the goal is not to locate the global minimum structures, but rather to locate the possible products, accessible by the addition of the reactants to the cluster. All isomers are relaxed and calculated with the lowest spin state (i.e. singlet or doublet for structures having an even or odd number of electrons, respectively).
Final geometry optimizations and vibrational frequency computations are performed using the (U)TPSSh/def2-TZVP+D3 level of theory. This method has been used previously for similar systems and yielded accurate results compared both to computational benchmarks (up to CCSD(T)/def2-QZVPPD) and to experimental results.44,46,67 After the final optimization, the energetic order of the different isomers remained the same as in the pre-screening. The harmonic frequency computations reported in the main text were completed using isotopically pure 13C.
The impact of the correlation, basis sets, dispersion correction, relativity and anharmonicity on the computed vibrational spectrum is carefully benchmarked to ensure the most accurate results. The results of benchmarking are shown in Fig. S2 of the ESI.† Anharmonicity calculations shown in Tables S1 and S2 (ESI†) for Cun[CO2]+, with n = 0, suggest a scaling factor of 0.98, which is subsequently applied to the results presented in the text. It is worth noting, however, that benchmarking is done for CO2 with the 12C isotope, while frequencies used for the comparison with the experimental data were corrected for the 13C isotope. Binding energies are determined by calculating the difference between the total energy of the complex and the sum of the individual gas phase reactants namely Cun+, CO2, and intact H2O.
Results and discussion
Spectroscopic investigation
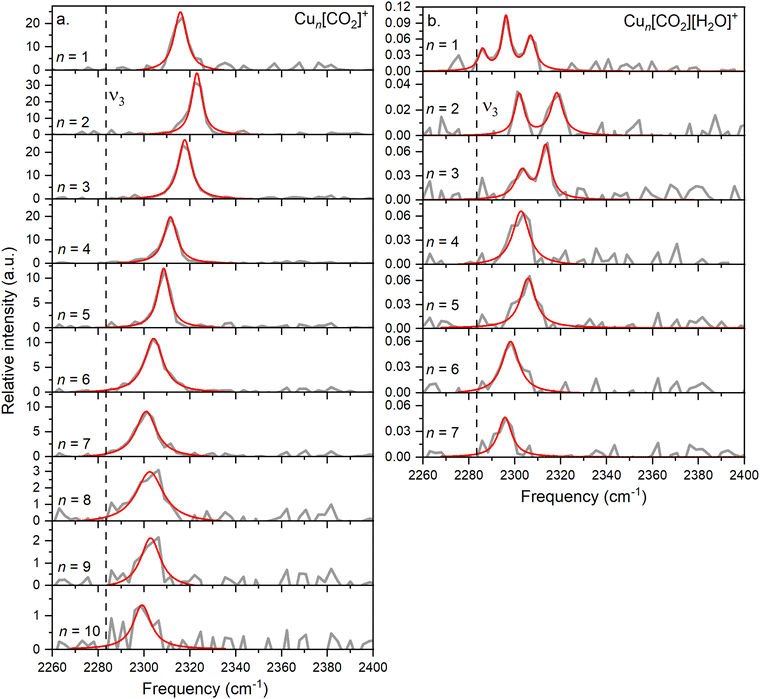
In this study, we investigate He-tagged Cun[CO2]+ complexes (n = 1–10) formed within helium nanodroplets (HNDs) using photodissociation spectroscopy. Upon photon absorption, the weakly bound helium atoms evaporate, leading to an increase in the ion intensity of the naked complex. To ensure sufficient helium attachment, over 50 helium atoms were attached to each complex, subsequently decaying into the naked complex. The resulting spectra are presented in Fig. 2a.Based on previous measurements, it is anticipated that CO2 will be physisorbed onto the cationic Cu cluster ions.44 Consequently, the asymmetric stretch vibration is expected to closely mirror that of free 13CO2, which has been determined via IR spectroscopy in a gaseous phase at 2283.48 cm−1, a reference point we will utilize throughout this text.51 It is important to note that this experiment was conducted using isotopically enriched CO2, with 13C, rather than the naturally more abundant one with 12C, which would exhibit its asymmetric stretch at 2349.16 cm−1.51 This isotope was chosen to eliminate possible overlapping of the He-tagging series with the Cun[CO2]+ series in the mass spectrum. The current experiment on the complexes with n = 1–10 exhibits a blue shift of at least 15 cm−1 compared to the vibration of free CO2, falling within the range of 2290–2330 cm−1 with an average full width at half maximum (FWHM) of 9 cm−1. The signal-to-noise ratio (S/N) decreases with increasing cluster size due to reduced helium attachment for larger clusters, as illustrated in the mass spectrum shown in Fig. S3 (ESI†).
When comparing the interaction of the Cu+ monomer with CO2 (with the ν3 band at 2316 cm−1) to monomers of other previously studied metals, first a correction for the heavier isotope of CO2 must be made. The reduced mass for naturally abundant 12CO2 and 63Cu is 25.9, while for the heavier 13CO2 isotope, it is 26.25. Therefore, to compare the results with other experiments, the experimentally obtained frequency is multiplied by a factor of 1.014, resulting in a frequency of 2347 cm−1.
Most metal and metal oxide ions investigated to date (including Ni, Si, Ti, Fe, Mg, Co, Rh, Ir, Al, NbO, and TaO) exhibit a band between 2265 and 2385 cm−1, which is blue-shifted relative to the asymmetric stretch of free CO2, similarly to the one found in the current experiment.27–31,33,34,68 When these ions are further solvated with CO2 molecules, this band generally shifts further towards the red, closer to the vibrational frequency of free CO2, indicating a lower binding energy of subsequent CO2 molecules. It's noteworthy that for most of these metals, no data on complexes with only one CO2 molecule is reported, hence the band position of two CO2 is utilized. Additionally, Ar is used as a tag, as the dissociation of CO2 requires higher energy, leading to significant band broadening.27
Other metals such as Ca, Sr, Ba exhibit a band around 2245 cm−1.69 For all these alkaline earth metals, it has been observed that the first CO2 molecule is weakly bound in an η1 configuration dominated by charge–quadrupole interaction. However, further solvation leads to the blue shift of ν3 by at least 10 cm−1. From the calculations it becomes evident that the second CO2 binds in a bidentate manner due to the transfer of positive charge to the metal core, rendering CO2 electronegative and stimulating its activation. A similar effect has also been noted for the solvation of metal–CO2 complexes in water.40,41
In the current study, the primary focus lies on cluster size rather than solvation effects. The position of the ν3 band exhibits a correlation with cluster size, progressively approaching that of free CO2 as the cluster size increases, which was not observed before. Drawing an analogy with previous experiments involving ion solvation in multiple CO2 molecules, a similar trend is observed, indicating a decrease in reaction energy.
A similar behavior of the CO2 asymmetric stretch is observed when H2O is co-adsorbed on the cluster. However, it is further redshifted compared to the ν3 band of Cun[CO2]+ complexes, as can be seen in Fig. 2b.
A triple band is observed for n = 1, which might result from the low S/N. However, based on the width of the peaks and their height, it is highly unlikely that they originate from a single band, as this feature would be much broader than the corresponding bands in the other cluster sizes. Similarly, the spectra for n = 2 and n = 3 exhibit two bands.
Computational results
For a comprehensive understanding of the investigated complexes, the lowest energy isomers of bare Cun+ were explored computationally, along with the corresponding lowest energy Cun[CO2]+, Cun[CO2][H2O]+ and Cun[CO2][H][OH]+ adducts. The resulting structures are depicted in Fig. 3.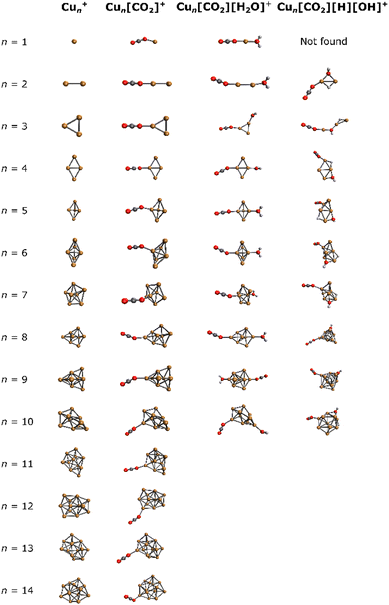 | ||
| Fig. 3 Lowest energy isomers for Cun+, Cun[CO2]+, Cun[CO2][H2O]+, and Cun[CO2][H][OH]+ in the studied binding modes. | ||
In all Cun[CO2]+ adducts, the CO2 molecule binds in an η1 configuration with one oxygen to one of the copper atoms at the cluster edge. This binding mode, together with the previous results,44,46,67 suggests a barrierless reaction of CO2 with the cluster. Upon addition of water, cluster backbone rearrangement was observed only in the case of n = 9. However, following H2O dissociation, significant cluster geometry changes were observed in almost all cases (except for n = 2, 4, 6), indicating a multi-step reaction mechanism. Notably, for n = 1, no structure with dissociated H2O was found among the selected binding modes.
Fig. 4a illustrates the binding energies of the aforementioned structures. In all cases, both CO2 and subsequent water adsorption are thermodynamically favorable. However, during the water dissociation, significant stabilization was observed only in the case of n = 5, 9 and 10, suggesting that water dissociation is less probable for other cluster sizes.
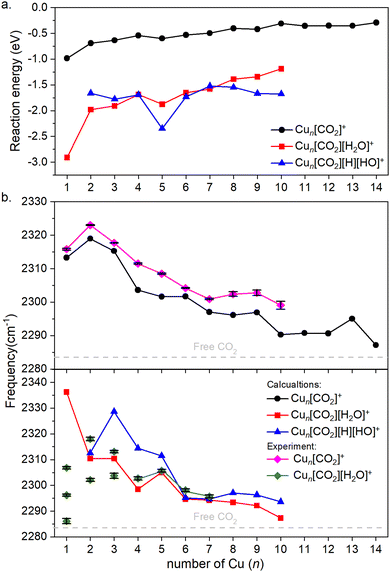 | ||
| Fig. 4 (a) Binding energies of the cluster adducts depicted on Fig. 3. (b) Top: Frequencies of the asymmetric stretching vibrational mode of the bound CO2 on corresponding adducts are depicted. Bottom: The frequency of the same vibration, when water is co-adsorbed. The diamonds denote the experimental results, which include error bars. Note that the error bars are often smaller than the symbols; therefore, a black color is used to represent them. Additionally, for Cun[CO2][H2O]+, for n = 1–3 the symbols are not connected, since it is not clear which of them might originate from the ν3 vibration. The dashed grey line represents the vibration of free CO2. | ||
For both the CO2 adsorption and its co-adsorption with water, the CO2 binding becomes less favored with increasing cluster size. This trend is also reflected in the frequencies of the asymmetric stretching vibrational mode of adsorbed CO2, which converge toward that of free CO2, as shown in Fig. 4b.
The overall trend is in good agreement with the calculations, as evidenced by recognizable dips at n = 1, 4, and 7 for both experimental data and theoretical predictions for Cun[CO2]+ in the top of Fig. 4b. However, discrepancies arise when comparing co-adsorption with water in the bottom of Fig. 4b: while the calculations suggest no double or triple peaks, they are experimentally observed for n = 1–3. Notably, the peak with the highest measured frequency for n = 1 is almost 40 cm−1 lower, than what was calculated for Cu[CO2][H2O]+. For n = 2, the calculated asymmetric CO2 stretching frequency in Cu2[CO2][H2O]+ and Cu2[CO2][H][OH]+ are remarkably similar to each other as well as to the average of the two measured peaks. In contrast, for n = 3, the calculated frequencies for intact and dissociated water are 20 cm−1 apart, with the frequency of Cu3[CO2][H2O]+ falling between the experimentally determined peaks. All following cluster sizes exhibit only one band, which is in good agreement with the calculations.
According to the computations, the shift in the asymmetric stretch vibrational frequency of the bound CO2 due to the H2O adsorption is generally low, although somewhat larger in smaller sizes (n = 1–4), since CO2 and H2O are bound to the same (n = 1) or adjacent copper atoms (n = 2–4). A good correlation between the vibrational frequencies and the binding energies for Cun[CO2]+ (R2 = 0.743) and Cun[CO2][H2O]+ (R2 = 0.963) is observed as evident from Fig. S4 (ESI†). However, it is much lower for Cun[CO2][H][OH]+, with R2 = 0.141. Accordingly, in the case of Cun[CO2][H2O]+ the binding energy is significantly more negative for n = 1, thus the CO2 asymmetric stretching vibrational frequency is considerably increased in the next largest cluster.
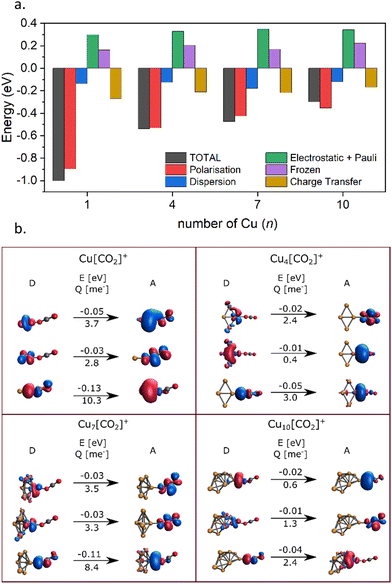
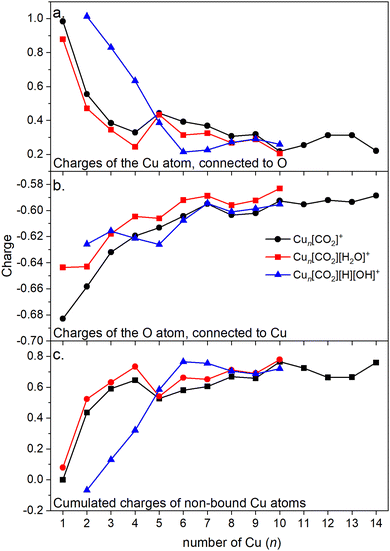
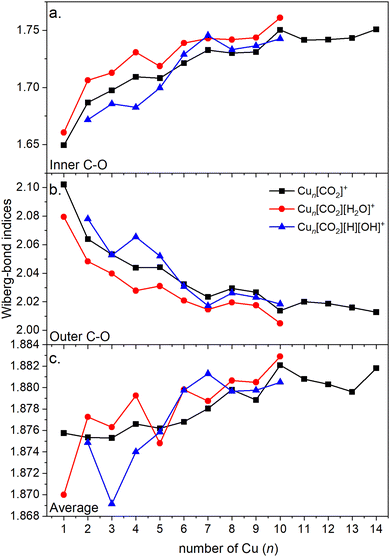
Energy decomposition analysis (EDA) was performed for several cluster sizes to gain a better understanding of the molecular interactions and rationalize the reactivity of the clusters. The aim of the EDA is to decompose the interaction energy between two fragments (in this case, the Cun+ clusters and CO2) with an adduct into chemically meaningful terms. The EDA based on absolutely localized molecular orbitals (ALMO-EDA) is employed, where ALMOs are localized on each fragment facilitating a detailed analysis of intermolecular interactions.70 ALMO-EDA decomposes the total interaction energy (here, binding energy) into frozen terms encompassing electrostatic interaction, Pauli repulsion, and dispersion interaction between the fragments, along with polarization, charge transfer and relaxation terms. The charge transfer energy can be further decomposed exactly to contributions from complementary occupied-virtual pairs (COVPs), wherein each orbital pair member resides on one of the fragments. Consequently, COVPs visually highlight the most significant orbitals involved in charge transfer. These analyses are illustrated in Fig. 5. Fig. 5a shows the EDA, without the relaxation energies, because these values are practically zero (around 0.01 eV), as expected since no significant geometry changes occur in the fragments due to the CO2 adsorption on the clusters. Polarization in the fragments is the main term in the binding energies, which is strongly decreasing with the cluster size. Charge transfer (CT) follows the same trend, although with a significantly lower magnitude. Fig. 5b shows the main complementary occupied-virtual pairs (COVP) based on the values of the energy transfer. Donation from the clusters’ dz2 and dzx orbitals to the LUMO of CO2 weakens the carbon–oxygen bond. Additionally, back donation occurs, where the lone electron pair of the oxygen atom in CO2 donates electron density to the formally unoccupied 4p orbital of the copper atoms, albeit with a somewhat lesser contribution. However, it's crucial to note that low values of both donation and back-donation indicate a lesser significance of the charge transfer process compared to the polarization. The approximately equal values of charge transfer contribute to the charge neutrality of the bound CO2, with a total charge of around ∼0.02. On the contrary, polarization exerts a more noticeable effect. Fig. 6a and b show the natural charges of the connected Cu and O atoms, while Fig. 6c shows the total charge of the remaining copper atoms in the cluster. Additionally, charges of C and outside O can be found in Fig. S5 (ESI†). The two fragments, namely the CO2 molecule and the Cun+ cluster, exert a mutual polarization effect. This results in the connecting oxygen atom of the CO2 molecule accumulating a more negative charge (by the electron transfer from the other oxygen atom), while the connecting copper atom in the cluster experiences a corresponding increase in positive charge compared to the other copper atoms in the cluster. This effect diminishes with increasing cluster size, as can be seen from Fig. 6a and b, as charges can be more readily redistributed across larger clusters (see Fig. 6c). Consequently, a less pronounced positive charge can be attained on the copper atom connected to the CO2. While bond indices (Fig. 7) between the C and inner O are increasing with the cluster size, those between the C and the outer O are decreasing almost to the same extent. The increased Oinner–C and the decreased Oouter–C bond orders are in line with the polarization effects, shown already by the energy decomposition analysis, while the slightly decreased average O–C bond orders suggest the effect of a small charge transfer. Interestingly, the cluster size-dependent asymmetric stretch vibrational frequency correlates with both the increased and the decreased C–O bond indices, and also with their average, as can be seen in Fig. S6 (ESI†). As the asymmetric stretch involves both C–O bonds and the distance between the inner oxygen and the connecting copper atom also changes, all these together determine the corresponding vibrational frequency. According to our computations, the asymmetric vibrational stretch frequency correlates with the CO2 binding energy, which according to the EDA is determined mainly by polarization.
Conclusion
In conclusion, our spectroscopic investigation of He-tagged Cun[CO2]+ and Cun[CO2][H2O]+ complexes within helium nanodroplets has provided valuable insights into the interaction between metal clusters and CO2 molecules. Through photodissociation spectroscopy, we observed a blue shift in the asymmetric stretch vibration of CO2 compared to gas phase CO2, with this shift diminishing as cluster size increases. This trend indicates a reduction in binding energy with increasing cluster size, a result supported by a computational analysis. Further computational examinations provided detailed insights into the binding energies and structural alterations upon the adsorption of CO2 and water. The energy decomposition analysis underscored the significance of polarization over charge transfer in cluster–CO2 interactions. Collectively, our findings highlight the intricate interplay among cluster size, molecular structure, and reactivity, offering promising avenues for the rational design of catalytic systems centered around metal clusters.Author contributions
A. M. Reider: investigation, visualization, writing – original draft preparation. M. Szalay: investigation, formal analysis, writing – original draft preparation, visualization. J. Reichegger: investigation, formal analysis, visualization, writing – review & editing. J. Barabas: investigation, formal analysis. M. Schmidt: investigation. M. Kappe: investigation, methodology. P. Scheier: conceptualization, funding acquisition, resources, methodology, conceptualization, software, writing – review & editing. T. Höltzl: conceptualization, investigation, formal analysis, visualization, writing – original draft preparation, review & editing. O. V. Lushchikova: conceptualization, data curation, funding acquisition, investigation, project administration, supervision, visualization, writing – original draft preparation.Data availability
The data discussed in the manuscript is available at: https://doi.org/10.5281/zenodo.11578007. This repository contains the raw data for the spectroscopic measurements of Cun[CO2]+ (n = 1–10) and Cun[CO2][H2O]+ (n = 1–7) complexes, along with laser power scans. An Excel file is included, summarizing the measurements and the most important experimental parameters. Additionally, we provide the Python script used to extract the IR spectra for the individual cluster sizes, and the Origin file containing the data after laser power corrections, averaging, and the figures used in the original manuscript and the ESI.†Conflicts of interest
There are no conflicts to declare.Acknowledgements
We are grateful to the Austrian Science Fund, FWF (grant number P34563, W1259 DK-ALM, and M3229-N) for funding the experimental part of this research and providing open access funding. O. V. Lushchikova was supported via the K-Regio project SupremeByNano. The computational part of the project was supported by the European Union's Horizon 2020 research and innovation programme under the Marie Sklodowska-Curie grant agreement no. 955650 (CatCHy). T. Höltzl is grateful for the János Bolyai Research Scholarship of the Hungarian Academy of Sciences (grant number BO/00642/21/7). Project no. KDP-IKT-2023-900-I1-00000957/0000003 has been implemented with the support provided by the Ministry of Culture and Innovation of Hungary from the National Research, Development and Innovation Fund, financed under the KDP-2023 funding scheme. This article is based upon work from the COST Actions CA21101 – Confined Molecular Systems: From a New Generation of Materials to the Stars (COSY), supported by COST (European Cooperation in Science and Technology).References
- P. Friedlingstein,
et al.
, Earth Syst. Sci. Data, 2022, 14, 1917–2005 CrossRef
.
- S. De, A. Dokania, A. Ramirez and J. Gascon, ACS Catal., 2020, 10, 14147–14185 CrossRef CAS
.
- M. Behrens,
et al.
, Science, 2012, 336, 893–897 CrossRef CAS PubMed
.
- J. Zhao, S. Xue, J. Barber, Y. W. Zhou, J. Meng and X. B. Ke, J. Mater. Chem. A, 2020, 8, 4700–4734 RSC
.
- J. T. Niu, H. Y. Liu, Y. Jin, B. G. Fan, W. J. Qi and J. Y. Ran, Int. J. Hydrogen Energy, 2022, 47, 9183–9200 CrossRef CAS
.
- A. Halder, L. A. Curtiss, A. Fortunelli and S. Vajda, J. Chem. Phys., 2018, 148, 110901 CrossRef PubMed
.
- Q. Y. Fan, Y. Wang and J. Cheng, J. Phys. Chem. Lett., 2021, 12, 3891–3897 CrossRef CAS PubMed
.
- S. K. Iyemperumal and N. A. Deskins, Phys. Chem. Chem. Phys., 2017, 19, 28788–28807 RSC
.
- C. Liu, B. Yang, E. Tyo, S. Seifert, J. DeBartolo, B. von Issendorff, P. Zapol, S. Vajda and L. A. Curtiss, J. Am. Chem. Soc., 2015, 137, 8676–8679 CrossRef CAS PubMed
.
- Y. Yang, J. Evans, J. A. Rodriguez, M. G. White and P. Liu, Phys. Chem. Chem. Phys., 2010, 12, 9909–9917 RSC
.
- B. Yang, C. Liu, A. Halder, E. C. Tyo, A. B. F. Martinson, S. Seifer, P. Zapol, L. A. Curtiss and S. Vajda, J. Phys. Chem. C, 2017, 121, 10406–10412 CrossRef CAS
.
- X. Zhang, J. X. Liu, B. Zijlstra, I. A. W. Filot, Z. Y. Zhou, S. G. Sun and E. J. M. Hensen, Nano Energy, 2018, 43, 200–209 CrossRef CAS
.
- S. M. Lang and T. M. Bernhardt, Phys. Chem. Chem. Phys., 2012, 14, 9255–9269 RSC
.
- H. Schwarz, Coord. Chem. Rev., 2017, 334, 112–123 CrossRef CAS
.
- J. M. Weber, Int. Rev. Phys. Chem., 2014, 33, 489–519 Search PubMed
.
- L. G. Dodson, M. C. Thompson and J. M. Weber, Annu. Rev. Phys. Chem., 2018, 69, 231–252 CrossRef CAS PubMed
.
- B. J. Knurr and J. M. Weber, J. Am. Chem. Soc., 2012, 134, 18804–18808 CrossRef CAS PubMed
.
- B. J. Knurr and J. M. Weber, J. Phys. Chem. A, 2013, 117, 10764–10771 CrossRef CAS PubMed
.
- B. J. Knurr and J. M. Weber, J. Phys. Chem. A, 2014, 118, 10246–10251 CrossRef CAS PubMed
.
- B. J. Knurr and J. M. Weber, J. Phys. Chem. A, 2014, 118, 4056–4062 CrossRef CAS PubMed
.
- B. J. Knurr and J. M. Weber, J. Phys. Chem. A, 2014, 118, 8753–8757 CrossRef CAS PubMed
.
- M. C. Thompson, J. Ramsay and J. M. Weber, Angew. Chem., Int. Ed., 2016, 55, 15171–15174 CrossRef CAS PubMed
.
- M. C. Thompson, L. G. Dodson and J. M. Weber, J. Phys. Chem. A, 2017, 121, 4132–4138 CrossRef CAS PubMed
.
- M. C. Thompson, J. Ramsay and J. M. Weber, J. Phys. Chem. A, 2017, 121, 7534–7542 CrossRef CAS PubMed
.
- L. G. Dodson, M. C. Thompson and J. M. Weber, J. Phys. Chem. A, 2018, 122, 2983–2991 CrossRef CAS PubMed
.
- N. R. Walker, R. S. Walters and M. A. Duncan, New J. Chem., 2005, 29, 1495–1503 RSC
.
- G. Gregoire and M. Duncan, J. Chem. Phys., 2002, 117, 2120–2130 CrossRef CAS
.
- R. Walters, N. Brinkmann, H. Schaefer and M. Duncan, J. Phys. Chem. A, 2003, 107, 7396–7405 CrossRef CAS
.
- G. Gregoire, N. Brinkmann, D. Van Heijnsbergen, H. Schaefer and M. Duncan, J. Phys. Chem. A, 2003, 107, 218–227 CrossRef CAS
.
- N. Walker, R. Walters, G. Grieves and M. Duncan, J. Chem. Phys., 2004, 121, 10498–10507 CrossRef CAS PubMed
.
- J. Jaeger, T. Jaeger, N. Brinkmann, H. Schaefer and M. Duncan, Can. J. Chem., 2004, 82, 934–946 CrossRef CAS
.
- A. M. Ricks, A. D. Brathwaite and M. A. Duncan, J. Phys. Chem. A, 2013, 117, 11490–11498 CrossRef CAS PubMed
.
- A. Iskra, A. S. Gentleman, A. Kartouzian, M. J. Kent, A. P. Sharp and S. R. Mackenzie, J. Phys. Chem. A, 2017, 121, 133–140 CrossRef CAS PubMed
.
- A. Iskra, A. S. Gentleman, E. M. Cunningham and S. R. Mackenzie, Int. J. Mass Spectrom., 2019, 435, 93–100 CrossRef CAS
.
- Z. Zhao, X. Kong, D. Yang, Q. Yuan, H. Xie, H. Fan, J. Zhao and L. Jiang, J. Phys. Chem. A, 2017, 121, 3220–3226 CrossRef CAS PubMed
.
- D. Yang,
et al.
, Chin. J. Chem. Phys., 2020, 33, 160–166 CrossRef CAS
.
- Z. Zhao, X. Kong, Q. Yuan, H. Xie, D. Yang, J. Zhao, H. Fan and L. Jiang, Phys. Chem. Chem. Phys., 2018, 20, 19314–19320 RSC
.
- H. Zheng,
et al.
, J. Phys. Chem. Lett., 2021, 12, 472–477 CrossRef CAS PubMed
.
- E. Barwa, T. F. Pascher, M. Ončák, C. van der Linde and M. K. Beyer, Angew. Chem., Int. Ed., 2020, 59, 7467–7471 CrossRef CAS PubMed
.
- E. Barwa, M. Ončák, T. F. Pascher, A. Herburger, C. van der Linde and M. K. Beyer, Chem. – Eur. J., 2020, 26, 1074–1081 CrossRef CAS PubMed
.
- M. Salzburger, R. T. Saragi, F. J. Wensink, E. M. Cunningham, M. K. Beyer, J. M. Bakker, M. Ončák and C. van der Linde, J. Phys. Chem. A, 2023, 127, 3402–3411 CrossRef CAS PubMed
.
- A. E. Green, J. Justen, W. Schöllkopf, A. S. Gentleman, A. Fielicke and S. R. Mackenzie, Angew. Chem., 2018, 130, 15038–15042 CrossRef
.
- A. Yanagimachi, K. Koyasu, D. Y. Valdivielso, S. Gewinner, W. Schöllkopf, A. Fielicke and T. Tsukuda, J. Phys. Chem. C, 2016, 120, 14209–14215 CrossRef CAS
.
- O. V. Lushchikova, M. Szalay, H. Tahmasbi, L. B. F. Juurlink, J. Meyer, T. Holtzl and J. M. Bakker, Phys. Chem. Chem. Phys., 2021, 23, 26661–26673 RSC
.
- N. Zimmermann, T. M. Bernhardt, J. M. Bakker, R. N. Barnett, U. Landman and S. M. Lang, J. Phys. Chem. A, 2020, 124, 1561–1566 CrossRef CAS PubMed
.
- O. V. Lushchikova, M. Szalay, T. Holtzl and J. M. Bakker, Faraday Discuss., 2022, 242, 252–268 RSC
.
- T. Kakumoto, Energy Convers. Manage., 1995, 36, 661–664 CrossRef CAS
.
- S. K. Iyemperumal and N. A. Deskins, Phys. Chem. Chem. Phys., 2017, 19, 28788–28807 RSC
.
- O. V. Lushchikova, H. Tahmasbi, S. Reijmer, R. Platte, J. Meyer and J. M. Bakker, J. Phys. Chem. A, 2021, 125, 2836–2848 CrossRef CAS PubMed
.
- M. Kappe, A. Schiller, F. Zappa, S. A. Krasnokutski, M. S. Wagner, H. F. Bettinger and P. Scheier, Astron. Astrophys., 2023, 672, A4 CrossRef CAS
.
-
T. Shimanouchi, Tables of molecular vibrational frequencies, National Bureau of Standards, Washington, DC, 1972 Search PubMed
.
- B. J. Thomas, B. A. Harruff-Miller, C. E. Bunker and W. K. Lewis, J. Chem. Phys., 2015, 142, 174310 CrossRef PubMed
.
- M. Kappe, B. Rasul, M. Mahmoodi-Darian, A. Schiller, F. Zappa, S. A. Krasnokutski and P. Scheier, Mol. Phys., 2024, 122, e2202271 CrossRef
.
- M. Meyer, P. Martini, A. Schiller, F. Zappa, S. A. Krasnokutski and P. Scheier, Astrophys. J., 2021, 913, 136 CrossRef CAS
.
- L. F. Gomez, E. Loginov, R. Sliter and A. F. Vilesov, J. Chem. Phys., 2011, 135, 154201 CrossRef PubMed
.
- F. Laimer, L. Kranabetter, L. Tiefenthaler, S. Albertini, F. Zappa, A. M. Ellis, M. Gatchell and P. Scheier, Phys. Rev. Lett., 2019, 123, 165301 CrossRef CAS PubMed
.
- A. J. Feinberg,
et al.
, Phys. Rev. Res., 2022, 4, L022063 CrossRef CAS
.
- S. Albertini, E. Gruber, F. Zappa, S. Krasnokutski, F. Laimer and P. Scheier, Mass Spectrom. Rev., 2022, 41, 529–567 CrossRef CAS PubMed
.
- P. Martini, S. Albertini, F. Laimer, M. Meyer, M. Gatchell, O. Echt, F. Zappa and P. Scheier, Phys. Rev. Lett., 2021, 127, 263401 CrossRef CAS PubMed
.
- E. Epifanovsky,
et al.
, J. Chem. Phys., 2021, 155, 84801 CrossRef CAS PubMed
.
- O. V. Lushchikova, D. M. M. Huitema, P. Lopez-Tarifa, L. Visscher, Z. Jamshidi and J. M. Bakker, J. Phys. Chem. Lett., 2019, 10, 2151–2155 CrossRef CAS PubMed
.
- E. M. Fernandez, J. M. Soler, I. L. Garzon and L. C. Balbas, Phys. Rev. B: Condens. Matter Mater. Phys., 2004, 70, 165403 CrossRef
.
- M. Szalay, D. Buzsáki, J. Barabás, E. Faragó, E. Janssens, L. Nyulászi and T. Höltzl, Phys. Chem. Chem. Phys., 2021, 23, 21738–21747 RSC
.
- B. Zamora, L. Nyulászi and T. Höltzl, ChemPhysChem, 2024, 25, e202300409 CrossRef CAS PubMed
.
- L. Chen,
et al.
, Phys. Chem. Chem. Phys., 2010, 12, 9845–9851 RSC
.
- J. H. Stenlid, A. J. Johansson, L. Kloo and T. Brinck, J. Phys. Chem. C, 2016, 120, 1977–1988 CrossRef CAS
.
- M. Szalay, D. Buzsaki, J. Barabas, E. Farago, E. Janssens, L. Nyulaszi and T. Holtzl, Phys. Chem. Chem. Phys., 2021, 23, 21738–21747 RSC
.
- X. P. Xing, G. J. Wang, C. X. Wang and M. F. Zhou, Chin. J. Chem. Phys., 2013, 26, 687 CrossRef CAS
.
- Y. Yang, G. Wang and M. Zhou, J. Phys. Chem. A, 2024, 128, 618–625 CrossRef CAS PubMed
.
- P. R. Horn, Y. Mao and M. Head-Gordon, Phys. Chem. Chem. Phys., 2016, 18, 23067–23079 RSC
.
Footnotes |
| † Electronic supplementary information (ESI) available: Laser power scan, benchmarking of different harmonic and anharmoic computational methods, correlations between binding energies and the frequencies of the CO2 asymmetric stretch vibrations, charges of the carbon and oxygen atoms. See DOI: https://doi.org/10.1039/d4cp01797h |
| ‡ Present address: Gedeon Richter Plc., Spectroscopic Research Department, 19-21 Gyömrői út, Budapest H-1103, Hungary. |
| This journal is © the Owner Societies 2024 |

