 Open Access Article
Creative Commons Attribution 3.0 Unported Licence
Electron-triggered processes in halogenated carboxylates: dissociation pathways in CF3COCl and its clusters†
Barbora
Kocábková‡
 a,
Jozef
Ďurana‡
 a,
Jozef
Rakovský
 a,
Andrij
Pysanenko
 a,
Juraj
Fedor
 a,
Milan
Ončák
 *b and
Michal
Fárník
 *a
*a
aJ. Heyrovský Institute of Physical Chemistry, v.v.i., Czech Academy of Sciences, Dolejškova 2155/3, 18223 Prague 8, Czech Republic. E-mail: michal.farnik@jh-inst.cas.cz
bInstitut für Ionenphysik und Angewandte Physik, Universität Innsbruck, Technikerstraße 25, 6020 Innsbruck, Austria. E-mail: milan.oncak@uibk.ac.at
First published on 18th January 2024
Abstract
Trifluoroacetyl chloride, CF3COCl, is produced in the Earth's atmosphere by photooxidative degradation of hydrochlorofluorocarbons, and represents a potential source of highly reactive halogen radicals. Despite considerable insight into photochemistry of CF3COCl, its reactivity towards electrons has not been addressed so far. We investigate the electron ionization and attachment in isolated CF3COCl molecules and (CF3COCl)N, max. N ≥ 10, clusters using a molecular beam experiment in combination with quantum chemical calculations. The ionization of the molecule at 70 eV electron energy leads to strong fragmentation: weakening of the C–C bond yields the CF3+ and COCl+ ions, while the fission of the C–Cl bond produces the major CF3CO+ fragment ion. The cluster spectra are dominated by Mn·COCl+ and Mn·CF3CO+ ions (M = CF3COCl). The electron attachment at energies between 1.5 and 11 eV also leads to the dissociation of the molecule breaking either the C–Cl bond at low energies below 3 eV yielding mainly Cl− ions, or dissociating the C–C bond at higher energies above 4 eV leading mainly to CF3− ions. In the clusters, the intact Mn− ions are stabilized after electron attachment at low energies with contribution of Mn·Cl− fragment ions. At higher energies, the Mn·Cl− fragments dominate the spectra, and C–C bond dissociation occurs as well yielding Mn·CF3−. Interestingly, Mn·Cl2− ions appear in the spectra at higher energies. We briefly discuss possible atmospheric implications.
1 Introduction
Certain ozone-depleting chlorofluorocarbons (CFCs) nowadays have been largely replaced by hydrochlorofluorocarbons (HCFCs). Chemicals within this class of compounds are considered to be acceptable temporary alternatives to CFCs1,2 (according to the Montreal Protocol, the definite phase-out of HCFCs is foreseen in 2030). HCFCs undergo further reactions in the atmosphere. Their photooxidative degradation produces trifluoroacetyl chloride (TFAC, CF3COCl).3,4 Since CF3COCl is a potential source of highly reactive halogen radicals, its presence in the atmosphere creates a need for understanding the dissociation pathways of this molecule.A lot of attention has been dedicated recently to the dissociation of CF3COCl induced by UV photons3–11 and its photochemical pathways are thus well understood. Its structure as well as vibrational spectra were also analyzed both experimentally12–14 and theoretically.15 There is, however, no information about electron-induced dissociation of CF3COCl – even the electron ionization mass spectrum is not available in the NIST database. At the same time, energetic particle precipitation influences chemical changes in the atmosphere.16 Each type of naturally occurring ionizing radiation – galactic cosmic rays, solar energetic particles and energetic electron precipitation – produces an avalanche of secondary electrons16 which can effectively induce molecular dissociation.17 For example, cosmic-ray driven electron-induced reactions of CFCs have been proposed to contribute considerably to ozone depletion.18,19 They have been even suggested to be a driving force behind climate change,20,21 however, this hypothesis has met with strong criticism.22,23 These proposed roles of halogenated species motivate the need for addressing our complete lack of knowledge about the electron-induced chemistry of HCFCs and the current target, TFAC. In this respect, CF3COCl is interesting also from the chemical perspective due to the presence of five highly electronegative atoms, contributing to its considerable reactivity and possible instability upon ionization/electron attachment.
Similarly, there is no information available about how the aggregation of CF3COCl influences its dissociation. This is relevant since heterogeneous processes, especially occurring on aerosol nanoparticles, are crucial for chemical transformations in the atmosphere. In laboratory investigations, such aerosols can be mimicked by clusters in molecular beams.24 Apart from elucidating the atmospheric pathways, the cluster-beam studies offer the possibility of probing the gas-phase and aggregated molecules with exactly the same experimental techniques which facilitates the identification of dissociation mechanisms.25
In this study, we investigate the electron-induced dissociation of isolated CF3COCl molecules and their clusters. We probed both the cationic pathways, induced by electrons with 70 eV kinetic energy, and anionic pathways, induced by the attachment of slow (less than 11 eV) electrons. We focus especially on the dissociative processes and how they are influenced by clustering. The experiments are complemented by quantum chemical calculations to provide insight into the structure, energetics and dissociation pathways of both single-molecular ions and clusters.
2 Methods
2.1 Experiment
The experiments were performed with the cluster-beam (CLUB) apparatus in Prague, the general description of which can be found in our recent reviews24–26 and references cited therein. The beams of CF3COCl molecules and clusters in a vacuum were generated by continuous supersonic expansions of CF3COCl with helium and argon buffer gas, respectively. A 5% (by the partial pressure) mixture of CF3COCl with the buffer gas was prepared in a pressurized cylinder and the gas mixture was expanded at a constant pressure pS through a conical nozzle (50 μm diameter, 30° full opening angle, and 2 mm long). Different expansion pressures pS were exploited for optimum cluster generation discussed below.About 2.5 cm downstream from the nozzle, the beam passed through a skimmer (0.8 mm diameter) into the next differentially pumped vacuum chamber and subsequently passed through two additional chambers on a flight path of about 1.5 m before entering a reflectron time-of-flight mass spectrometer (TOF-MS) chamber for the cluster ionization and detection. Our TOF-MS was first described elsewhere.27,28 It can detect either positive ions as described in the above cited publications, or it can work in the negative ion mode.29,30 Here, we use both modes. The clusters are ionized by an electron beam pulsed at 10 kHz frequency. The positive ions were generated by 70 eV electrons. Since we have not found the mass spectrum of the CF3COCl molecule in the NIST database, where the standard mass spectra measured at 70 eV electron energy can be found, we have measured the mass spectrum at this energy to provide the standard spectrum. The ionization pulse width was 5 μs. After a 0.5 μs delay, the ions were extracted by a 4 kV pulse and further accelerated to 8 keV into the time-of-flight region. In the negative ion mode, the electron energy was scanned from 0 to 11 eV in steps of 0.2 eV. The same settings were used with the voltages of opposite polarities. After the flight path of approximately 95 cm in the reflectron TOF-MS, the ions were detected with a microchannel plate detector and the mass spectra were recorded.
It ought to be mentioned that our electron source was not designed specifically for producing low-energy electrons, therefore our electron energy dependent ion yields provide reliable values at energies higher than approximately 1.5 eV.29,30 The electron energy scale was calibrated using 4.4 eV and 8.2 eV resonances in dissociative electron attachment to CO2 molecules.
From the combination of the positive and negative ion mass spectra generated from the same cluster beam, some information about the neutral cluster size distribution can be derived (see the ESI†). For the present experiment we estimate that the (CF3COCl)N clusters in the beam have maximum sizes, only slightly larger than N ≥ 10.
2.2 Theory
The structure of all molecules and ions was optimized at the B3LYP-D3/aug-cc-pVTZ level of theory employing the D3 dispersion correction as proposed by Grimme.31 To obtain more reliable electronic energies, single-point recalculation at the coupled cluster singles and doubles level, also with non-iteratively included triplets, CCSD/aug-cc-pVDZ and CCSD(T)/aug-cc-pVDZ, respectively, was performed, with the zero-point energy included as calculated at the B3LYP-D3/aug-cc-pVTZ level (when not stated otherwise, we refer to CCSD(T) values in the text). We include both CCSD and CCSD(T) reaction energies as CCSD(T) calculations were too demanding in the case of trimer clusters. Charges on atoms were calculated employing the CHELPG scheme at the B3LYP-D3/aug-cc-pVTZ level.32 Wave function stabilization was performed prior to every calculation. A search for the structure of neutral and charged CF3COCl dimers, trimers and tetramers was performed using our in-house genetic algorithm code.33 Namely, we create a pool of 20 initial structures and run 20 (dimers) and 30 (trimers, tetramers) cycles with 10 recombinations in each. The semi-empirical PM6 approach was used within genetic algorithm runs, 30 structures were subsequently re-optimized at BLYP-D3/6-31g* and B3LYP-D3/aug-cc-pVDZ levels to select four most stable or representative structures. For a cationic tetramer, two runs with 16 cycles were performed due to convergence issues. Tetramer structures were calculated only up to the B3LYP-D3/aug-cc-pVDZ level and are summarized in the ESI.† Although the employed technique is incapable of providing an exhaustive exploration of the rich potential energy surface of the investigated species, it offers an overview of its most important features as discussed below. All quantum chemical calculations were performed using the Gaussian 16 program.343 Results and discussion
3.1 Neutral cluster structure
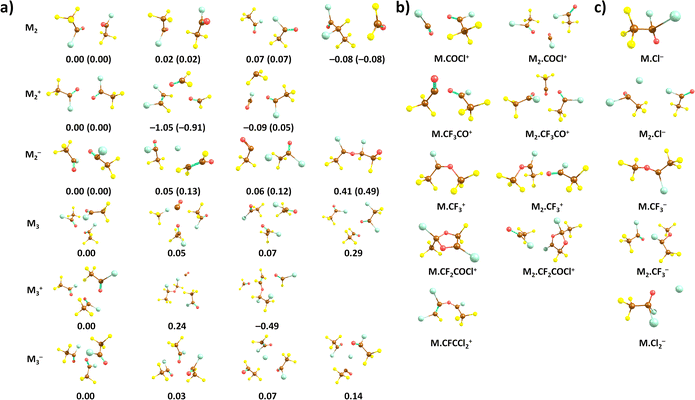
We start our discussion with the calculated structures of the neutral CF3COCl molecule and its molecular clusters, see Fig. 1a. The CF3COCl molecule is calculated to have Cs symmetry, the highest negative charge is predicted on the oxygen atom, −0.33e, fluorine atoms have a charge of about −0.2e. The calculated structure shows eclipsed configuration of CF3 with respect to the CO group, in agreement with the structure determined by electron diffraction.14When complexed in a dimer, the most stable structure found is OCF2⋯CF3 CFClCOCl, i.e., with considerable rearrangement of the two CF3COCl units. Such reorganization is a typical feature of the highly reactive CF3COCl molecules as will be also discussed below. However, we do not expect this structure to be present in the experiment due to kinetic reasons. Considering a simple (CF3COCl)2 dimer structure, the most stable structure maximizes the interaction between CF3 and COCl groups, probably due to slight polarization of the groups, with the COCl group becoming slightly negatively charged. For neutral trimers and tetramers, clusters with intact CF3COCl units are predicted to be the most stable ones (see ESI,† for tetramers). However, the presence of, e.g., the (CF3COCl)2·CF3Cl·CO structure among the most stable trimer isomers further emphasises the low thermodynamic stability of the CF3COCl molecule with highly electronegative atoms.
3.2 Positive ions
Fig. 2 shows the positive ion mass spectrum of the CF3COCl molecule in co-expansion with helium, measured at 70 eV electron energy. To our best knowledge, no mass spectrum of the gas phase molecule could be found in the literature. The molecule fragments significantly upon the ionization exhibiting only very little abundance of the parent ion CF3COCl+ at m/z = 132. The major fragment ions (in order of their abundances) are: CF3CO+ (m/z = 97), CF3+ (69), COCl+ (63), CF2Cl+ (85) and CF2+ (50).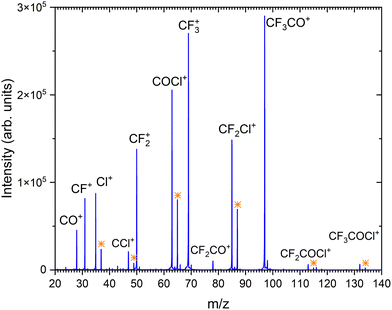 | ||
| Fig. 2 The mass spectrum of CF3COCl molecule at 70 eV electron energy. The assigned ions are indicated and the isotope peaks corresponding to the isotpe 37Cl are labeled by the orange stars. | ||
Our calculations show that the vertical and adiabatic ionization energies of the CF3COCl molecule are 12.6 eV and 11.6 eV, respectively. In the cation ground state, the electron is removed from an orbital localized mostly on the C–C bond. Subsequently, the bond weakens considerably, prolonging from 1.56 Å to 2.09 Å (in agreement with the high experimental yield of CF3+ and COCl+ ions). In the optimized ion, the charge is distributed almost equally, with 0.47e and 0.53e predicted for CF3 and for COCl moieties, respectively. The energies of the most important dissociation channels are collected in Table 1, the low dissociation energies match nicely the experimental observations. The appearance of CF3CO+, CF3+ and COCl+ can be explained by direct dissociation of a covalent bond, CF2Cl+ and CF2+ require a transfer of a chlorine or fluorine atom prior to the dissociation.
| Reaction | Energy (eV) |
|---|---|
| 2CF3COCl → (CF3COCl)2 | −0.19 (−0.23) |
| 3CF3COCl → (CF3COCl)3 | −0.48 |
| CF3COCl → CF3COCl+ + e− | 11.68 (11.62) |
| (CF3COCl)2 → (CF3COCl)2+ + e− | 11.29 (11.18) |
| (CF3COCl)3 → (CF3COCl)3+ + e− | 11.07 |
| CF3COCl + e− → CF3COCl− | −1.00 (−1.04) |
| (CF3COCl)2 + e− → (CF3COCl)2− | −1.32 (−1.43) |
| (CF3COCl)3 + e− → (CF3COCl)3− | −1.58 |
| CF3COCl+ → CF3CO+ + Cl | 0.04 (0.20) |
| CF3COCl+ → CF3+ + COCl | 0.88 (0.96) |
| CF3COCl+ → COCl+ + CF3 | 0.08 (0.18) |
| CF3COCl+ → CF2Cl+ + OCF | 0.74 (0.81) |
| CF3COCl+ → CF2+ + COClF | 2.01 (2.10) |
| (CF3COCl)2+ → CF3COCl·COCl+ + CF3 | 0.13 (0.29) |
| (CF3COCl)3+ → (CF3COCl)2·COCl+ + CF3 | 0.38 |
| (CF3COCl)2+ → CF3COCl·CF3CO+ + Cl | −0.05 (0.09) |
| (CF3COCl)3+ → (CF3COCl)2·CF3CO+ + Cl | −0.09 |
| (CF3COCl)2+ → CF3COCl·CF3+ + COCl | 0.12 (0.24) |
| (CF3COCl)3+ → (CF3COCl)2·CF3+ + COCl | 0.04 |
| (CF3COCl)2+ → CF3COCl·CF2COCl+ + F | 1.20 (1.36) |
| (CF3COCl)3+ → (CF3COCl)2·CF2COCl+ + F | 1.42 |
| (CF3COCl)3+ → CF3COCl·CFCCl2+ + CF4 + CO2 + F | 1.82 |
| CF3COCl + e− → Cl− + CF3CO | −0.23 (−0.15) |
| CF3COCl + e− → CF3− + CO + Cl | 1.53 (1.62) |
| CF3COCl + e− → CF3Cl− + CO | −0.55 (−0.47) |
| CF3COCl + e− → COCl− + CF3 | −0.20 (−0.08) |
| CF3COCl + e− → F− + CF2COCl | 1.60 (1.61) |
| (CF3COCl)2 + e− → CF3COCl2− + CF3CO | −0.79 (−0.85) |
| (CF3COCl)3 + e− → (CF3COCl)2·Cl− + CF3CO | −0.78 |
| (CF3COCl)2 + e− → CF3COCl·CF3− + COCl | 0.27 (0.31) |
| (CF3COCl)3 + e− → (CF3COCl)2·CF3− + COCl | 0.22 |
| (CF3COCl)3 + e− → CF3COCl·Cl2− + 2CF3CO | 2.27 |
The electron-impact ionization can be described by the Binary–Encounter–Bethe (BEB) model in the formalism developed by Kim and co-workers.35 In this model, the total ionization cross section is given as the sum of cross sections for ionization from occupied molecular orbitals,  . The individual σi's can be evaluated from orbital energies and kinetic energies by a semi-empirical formula.35,36 These orbital σi's contributions, evaluated at 70 eV electron energy, are shown as Fig. S10 in the ESI.† A similar effect as was observed for a different fluorinated molecule in ref. 36 can be seen: the ionization from HOMO does not dominate the cross section, rather, the ionization from many molecular orbitals contributes significantly. This means that the cation is produced in many electronically excited states. Most probably, these undergo an ultrafast internal conversion into the ground cation state which is left vibrationally hot and fragments statistically.36 Together with the low reaction energy for Cl evaporation (0.2 eV), this explains the low yield of the parent ion in the experimental spectrum.
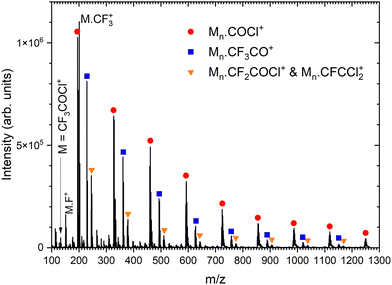
Next, we generate (CF3COCl)N clusters by co-expanding the CF3COCl molecules with Ar buffer gas. Several expansion pressures were exploited and the spectra were qualitatively the same (see Fig. S1 in ESI†), therefore we show only the spectrum recorded at the highest used stagnation pressure of 3.8 bar corresponding to the largest produced clusters, see Fig. 3. In the mass range up to the monomer mass m/z = 132, the cluster spectra are very similar to the spectrum of the molecule (see Fig. S2 in ESI†). Three significant cluster ion series are labeled in Fig. 3: red circles denote the Mn·COCl+ series (M = CF3COCl), blue squares label Mn·CF3CO+, and orange triangles can correspond to Mn·CF2COCl+ and/or Mn·CFCCl2+. The ambiguity in the assignment of the last series arises from the mass coincidence (19F plus 16O coincides with 35Cl). This could, in principle, be resolved by isotope contributions, namely 35Cl and 37Cl.
The cluster ions contain the 35Cl and 37Cl isotopes in a ratio corresponding to their natural abundances, which is 35Cl![[thin space (1/6-em)]](https://www.rsc.org/images/entities/char_2009.gif) :
:![[thin space (1/6-em)]](https://www.rsc.org/images/entities/char_2009.gif) 37Cl = 0.76
37Cl = 0.76![[thin space (1/6-em)]](https://www.rsc.org/images/entities/char_2009.gif) :
:![[thin space (1/6-em)]](https://www.rsc.org/images/entities/char_2009.gif) 0.24. Depending on the number of Cl atoms in the cluster, we can calculate the relative intensities of the isotope peaks that follow the binomial distribution (see ESI,† for details). In Fig. 4, we show the details of the ambiguous series Mn·R+, R = CF2COCl or CFCCl2 for n = 1–3, and we compare the peak intensities to the calculated abundances of the isotopes (symbols) assuming both assignments. The calculated isotope abundances are normalized to the maximum peak intensity in the corresponding group. The first mass peak group for n = 1 agrees better with the R = CF2COCl assignment, while for n = 2 and 3, the isotope abundances for Mn·R+ with R = CFCCl2 fit the spectrum better. In Fig. S3 and S4 in the ESI,† we demonstrate that the assignment using isotope ratios works well for the unambiguously assigned series Mn·COCl+ and Mn·CF3CO+. Therefore, we assume that the first group of mass peaks labeled by orange triangles in Fig. 3 corresponds mainly to M·CF2COCl+ and the other mass peaks can be assigned to Mn·CFCCl2+, n ≥ 2, series, although a contribution of both series in all mass peaks cannot be excluded.
0.24. Depending on the number of Cl atoms in the cluster, we can calculate the relative intensities of the isotope peaks that follow the binomial distribution (see ESI,† for details). In Fig. 4, we show the details of the ambiguous series Mn·R+, R = CF2COCl or CFCCl2 for n = 1–3, and we compare the peak intensities to the calculated abundances of the isotopes (symbols) assuming both assignments. The calculated isotope abundances are normalized to the maximum peak intensity in the corresponding group. The first mass peak group for n = 1 agrees better with the R = CF2COCl assignment, while for n = 2 and 3, the isotope abundances for Mn·R+ with R = CFCCl2 fit the spectrum better. In Fig. S3 and S4 in the ESI,† we demonstrate that the assignment using isotope ratios works well for the unambiguously assigned series Mn·COCl+ and Mn·CF3CO+. Therefore, we assume that the first group of mass peaks labeled by orange triangles in Fig. 3 corresponds mainly to M·CF2COCl+ and the other mass peaks can be assigned to Mn·CFCCl2+, n ≥ 2, series, although a contribution of both series in all mass peaks cannot be excluded.
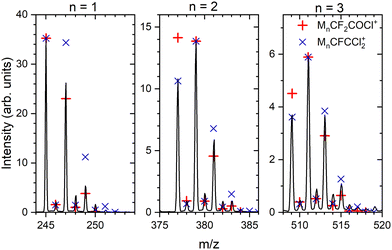 | ||
| Fig. 4 Details of the mass spectrum of (CF3COCl)N clusters for the ambiguous series Mn·R+ where R = CF2COCl or CFCCl2 (orange triangles in Fig. 3). Symbols indicate the calculated abundances of the isotopes normalized to the maximum peak within each group. | ||
There is also a series corresponding to Mn·CF3+. The first member of the series, M·CF3+ at m/z = 201, is the labeled maximum peak in Fig. 3. The following Mn·CF3+, n > 1, ion peaks have intensities comparable with the Mn·CFCCl2+ series (orange triangles). The analysis is complicated by the isotopologue contribution of the major Mn·COCl+ ions as shown in ESI† (Fig. S5), but the contribution of the Mn·CF3+ series is relatively small with the major contribution originating just from the first M·CF3+ peak. The relative intensities of the cluster ion series Mn·COCl+, Mn·CF3CO+, Mn·CF3+, and Mn·CFCCl2+ (Mn·CF2COCl+) could be estimated to 46%, 25%, 20%, and 9%, respectively. These estimates should be considered with caution in view of relatively high spectra congestion, mass coincidences and ambiguities in the peak assignments. Nevertheless, the three major molecular fragments CF3CO+, CF3+, and COCl+ are reflected in the cluster ion series, though in different ratios.
There are other minor series in the spectra, which could not be assigned, however, their contribution is small (see Fig. S6 in ESI,† for the fully resolved spectrum). Worth noting is the absence of non-fragmented cluster ions Mn+, i.e., (CF3COCl)n+, in the spectrum, which points to the fact that the molecule is prone to a strong fragmentation after the electron ionization apparent from the mass spectrum of the isolated molecule, and even the cluster environment does not hinder this fragmentation.
Quantum chemical calculations show that the most stable structures of positively charged oligomers are often considerably reconstructed, see Fig. 1. Apart from simple dissociation of a CF3COCl unit into CF3 and COCl that are then stabilized in the cluster, we see also more fundamental reconstruction, e.g., formation of FClC–CFCl or formation of a CO molecule. Still, we consider intact CF3COCl oligomers to be the most probable moieties present in the experiment due to kinetic reasons. The adiabatic ionization energy of the neutral dimer and trimer is predicted to be 11.3 eV and 11.1 eV, respectively (CCSD//B3LYP-D3 level), Table 1.
With respect to the observed fragments, the presence of two main fragments, namely Mn·COCl+ and Mn·CF3CO+, can be explained by direct dissociation of CF3 and Cl, respectively, with reaction energies close to 0 eV. The electronic structure of the products can be described as COCl+ and CF3CO+ stabilized by the cluster environment; the fact that no cluster reconstruction is required can contribute to the high experimental yield of these ions. As to Mn·CF2COCl+, formation of a five-membered ring is predicted upon F atom dissociation as shown in (Fig. 1b); the respective formation energies lie below 2 eV (Table 1) for both dimers and trimers. Our calculations show that Mn·CF2COCl+ and Mn·CFCCl2+ fragments could be connected as they share the dissociation of F in the first place. For the second ion fragment, CF4 and CO2 molecules have to leave the cluster in the subsequent reaction.
The formation of the Mn·CF3+ ions is predicted to proceed through a direct dissociation process and reconstruction into the CF3CClOCF3+ ion as shown in (Fig. 1b), possibly leading to the lower Mn·CF3+ abundance despite its low reaction energy and the fact that the CF3+ ion is the most abundant fragment in the monomer ionization. Finally, the very low reaction energies that even reach negative values for Cl dissociation explain the absence of Mn+ clusters in the experimental mass spectra.
3.3 Negative ions
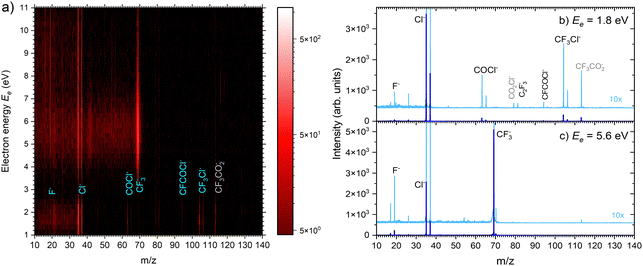 | ||
| Fig. 5 (a) 2D mass spectra of negative ions produced by electron attachment to CF3COCl molecules at different electron energies. (b) and (c) Mass spectra at two different electron energies. | ||
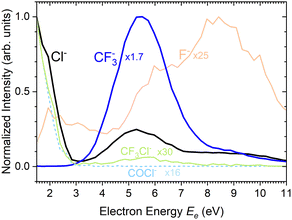
There are two pronounced fragments produced in the DEA to the CF3COCl molecule; namely Cl− generated preferentially at low electron energies below 3 eV and CF3− that appear above 3 eV with a maximum between 5 and 6 eV, Fig. 6. Some much weaker fragments appear in the spectra shown in Fig. 5 upon closer inspection, especially at low electron energy, e.g., CF3Cl−, COCl− and F− with their energy dependence given also in Fig. 6. Further ions labeled in Fig. 5b are either negligible (CFCOCl−, C2F3−) or are obviously generated from dimers present in the molecular beam since they contain two oxygen atoms (grey labels in Fig. 5b). The energy-dependent ion yields in Fig. 6 show that dominant Cl− (black) are produced at very low energies possibly with maximum at zero. There is a second much lower maximum at around 5.4 eV and possibly a weak shoulder at around 9–10 eV. CF3− ions (blue) are produced only at the higher energies of around 5.4 eV with a tail towards 9 eV suggesting a similar process to the Cl− second peak. The other fragments are much less populated. Note that the energy-dependent ion yields shown in Fig. 6 have been normalized to the maximum (the multiplication factors are outlined by the corresponding lines). The CF3Cl− (light green) and COCl− (dashed light blue) ions also exhibit the maximum at low energies, and the former ion is also observed around 5.4 eV. The F− ion (light orange) seems to have a different dependence with a wide maximum at around 8–9 eV and a shoulder at 6 eV (a low-energy peak at around 2 eV is uncertain due to low intensity).
The calculated adiabatic electron affinity of CF3COCl is 1.04 eV. Upon electron attachment, an electron is added into the π* orbital of the C![[double bond, length as m-dash]](https://www.rsc.org/images/entities/char_e001.gif) O bond. The additional charge leads to the C–Cl bond prolongation to 2.18 Å. In the resulting moiety, [CF3CO⋯Cl]−, the charge is almost equally distributed on CF3CO (–0.45e) and Cl (–0.55e). Such a molecular anion is not experimentally observed in the binary electron collisions with isolated CF3COCl since excess energy leads either to electron detachment or to the fragmentation of the complex (dissociative electron attachment, DEA).
O bond. The additional charge leads to the C–Cl bond prolongation to 2.18 Å. In the resulting moiety, [CF3CO⋯Cl]−, the charge is almost equally distributed on CF3CO (–0.45e) and Cl (–0.55e). Such a molecular anion is not experimentally observed in the binary electron collisions with isolated CF3COCl since excess energy leads either to electron detachment or to the fragmentation of the complex (dissociative electron attachment, DEA).
According to the calculated reaction energies (Table 1), there are three exothermic DEA channels. Interestingly, the most energetically favorable one, formation of CF3Cl−, is experimentally observed to be rather weak. We ascribe its low cross section to the necessity for a complex atomic rearrangement on the resonant potential energy surface. On the other hand, Cl− and COCl− can be formed by breaking a single bond and have similar calculated exothermicities (0.15 eV vs. 0.08 eV). Also, CF3Cl− can dissociate into CF3 + Cl−, requiring only 0.53 eV.
A combination of effects can contribute to the fact that the Cl− yield is much higher (approximately by a factor of 16). The first one is the involved resonant state, especially its dissociative direction. We can roughly estimate the energy of the π* (C![[double bond, length as m-dash]](https://www.rsc.org/images/entities/char_e001.gif) O) resonance (i.e., the vertical attachment energy at the geometry of the neutral) using the empirical relation between the energy of the unoccupied molecular orbital and the energy of the corresponding resonance. The empirical relation of Chen and Gallup37 [Eres = (EMO − 2.33 eV)/1.31] predicts that adding an electron to the LUMO (EMO = 2.31 eV) yields an Eres value very close to zero. It thus corresponds to a state which is very weakly bound or to a resonance with energy close to 0 eV. This is clearly the state involved in the low-energy Cl− and COCl− production. Upon visual inspection of the LUMO (Fig. S11 in ESI†), it is clear that the antibonding plane crosses the C–Cl bond, while the C–C bond is in a bonding plane. This hints that upon the formation of the π* (C
O) resonance (i.e., the vertical attachment energy at the geometry of the neutral) using the empirical relation between the energy of the unoccupied molecular orbital and the energy of the corresponding resonance. The empirical relation of Chen and Gallup37 [Eres = (EMO − 2.33 eV)/1.31] predicts that adding an electron to the LUMO (EMO = 2.31 eV) yields an Eres value very close to zero. It thus corresponds to a state which is very weakly bound or to a resonance with energy close to 0 eV. This is clearly the state involved in the low-energy Cl− and COCl− production. Upon visual inspection of the LUMO (Fig. S11 in ESI†), it is clear that the antibonding plane crosses the C–Cl bond, while the C–C bond is in a bonding plane. This hints that upon the formation of the π* (C![[double bond, length as m-dash]](https://www.rsc.org/images/entities/char_e001.gif) O) resonance, the C–Cl bond will be promptly cleaved. The cross section for the cleavage of this bond can be further enhanced by the bending motion of the Cl atom from the plane defined by the CCO atoms. Such bending will mix the π* (C
O) resonance, the C–Cl bond will be promptly cleaved. The cross section for the cleavage of this bond can be further enhanced by the bending motion of the Cl atom from the plane defined by the CCO atoms. Such bending will mix the π* (C![[double bond, length as m-dash]](https://www.rsc.org/images/entities/char_e001.gif) O) resonance with a higher-lying σ* (C
O) resonance with a higher-lying σ* (C![[double bond, length as m-dash]](https://www.rsc.org/images/entities/char_e001.gif) O) state, such mixing strongly increases the DEA cross section.38–40 Also, the reduced mass of the CF3CO⋯Cl− system is 25.7 amu, while that of the CF3⋯COCl− system is 32.9 amu (for the 35Cl isotope). The dissociation in the latter case will be thus slower, providing more time for the electrons to autodetach.41 This leads to lowering of the DEA cross section in the COCl− channel. Finally, the COCl− ion is a weakly bound complex, CO⋯Cl−, and might easily dissociate to CO + Cl− with a calculated reaction energy of 0.14 eV.
O) state, such mixing strongly increases the DEA cross section.38–40 Also, the reduced mass of the CF3CO⋯Cl− system is 25.7 amu, while that of the CF3⋯COCl− system is 32.9 amu (for the 35Cl isotope). The dissociation in the latter case will be thus slower, providing more time for the electrons to autodetach.41 This leads to lowering of the DEA cross section in the COCl− channel. Finally, the COCl− ion is a weakly bound complex, CO⋯Cl−, and might easily dissociate to CO + Cl− with a calculated reaction energy of 0.14 eV.
Formation of CF3− has a calculated threshold of 1.62 eV. The experimental signal peaks appear at around 5.4 eV. The UV-VIS spectrum5 supported by theoretical calculations10 exhibits a maximum at around 4.9 eV. Thus, the incoming electron can excite the molecule and the observed peak can correspond to a core-excited shape resonance (their formation can be possibly enhanced by a dipole moment of the excited states42,43). The DEA peaks visible at about 8–10 eV could correspond to the core-excited resonances that have higher excited states10 as the parent states.
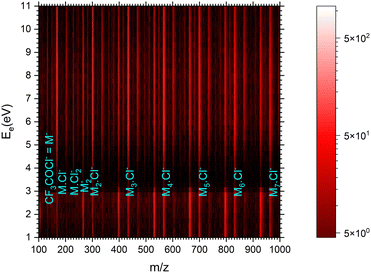 | ||
| Fig. 7 The 2D mass spectrum and electron energy dependence after the electron attachment to the (CF3COCl)N clusters. | ||
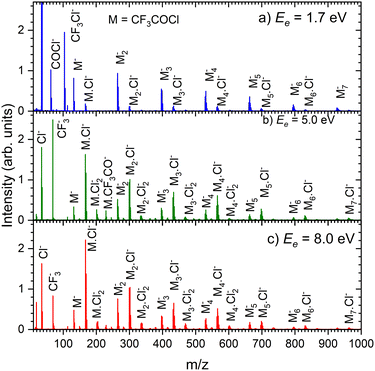
Fig. 8 shows the mass spectra at specific electron energies of (a) 1.7 eV, (b) 5.0 eV and (c) 8.0 eV. The major cluster ion fragment series are Mn·Cl− and Mn− mentioned above. Also an interesting series with molecular chlorine Mn·Cl2− exhibits appreciable abundances at higher energies. However, Mn·Cl2− overlaps with Mn·CF3− due to isotope contributions (Cl2− corresponds to m/z = 70 for the 35Cl isotope, and CF3− to m/z = 69). The two series differ by the number of Cl atoms, therefore a detailed analysis is possible using the natural isotope abundances as outlined for the positive ions. It shows that both Mn·Cl2− and Mn·CF3− series are present in the spectra (see Fig. S7 and S8 in the ESI†).
We identify further less abundant ion series in the spectra upon close analysis as well. For example, a group of mass peaks corresponding to Mn⋅CF3CO− at m/z = 229 is labelled in (Fig. 8b) at 5.0 eV. This peak and further smaller fragment series are shown in detailed spectra as shown in Fig. S9 in the ESI.† However, the abundance of these ions is relatively small.
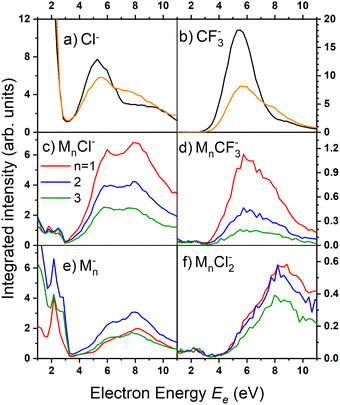
Finally, we discuss the electron energy dependent ion yield for several cluster ion fragments shown in Fig. 9. The top panels show the negative ion yield of (a) Cl− and (b) CF3− fragments (orange lines) in comparison with the yields of the same ions from the DEA of isolated molecules (black). The high-energy tails of the cluster spectra suggest that in clusters, processes at somewhat higher energies can also contribute to the generation of these ions. Panels (c) and (d) below show the spectra for the Mn⋅Cl− and Mn⋅CF3− ions respectively. The shape of the spectra is independent of the cluster ion size n. A comparison of Fig. 9c and d with Fig. 9a and b, respectively, suggests that the main maxima in the top spectra are due to the isolated molecules in the beam and the Cl− and CF3− fragments from the clusters are produced at higher energies. The low-energy maximum for Cl− seems to be strongly suppressed in the clusters. Finally, the bottom row in Fig. 9e and f shows the spectra for Mn− and Mn⋅Cl2− fragments. The Mn− ions are produced at low energies. The broad peak at higher energies might be due to the self-scavenging processes in clusters,29 where the incoming electron excites a CF3COCl molecule, loses its kinetic energy and attaches as the slow electron. The Mn⋅Cl2− ions are formed at higher electron energies due to the extra energy required to rearrange the molecules (see below).
The calculated adiabatic electron affinity of the CF3COCl dimer and trimer is 1.32 eV and 1.58 eV, respectively (CCSD//B3LYP-D3). As already hinted through the experiments, the cluster environment might prevent the Cl− pre-dissociation. Although Cl− could be formed in the cluster, a cluster conformation with intact CF3COCl units is slightly more stable (Fig. 1).
In the case of CF3COCl2−, our calculations suggest that a C–Cl bond is formed, see Fig. 1, the formation of the ion upon electron attachment is exothermic in both dimer and trimer (Table 1). For the M2⋅Cl− ion, a Cl− anion is predicted to lie next to the CF3COCl molecules. The formation of Mn·CF3− is again predicted to be connected to cluster reconstruction, forming a CF3C(Cl)OCF3− unit. The Mn·Cl2− anion can be produced by the dissociation of two CF3CO units, forming a CF3COCl2⋯Cl− cluster at an energy of about 2.3 eV.
4 Conclusions
We performed a molecular beams study of trifluoroacetyl chloride and its clusters, analyzing their behavior by interaction with electrons.For an isolated molecule, ionization leads to the weakening the C–C bond, yielding CF3+ or COCl+ fragment ions. Breaking of the C–Cl bond leads to the major fragment ion CF3CO+, however, the sum of CF3+ and COCl+ ion yields exceeds the CF3CO+ yield significantly, suggesting that the C–C bond dissociation is the primary channel. On the other hand, the electron attachment primarily breaks the C–Cl bond leading to Cl− dominating at low electron energies below 3 eV, and CF3−, which is the major channel at higher energies above 4 eV.
For clusters, a typical feature is their thermodynamic instability, with cluster reconstruction often predicted to be favorable by our genetic algorithm search. In cationic clusters, two main series are observed upon ionization, Mn·COCl+ and Mn·CF3CO+, both formed through direct dissociation. In the case of minor fragments, considerable cluster reconstruction is predicted, most probably contributing to their low experimental yield.
For anions, stabilized molecular Mn− clusters dominate the mass spectra at low energies below 3 eV. Also dissociation of the C–Cl bond plays a role at low energies forming Mn·Cl− fragment ions, which become the dominant species at higher electron energies above 4 eV. The dissociation of the C–C bond can occur as well at these higher energies, forming Mn·CF3−. At higher energies, Mn·Cl2− cluster ions also occur.
In terms of atmospheric relevance we stress two findings: (i) the gas-phase molecule is very fragile with respect to the electron impact, both the positive ionization and electron attachment mass spectra are fragmentative, and (ii) the major cationic fragment in the gas phase is CF3CO+, with its necessary neutral counterpart being the Cl radical. Upon aggregation, the anion dissociation pathways are considerably suppressed and the intact molecular cluster anions are dominant. The cationic pathways are not influenced by clustering as strongly as the anionic ones, even though the chlorine-producing channel (Mn·CF3CO+) is not the most dominant fragment progression in clusters.
Author contributions
B. Kocábková: data curation, investigation, formal analysis, and visualization; J. Ďurana: investigation, formal analysis, and visualization; J. Rakovský: investigation; A. Pysanenko: investigation; V. Poterya: investigation; J. Fedor: writing – review and editing, and validation; M. Ončák: conceptualization, writing original draft, formal analysis, visualization, validation; and M. Fárník: conceptualization, writing original draft, formal analysis, visualization, validation, and funding acquisition.Conflicts of interest
There are no conflicts to declare.Acknowledgements
This work has been supported by the Czech Science Foundation project Nr. 21-07062S, MEYS CZ project Nr. LTC20067. The collaboration has been supported by COST Action CA18212 MD-GAS, supported by COST (European Cooperation in Science and Technology). The computational results presented have been achieved using the HPC Infrastructure LEO of the University of Innsbruck.Notes and references
- A. Ravishankara, A. Turnipseed, N. Jensen, S. Barone, M. Mills, C. Howard and S. Solomon, Science, 1994, 263, 71–75 CrossRef CAS PubMed
.
- O. Wild, O. Rattigan, R. Jones, J. Pyle and R. Cox, J. Atmos. Chem., 1996, 25, 167–199 CrossRef CAS
.
- J. Francisco, Chem. Phys., 1992, 163, 27–36 CrossRef CAS
.
- J. B. Burkholder, R. Cox and A. Ravishankara, Chem. Rev., 2015, 115, 3704–3759 CrossRef CAS PubMed
.
- O. Rattigan, O. Wild, R. Jones and R. Cox, J. Photochem. Photobiol., A, 1993, 73, 1–9 CrossRef CAS
.
- M. M. Maricq and J. J. Szente, J. Phys. Chem., 1995, 99, 4554–4557 CrossRef CAS
.
- M. R. McGillen and J. B. Burkholder, Chem. Phys. Lett., 2015, 639, 189–194 CrossRef CAS
.
- R. Meller and G. K. Moortgat, J. Photochem. Photobiol., A, 1997, 108, 105–116 CrossRef CAS
.
- Y. Hao, L. Liu and W.-H. Fang, J. Chem. Phys., 2021, 154, 244303 CrossRef CAS PubMed
.
- J. Janoš, I. S. Vinklárek, J. Rakovský, D. P. Mukhopadhyay, B. F. E. Curchod, M. Fárník and P. Slavíček, ACS Earth Space Chem., 2023, 7, 2275–2286 CrossRef PubMed
.
- F. E. Malanca, G. A. Argüello, E. H. Staricco and R. P. Wayne, J. Photochem. Photobiol., A, 1998, 117, 163–169 CrossRef CAS
.
- C. Berney, Spectrochem. Acta, 1964, 20, 1437–1449 CrossRef CAS
.
- J. Durig, A. Fanning, T. Sheehan and G. Guirgis, Spectrochim. Acta, Part A, 1991, 47, 279–289 CrossRef
.
- K. I. Gobbato, C. Leibold, S. Centeno, C. O. Della Védova, H.-G. Mack and H. Oberhammer, J. Mol. Struct., 1996, 380, 55–61 CrossRef CAS
.
- G. Bent, E. Zerrad, G. Trucks, K. Wiberg and L. Taing, J. Phys. Chem. A, 2000, 104, 370–379 CrossRef CAS
.
- I. A. Mironova, K. L. Aplin, F. Arnold, G. A. Bazilevskaya, R. G. Harrison, A. A. Krivolutsky, K. A. Nicoll, E. V. Rozanov, E. Turunen and I. G. Usoskin, Space Sci. Rev., 2015, 194, 1–96 CrossRef CAS
.
-
I. I. Fabrikant, S. Eden, N. J. Mason and J. Fedor, Advances In Atomic, Molecular, and Optical Physics, Elsevier Inc., Academic Press, 2017, vol. 66, pp. 545–657 Search PubMed
.
- Q.-B. Lu and L. Sanche, Phys. Rev. Lett., 2001, 87, 078501 CrossRef CAS PubMed
.
- Q.-B. Lu, Proc. Natl. Acad. Sci. U. S. A., 2023, 120, e2303048120 CrossRef CAS PubMed
.
- Q.-B. Lu, Phys. Rep., 2010, 487, 141–167 CrossRef CAS
.
- Q.-B. Lu, Int. J. Modern Phys. B, 2013, 28, 1350073 CrossRef
.
- R. Müller and J. U. Grooss, Int. J. Modern Phys. B, 2014, 28, 1482001 CrossRef
.
- D. Nuccitelli, K. Cowtan, P. Jacobs, M. Richardson, R. G. Way, A.-M. Blackburn, M. B. Stolpe and J. Cook, Int. J. Modern Phys. B, 2014, 28, 1482003 CrossRef
.
- M. Fárník, J. Phys. Chem. Lett., 2023, 14, 287–294 CrossRef PubMed
.
- M. Fárník, J. Fedor, J. Kočišek, J. Lengyel, E. Pluharová, V. Poterya and A. Pysanenko, Phys. Chem. Chem. Phys., 2021, 23, 3195–3213 RSC
.
- M. Fárník and J. Lengyel, Mass Spec Rev., 2018, 37, 630–651 CrossRef PubMed
.
- J. Lengyel, A. Pysanenko, J. Kočišek, V. Poterya, C. Pradzynski, T. Zeuch, P. Slavíček and M. Fárník, J. Phys. Chem. Lett., 2012, 3, 3096–3109 CrossRef CAS PubMed
.
- J. Kočišek, J. Lengyel and M. Fárník, J. Chem. Phys., 2013, 138, 124306 CrossRef PubMed
.
- J. Lengyel, J. Kočišek, M. Fárník and J. Fedor, J. Phys. Chem. C, 2016, 120, 7397–7402 CrossRef CAS
.
- J. Kočišek, A. Pysanenko, M. Fárník and J. Fedor, J. Phys. Chem. Lett., 2016, 7, 3401–3405 CrossRef PubMed
.
- S. Grimme, J. Antony, S. Ehrlich and H. Krieg, J. Chem. Phys., 2010, 132, 154104 CrossRef PubMed
.
- C. M. Breneman and K. B. Wiberg, J. Comput. Chem., 1990, 11, 361–373 CrossRef CAS
.
-
G. Schöpfer, M. Hütter, M. Gatt and M. Ončák, Genetic Algorithms for Finding Molecules, (v1.0), https://git.uibk.ac.at/c7441332/genetic-algorithms Search PubMed
.
- M. J. Frisch, G. W. Trucks, H. B. Schlegel, G. E. Scuseria, M. A. Robb, J. R. Cheeseman, G. Scalmani, V. Barone, B. Mennucci, G. A. Petersson, H. Nakatsuji, M. Caricato, X. Li, H. P. Hratchian, A. F. Izmaylov, J. Bloino, G. Zheng, D. J. Sonnenberg, M. Hada, M. Ehara, K. Toyota, R. Fukuda, J. Hasegawa, M. Ishida, T. Nakajima, Y. Honda, O. Kitao, H. Nakai, T. Vreven, J. Montgomery, Jr., J. R. Peralta, F. Ogliaro, M. Bearpark, J. J. Heyd, E. Brothers, K. N. Kudin, V. N. Staroverov, R. Kobayashi, J. Normand, K. Raghavachari, A. Rendell, J. C. Burant, S. S. Iyengar, J. Tomasi, M. Cossi, N. Rega, J. M. Millam, M. Klene, J. E. Knox, J. B. Cross, V. Bakken, C. Adamo, J. Jaramillo, R. Gomperts, R. E. Stratmann, O. Yazyev, A. J. Austin, R. Cammi, C. Pomelli, J. W. Ochterski, R. L. Martin, K. Morokuma, V. G. Zakrzewski, G. A. Voth, P. Salvador, J. J. Dannenberg, S. Dapprich, A. D. Daniels, O. Farkas, J. B. Foresman, J. V. Ortiz, J. Cioslowski and D. J. Fox, Gaussian 16 Revision A.03, Gaussian Inc., Wallingford CT, 2016 Search PubMed.
- W. Hwang, Y.-K. Kim and M. E. Rudd, J. Chem. Phys., 1996, 104, 2956 CrossRef CAS
.
- M. Rankovič, J. Chalabala, M. Zawadzki, J. Kočišek, P. Slavíček and J. Fedor, Phys. Chem. Chem. Phys., 2019, 21, 16451 RSC
.
- D. Chen and G. A. Gallup, J. Chem. Phys., 1990, 93, 8893–8901 CrossRef CAS
.
- P. Nag, M. Tarana and J. Fedor, Phys. Rev. A, 2021, 103, 032830 CrossRef CAS
.
- M. Zawadzki, M. Čížek, K. Houfek, R. Čurík, M. Ferus, S. Civiš, J. Kočišek and J. Fedor, Phys. Rev. Lett., 2018, 121, 143402 CrossRef CAS PubMed
.
- T. P. R. Kumar, P. Nag, M. Rankovič, J. Kočišek, Z. Mašín and J. Fedor, J. Phys. Chem. Lett., 2022, 13, 11136–11142 CrossRef PubMed
.
- R. Janečková, D. Kubala, O. May, J. Fedor and M. Allan, Phys. Rev. Lett., 2013, 111, 203201 CrossRef PubMed
.
- Z. Li, M. Ryszka, M. M. Dawley, I. Carmichael, K. B. Bravaya and S. Ptasińska, Phys. Rev. Lett., 2019, 122, 073002 CrossRef PubMed
.
- J. Fedor, Phys. Rev. Lett., 2020, 124, 199301 CrossRef CAS PubMed
.
Footnotes |
| † Electronic supplementary information (ESI) available: Detailed mass spectra of positive and negative ions, isotopologue analysis for positive and negative ions, results of genetic algorithm optimizations, Cartesian coordinates of all optimized structures. See DOI: https://doi.org/10.1039/d3cp05387c |
| ‡ Also affiliated to the University of Chemistry and Technology, Technická 5, Prague 6, 166 28, Czech Republic. |
| This journal is © the Owner Societies 2024 |

