 Open Access Article
Redox-active, porous pyrene tetraone dendritic polymers as cathode materials for lithium-ion batteries†
Lucas
Ueberricke
a,
Felix
Mildner
a,
Yuquan
Wu
b,
Elisa
Thauer
 b,
Tom
Wickenhäuser
b,
Wen-Shan
Zhang
c,
Yana
Vaynzof
b,
Tom
Wickenhäuser
b,
Wen-Shan
Zhang
c,
Yana
Vaynzof
 bd,
Sven M.
Elbert
a,
Rasmus R.
Schröder
c,
Rüdiger
Klingeler
*b and
Michael
Mastalerz
 *a
*a
aOrganisch-Chemisches Institut, Ruprecht-Karls-Universität Heidelberg, Im Neuenheimer Feld 270, Heidelberg 69120, Germany. E-mail: Michael.mastalerz@oci.uni-heidelberg.de
bKirchhoff-Institut für Physik, Ruprecht-Karls-Universität Heidelberg, Im Neuenheimer Feld 227, Heidelberg 69120, Germany. E-mail: klingeler@kip.uni-heidelberg.de
cBioQuant, Ruprecht-Karls-Universität Heidelberg, Im Neuenheimer Feld 267, Heidelberg 69120, Germany
dTechnical University of Dresden (TUD), Integrated Center for Applied Physics and Photonic Materials (IAPP) and Center for Advancing Electronics Dresden (cfaed), Dresden 01062, Germany
First published on 2nd March 2023
Abstract
Redox active, insoluble pyrene tetraone based dendritic porous polymers were synthesized by using different catalyst loadings and work-up procedures. The dendritic polymers were investigated by gas sorption analysis for their porosity and characterized with respect to their properties as active material in cathodes of lithium ion secondary batteries. Electrochemical measurements by means of cyclic voltammetry and galvanostatic cycling show reversible redox activity and specific capacities of up to 137 mA h g−1 with a capacity retention of 86% after 50 cycles.
Introduction
The commercialization of lithium-ion batteries (LIBs) in 1991 was a milestone in the field of mobile energy storage. Due to their longevity, high voltage, high capacity and good rechargeability these devices are nowadays widely used in many electronic devices, such as smartphones, laptops and even electric vehicles – a development for which Goodenough, Whittingham and Yoshino were awarded the Nobel prize in 2019.1 However, to meet the increasing demand for highly efficient, low-cost and environmental friendly energy sources, the development of advanced LIBs based on affordable and sustainable resources is required. For the realization of high-performance batteries, the search for suitable cathode materials and their optimization is of crucial importance, as it is one of the most critical factors.2 Recent attention has shifted towards using organic instead of inorganic cathode materials in search for more light-weight, metal-free and flexible batteries.3–6 In addition, the structural diversity of organic compounds allows to widely tune their electrochemical properties. Organic compounds bearing redox-active functionalities, e.g. carbonyls (quinones, imides, anhydrates),7–22 nitroxyl radicals23–25 or disulfides26,27 are promising candidates due to their typical redox potentials between 2.0 V and 4.0 V vs. Li/Li+ and have been widely studied for this purpose. To overcome dissolution issues, which usually result in capacity decay upon cycling, the redox active sites are often either incorporated into or attached to a polymeric backbone3,4 or larger, rigid groups that reduce solubility in the electrolyte are attached.14–16 Quinones are of special interest for application as cathode material due to their multi-electron redox activity, high energy density and electronic stability.7,10 For example, an exceptionally high capacity of 902 mA h g−1 and 82% capacity retention after 100 cycles at 20 mA g−1 in an ionic liquid electrolyte was reported for cyclohexanehexone.19 Among this class of compounds, pyrene-4,5,9,10-tetraone (PTO) is another outstanding candidate, as all four carbonyl positions can be utilized for the redox process for the uptake of four Li+ ions with a high operating voltage (above 1.5 V). The full redox capability of all four carbonyl groups can be attributed to the stable highest occupied molecular orbital of PTO and the aromaticity upon reduction. Thus, the theoretical capacity of PTO is high (409 mA h g−1).8,12,18 Experimentally a capacity of 360 mA h g−1 was found, however accompanied by low cycling stability due to dissolution.8 Various immobilization attempts of PTO have been studied in recent years (Scheme 1). In 2012 Yoshida and coworkers attached PTO to a polymethacrylate backbone via an amide linkage. The obtained PPYT showed a high capacity of 231 mA h g−1 (88% of the theoretical capacity) and a high capacity retention of 83% after 500 cycles.12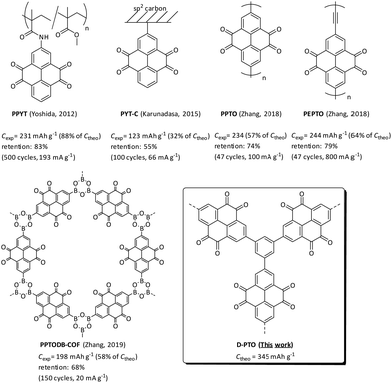 | ||
| Scheme 1 Examples of PTO based materials used as cathodes and corresponding capacities and capacity retentions. | ||
By covalent binding PTO to an sp2-carbon surface (PYT-C), Karunadasa et al. achieved a capacity of 123 mA h g−1 and 55% retention after 100 cycles at 66 mA g−1.13 Two linear polymers PPTO and PEPTO with capacities of 234–244 mA h g−1 (57–64% of theoretical values) and 74–79% retention after 47 cycles were reported by Zhang and coworkers in 2018.18 One year later, a 2D boroxine covalent organic framework (COF) was published by the same group. PPTODB-COF showed a capacity of 198 mA h g−1 (58% of the theoretical value) and 68% retention after 150 cycles at 20 mA g−1.20 Another recently reported pyrene tetraone based COF by Zheng et al. showed reversible capacity of 225 mA h g−1 and an exceptional long-term cyclability (retention rate 98.0% after 10![[thin space (1/6-em)]](https://www.rsc.org/images/entities/char_2009.gif) 000 cycles) in aqueous zink–organic batteries.28 Carbonyl-based composites with carbon nanotubes reached capacities of 438 mA h g−1
000 cycles) in aqueous zink–organic batteries.28 Carbonyl-based composites with carbon nanotubes reached capacities of 438 mA h g−1![[thin space (1/6-em)]](https://www.rsc.org/images/entities/char_2009.gif) 29 and 416 mA h g−1.30 Despite this progress some challenges still remain. Except for PPYT, the experimental capacities are much smaller than theoretically possible and usually reach only little more than 50% of the theoretical capacity, indicating that only half of the redox-active sites are actually utilized. This still leaves room for improvement, as capacities higher than 200 mA h g−1 are desirable.
29 and 416 mA h g−1.30 Despite this progress some challenges still remain. Except for PPYT, the experimental capacities are much smaller than theoretically possible and usually reach only little more than 50% of the theoretical capacity, indicating that only half of the redox-active sites are actually utilized. This still leaves room for improvement, as capacities higher than 200 mA h g−1 are desirable.
Another parameter, which tends to be much lower in organic as compared to inorganic materials, is the rate capability and often slow redox kinetics limits the power density. Both might be attributed to the lack of Li-ion channels in many organic materials that allow efficient ion diffusion.14 Thus, porous structures seem to be beneficial and materials with high surface areas have shown improved device performance, for example in metal organic frameworks (MOFs)5,31–34 or covalent organic frameworks (COFs).5,35–38 In the examples given in Scheme 1 pores could be seen by electron microscopy (EM) imaging for PPYT and for PYT-C a high-surface carbon source was used. PPTODB-COF most likely has channels for Li+ diffusion due to its rigid 2D framework, whereas PPTO and PEPTO are most likely non-porous. However, the porosity of none of those materials was investigated by gas sorption analysis.
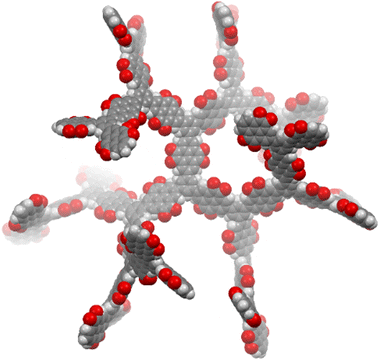
Here we present the synthesis of an insoluble porous dendritic polymer network (D-PTO), where PTO monomers are connected via the meta-positions of a benzene unit. We envisioned, that the rigidity of this structure prevents close-packing, thereby opening up channels for ion and electrolyte diffusion. At the same time, we expected low solubility. The porous structure was simulated by MM2 optimization of an oligomeric cutout (Fig. 1). D-PTO is expected to form a rigid, dendrimer-like structure, where the individual branches form helical channels with an approx. diameter of 1.4 nm. The porosity was investigated by gas sorption and the material was investigated regarding its performance as cathode material in LIBs.
Results and discussion
Synthesis
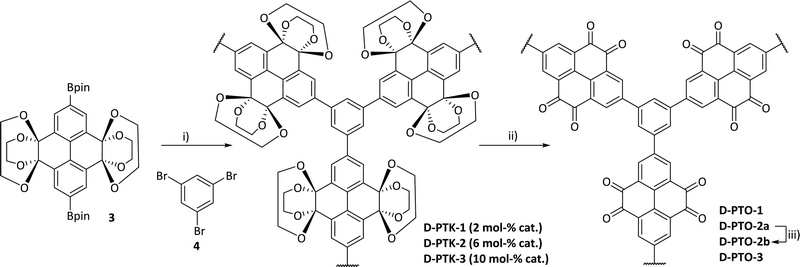
In order to construct a branched, rigid network dendrimeric pyrene tetraketals (D-PTK) were synthesized via Suzuki–Miyaura cross coupling of borylated tetraketale 339 with 1,3,5-tribromo benzene 4 (Scheme 2). After a few minutes of heating, the formation of a large amount of grey solid preventing further stirring was observed (see the ESI† for details). Different catalyst loadings (2%, 6%, 10%) D-PTK-1, -2 and -3, respectively, and from these precursor polymers the corresponding target materials D-PTO-1, -2a and 3 were subsequently obtained via acidic hydrolysis as red powders (see the ESI† for details). D-PTO-2a was further purified by Soxhlet extraction (MeOH, THF, Et2O) to obtain D-PTO-2b. By this procedure remaining pyrene tetraone monomer could be extracted, showing that washing alone was not sufficient to remove unreacted starting material. The prepared D-PTOs were insoluble in common organic solvents, such as MeOH, EtOH, acetone, CHCl3, CH2Cl2, diethyl ether, petroleum ether and water.Optoelectronic characterization of model compounds
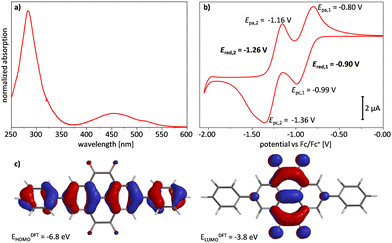
A ketal and a tetraone model compound 1 and 2 (see the ESI†) were synthesized according to a recently published procedure.40 These compounds have a similar structure as the polyketal D-PTK and polytetraone D-PTO respectively, and are soluble in common organic solvents. Therefore, they can be investigated via standard solution-based techniques. Spectroscopic characteristics of the polymers can thus easily be evaluated by comparison with the corresponding model compound. The optoelectronic properties of tetraone 2 were investigated by UV/Vis spectroscopy in CH2Cl2 and liquid-3-electrode cyclic voltammetry (CV) in CH2Cl2 with ferrocene/ferrocenium (Fc/Fc+) as internal standard and quantum-chemical calculations (Fig. 2). The UV/Vis spectrum revealed two absorption maxima at λabs = 283 and 457 nm. From the absorption onset at λonset = 560 nm an optical bandgap of Eg,opt = 2.2 eV was determined. CV revealed two quasi-reversible half-wave reduction potentials at Ered,1 = −0.90 V and Ered,2 = −1.26 V. From the first reduction potential the electron affinity of EA = −3.9 eV was estimated. An ionization potential of IP = −6.1 eV was approximated from the optical bandgap.DFT calculations (B3LYP: 6-311++G**) showed that the HOMO orbital (EHOMO = −6.8 eV) is delocalized over the whole aromatic backbone, while the LUMO orbital (ELUMO = −3.8 eV) is located only on the pyrene tetraone unit.
Polymer analysis and characterization
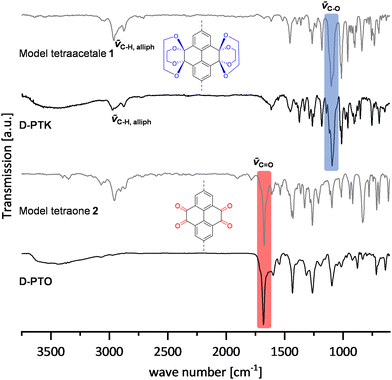
Dendrimer materials were analyzed by 13C MAS NMR spectroscopy, FT-IR spectroscopy (ATR), elemental analysis and X-ray photoelectron spectroscopy (XPS). Further, the materials were investigated by thermogravimetric analysis (TGA), powder X-ray diffraction, SEM and gas sorption measurements.By comparison of FT-IR spectra (Fig. 3), both ketal 1 and the D-PTKs showed similar absorption patterns with characteristic C–H valence vibration bands at ∼2954 cm−1 and 2864 cm−1, indicating the presence of saturated C–H groups. Similarly, an intense band at ∼1098 cm−1 can be attributed to the C–O valence vibration, thus showing the presence of ketal groups. The spectra of tetraone model compound 2 and D-PTO also had very similar peak patterns. An intense band at ∼1672 cm−1 in both spectra proves the presence of carbonyl functions. At the same time the C–H valence vibration bands vanished for D-PTOs, indicating the loss of the ketal units.
D-PTO-2a and its precursor material were investigated by 13C MAS NMR and compared with 13C NMR spectra of model compounds 1 and 2 obtained from solution (Fig. 4). The signal at ∼93 ppm is indicative for the ethylene bridges Ca and can be found in both model compound 1 and D-PTK-2a. After deprotection to D-PTO-2a this signal vanishes almost completely and a new signal at δ = 181.9 ppm, characteristic for the carbonyl carbons Cb, appears. This shows that except some trace amounts, the acid treatment effectively hydrolyzes the ketal groups.
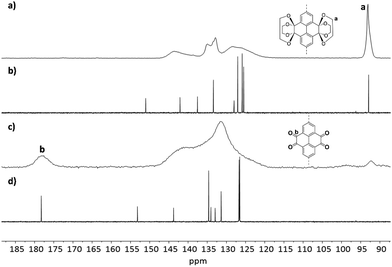 | ||
Fig. 4
13C CP MAS NMR spectra (10![[thin space (1/6-em)]](https://www.rsc.org/images/entities/char_2009.gif) 000 Hz) of D-PTK 2 (a), D-PTO 2a (c) and 13C NMR spectra (CDCl3, 150 MHz) of model compounds 1 (b) and 2 (d). 000 Hz) of D-PTK 2 (a), D-PTO 2a (c) and 13C NMR spectra (CDCl3, 150 MHz) of model compounds 1 (b) and 2 (d). | ||
The elemental composition and purity of the D-PTO materials was determined by elemental analysis and XPS measurements. For D-PTO-1 trace residues of two different Pd species from residual catalyst traces and bromide (below 1% each) were found, indicating that some bromide groups remained unreacted (Fig. S5 and Table S3, ESI†). The elemental analysis for carbon and hydrogen is in good agreement with the theoretical values, when adsorbed water is considered. XPS measurement on D-PTO-2 and D-PTO-3 showed no traces of Pd, and also no bromide could be found (Fig. S6–S8 and Tables S4–S6, ESI†), indicating that lower catalyst loading is beneficial for material purity. Boron containing species (1.49%) found in D-PTO-2a could be completely removed by Soxhlet extraction. The extraction step is therefore also beneficial for the degree of purity.
All D-PTOs were characterized by TGA under nitrogen atmosphere. Decomposition of the materials were observed in between 285–312 °C, after an initial weight loss up to ∼100 °C due to solvent evaporation. The decomposition temperature did not show a clear correlation to reaction conditions (i.e., catalyst loading) and differ for each batch. Table 1 and Fig. 5 summarize the properties of the prepared materials.
| # | Sample | T decomp [°C] | SABET [m2 g−1] | SALangmuir [m2 g−1] | d Pore,max [nm] | V Pore [cm3 g−1] | V mikro [cm3 g−1] | S mikro [%] |
|---|---|---|---|---|---|---|---|---|
| a Decomposition temperature determined by TGA under N2 atmosphere with 10 K min−1. b Determined by QS-DFT (Kernel: N2 on carbon at 77 K, sphere/cylindrical pores). c Determined by t-plot method. d Determined by t-plot method as (SAmicro/SABET) 100. | ||||||||
| 1 | D-PTO-1 | 285 | 290 | 333 | 0.67 | 0.187 | 0.070 | 59 |
| 2 | D-PTO-2a | n.d. | 472 | 531 | 1.27 | 0.264 | 0.136 | 71 |
| 3 | D-PTO-2b | 301 | 537 | 612 | 1.22 | 0.306 | 0.146 | 67 |
| 4 | D-PTO-3 | 312 | 676 | 767 | 1.26 | 0.325 | 0.219 | 78 |
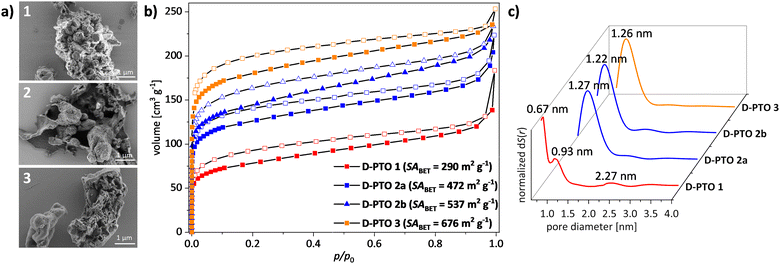
The morphology and crystallinity of D-PTO was investigated using SEM imaging (Fig. 5a) and PXRD (Fig. S10, ESI†). Both methods reveal that the D-PTOs are mostly amorphous (see the ESI†). However, D-PTO-1 shows two peaks at 2θ = 40 and 46°, which are either absent or very weak in the other materials.
Gas sorption analysis with nitrogen at 77 K of D-PTO-1 showed a type-I-isotherm with a specific surface area (BET)41 of SABET = 290 m2 g−1, revealing the porous nature of the material (Fig. 5b and c). By QS-DFT calculation (Kernel: N2 on carbon at 77 K, sphere/cylindrical pores, adsorption branch, fitting error: 0.420%)42,43 a pore diameter of dpore,max = 0.67 nm is obtained (Fig. 5c). The microporous surface area is 59% of the overall surface area as calculated by the t-plot method44–46 with a pore volume of Vpore,micro = 0.07 cm3 g−1.
For D-PTO-2a an increased specific surface area of SABET = 472 m2 g−1 with a doubling in pore diameter (dpore,max = 1.27 nm) compared to D-PTO-1 was found (Kernel: N2 on carbon at 77 K, sphere/cylindrical pores, adsorption branch, fitting error: 0.755%). A larger fraction of microporous surface area (71%) and an increased pore volume (Vpore,micro = 0.136 cm3 g−1) was estimated. D-PTO-2b, which was prepared from D-PTO-2avia Soxhlet extraction, shows a slightly increased specific surface area (SABET = 537 m2 g−1), and pore volume (Vpore,micro = 0.146 cm3 g−1). The pore diameter (Kernel: N2 on carbon at 77 K, sphere/cylindrical pores, adsorption branch, fitting error: 1.033%) was slightly decreased (dpore,max = 1.22 nm), as well as the microporous surface fraction (67%).
Finally, for D-PTO3 again an increase in specific surface area (SABET = 677 m2 g−1) was measured and a similar pore diameter as D-PTOs 2a and 2b (dpore,max = 1.26 nm) was found (Kernel: N2 on carbon at 77 K, sphere/cylindrical pores, adsorption branch, fitting error: 1.486%). The material shows the highest microporous pore volume (Vpore,micro = 0.219 cm3 g−1) and surface fraction (78%) of all materials presented at hand. On first glance, these findings indicate that reducing catalyst loading improves the surface properties in terms of higher specific surface area, larger pore volume and microporous fractions. However, in control experiments batch-to-batch variations occur, depending on the overall experimental conditions. Table 1 summarizes the gas sorption data.
Electrochemical characterization and battery studies of the solid state D-PTO electrodes
In pyrene–tetraone-based cathode materials the carbonyl groups provide redox active sites for Li-ion storage, each of which can take up one electron upon reduction to adopt an anionic state that is balanced by a Li-cation.8 The process is chemically reversible as the reduced oxy units can release electrons as well as the Li-ions and return to the neutral state (Scheme 3). | ||
| Scheme 3 Redox mechanism of pyrene tetraone.8 | ||
Assuming that each carbonyl unit can uptake one electron, the maximum capacity of PTO is 409 mA h g−1, whereas 360 mA h g−1 were achieved experimentally by Liang et al.8 Due to its slightly higher molecular weight, the theoretical maximum capacity of D-PTO is 345 mA h g−1. Electrodes were fabricated from D-PTO-2a, -2b and -3 (see the ESI† for details) and electrochemical studies were performed using Swagelok-type two-electrode cells.47
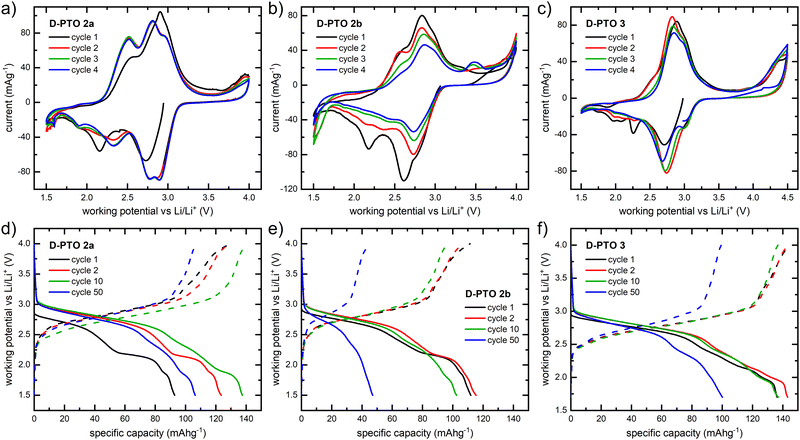
2-Electrode half-cell cyclic voltammograms were recorded in a potential range between 1.5 and 4 V (4.5 V in case of D-PTO-3) (Fig. 6). The cyclic voltammogram of the composite electrode of D-PTO-2a shows two clear redox pairs located at 2.42 and 2.85 V vs. Li/Li+, with overpotentials of 0.1 and 0.02 V, respectively (Fig. 6a). This indicates a two-step redox process, similar to what is found in the CVs on model compound 2 (see Fig. 2).
The redox pair at 2.8 V splits into a two-step process after the first cycle, indicating changes of electrochemical properties at the polymer–carbon interface. Similarly, for D-PTO-2b two pairs of separated redox peaks are observed as well (Fig. 6b). The intensity of the redox peaks decreases upon cycling, which indicates degradation of the redox active sites. The origin of this degradation is unclear, especially since it is occurring only for D-PTO-2b and not with D-PTO-2a. At the same time, for both materials the overpotential of the redox pair decreases to approximately 0.1 V after the first cycle. This might be rationalized by a conformational rearrangement of the dendritic structure during the first cycle, which increases π-stacking between D-PTO and carbon black and thus improves bulk conductivity.
The oxidation peak at 3.8 V and reduction peak at 1.5 V are consistent with the redox activity observed in the precursor dendrimer D-PTK. Traces of residual tetraketal units, arising from incomplete hydrolysis in the second step of the synthesis (see Scheme 1) have already been observed in the solid state 13C NMR spectroscopy (Fig. 4) and can thus be expected to be seen in the CVs as well. For D-PTO-3 only one highly reversible redox peak pair at 2.8 V with a low overpotential of 0.05 V is found (Fig. 6c). During cycling the oxidation peak splits into two signals similar to what is observed for the other two materials.
The charge and discharge curves of the D-PTO composite electrodes were obtained at a current density of 100 mA g−1 in the potential range between 1.5 V (for D-PTO-3 1.7 V) and 4 V (Fig. 6d–f). D-PTO-2a shows discharge plateaus at 2.3 V and 2.9 V vs. Li/Li+, which corresponds well with the reduction peaks in the CV curves. The specific discharge capacity amounts up to 123 mA h g−1 in the second cycle and reaches a maximum of 137 mA g−1 in cycle 11, which can be attributed to the expansion of transfer channels for Li cations and the π-stacking effect. Assuming a theoretical capacity of D-PTO of 345 mA h g−1, approximately 0.40 Li+ ions are taken up per tetraone unit in cycle 2. After 50 cycles, the capacity is reduced to approx. 106 mA h g−1, which corresponds to a retention of 86% relative to the capacity in the second cycle. The charge–discharge profiles of D-D-PTO-2b (Fig. 6e) shows two broad discharge plateaus at 2.7 V and 2.2 V, corresponding well with reduction peaks in the CV curve. There is a narrow discharge plateau at 1.8 V, consistent with the small peak at 1.9 V in the cyclic voltammogram. One broad charge plateau between 2.5 V and 3.0 V is observed, in agreement with the oxidation signals from CV. The specific discharge capacity in the second cycle amounts to 115 mA h g−1, corresponding to a utilization of the carbonyl groups in the redox process of approx. 33%. The capacity retention is 41% (47 mA h g−1) after 50 cycles.
The highest capacity is measured for the D-PTO-3 composite cathode which features 143 mA h g−1 in the second discharge cycle. This implies that approx. 41% of the carbonyl groups are utilized in the redox process. However, a continuous decay occurs upon cycling with a capacity retention of 70% (100 mA h g−1) after 50 cycles.
Table 2 summarizes the main parameters describing the electrochemical performance of the composite electrode in Li-ion half-cells. The D-PTO-2a electrode exhibits the best performance overall, especially regarding the cycling stability seen in the CV curves and was thus examined in more detail. In order to interpret the redox behaviour of the electrode in more detail, cyclic voltammetry measurements were conducted in different potential ranges on the same electrode in subsequent cycles.
The initial six cycles were performed in the range 2.5–3.5 V where only one redox pair is observed. The working window was then expanded to 1.5–4.0 V in cycles 7 and 8 and then narrowed down to 2.5–3.5 V again in cycles 9 and 10 (Fig. S13, ESI†). In both voltage ranges splitting of the peaks is observed. This finding reveals a dependence of the redox behaviour on the applied voltage range. The splitting of the redox pair at 2.8 V relates to the underlying process of the redox pair at 2.4 V since it only occurs after cycling to lower voltages.
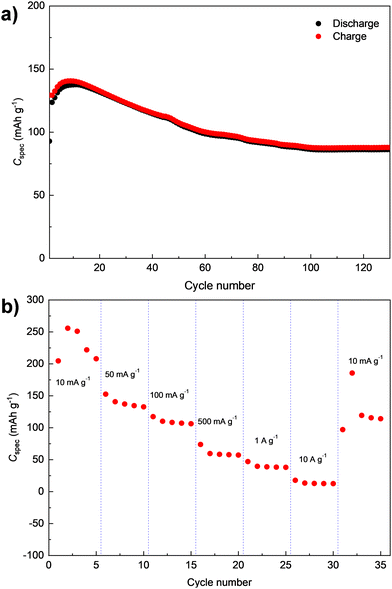
The cycling stability of D-PTO-2a was further investigated by a long-term galvanostatic cycling measurement at 100 mA g−1 for 130 cycles (Fig. 7a). Similar to what is observed in Fig. 6d, the specific discharge capacity initially increases before starting to fade after cycle 10 (cf.Fig. 6d). In addition, the data imply moderate fading for the subsequent 90 cycles before a rather stable capacity level is reached. Even after 130 cycles, a discharge capacity of 86 mA h g−1 is measured, which corresponds to a capacity retention of 70% relative to the second cycle. The results of the corresponding rate capability test for D-PTO-2a are shown in Fig. 7b. The material delivers average capacities of 225, 140, 110, 52, 41, and 15 mA h g−1 at current densities of 10, 50, 100, 500, 1000 and 10![[thin space (1/6-em)]](https://www.rsc.org/images/entities/char_2009.gif) 000 mA g−1, respectively (Fig. 7b). A recovered capacity of 120 mA h g−1 is achieved when the current density is reverted back to 10 mA g−1.
000 mA g−1, respectively (Fig. 7b). A recovered capacity of 120 mA h g−1 is achieved when the current density is reverted back to 10 mA g−1.
To relate the electrochemical performance of the here presented D-PTO-2a to the literature, Table 3 lists the electrochemical performances of various organic cathode materials. The comparison clearly shows that the D-PTO-2a competes well with different quinones as well as other redox-active polymers as it exhibits comparable initial discharge capacity and retention after 50 cycles.
| Group | Material | Potential range vs. Li/Li+ (V) | Current density (mA h g−1) | Initial discharge capacity (mA h g−1) | Retention/cycle no. | Ref. |
|---|---|---|---|---|---|---|
| Values marked with *are read off from the graphs. | ||||||
| Quinones | D-PTO | 1.5–4.0 | 100 | 137 | 86%/50 | This work |
| PPYT | 1.5–3.5 | 263 | 231 | 94%*/50 | 8 | |
| PYT-C | 1.5–3.4 | 74 | 123 | 65%*/50 | 9 | |
| PPTO | 1.5–3.5 | 100 | 234 | 74%/47 | 10 | |
| Imides | PTCDA-HP | 1.5–3.5 | 110 | 130 | 84%/50 | 15 |
| Carbonyl derivatives | N-Cyanamide | 1.8–3.2 | 207 | 137 | 89%*/50 | 20 |
| Thioether | PPDT | 1.4–4.0 | 50 | 180 | 70%/20 | 31 |
| Triphenylamines | PPT1N | 2.6–4.5 | 20 | 129 | 91%/50 | 39 |
| TEMPO | PTMA | 3.0–4.0 | 111 | 133 | 90%*/50 | 43 |
Conclusion
Redox active, insoluble pyrene tetraone dendrimers have been synthesized via a two-step synthesis route of Suzuki–Miyaura cross coupling of the borylated precursor 3 followed by acidic hydrolysis.The prepared amorphous materials show BET surfaces between 290 and 676 m2 g−1. The materials were used to fabricate composite electrodes, which were investigated regarding their electrochemical performance in lithium-ion secondary batteries. Specific capacities of up to 137 mA h g−1 and a capacity retention of 86% after 50 cycles were measured. Moreover, favorable kinetics with high reversibility of the redox processes were observed. The results show that connecting the PTO monomers via the meta-positions of a benzene unit is a successful strategy to overcome the dissolution issue of PTO. The cycling stability of the as-prepared D-PTO is significantly improved compared to PTO.8 In comparison to most other PTO-based materials (Scheme 1) the as-prepared D-PTO is also more cycle stable. Only the PPYT prepared by Yoshida and coworkers by attaching the PTO to a polymethacrylate backbone via an amide linkage, exhibits even higher cycling stability.12 However, the low carbonyl utilization of only 40% still leaves room for improvement of the specific capacity.
Conflicts of interest
There are no conflicts to declare.Acknowledgements
The authors are grateful to Deutsche Forschungsgemeinschaft supporting this project (within the collaborative research center SFB1249 “N-heteropolycyclic compounds as functional materials” (TP-A04, TP-B02 and TP-B05).Notes and references
- Press release: The Nobel Prize in Chemistry, 2019.
- M. Kotal, S. Jakhar, S. Roy and H. K. Sharma, J. Energy Storage, 2022, 47, 103534 CrossRef.
- Y. Liang, Z. Tao and J. Chen, Adv. Energy Mater., 2012, 2, 742–769 CrossRef CAS.
- Z. Song and H. Zhou, Energy Environ. Sci., 2013, 6, 2280–2301 RSC.
- L. Kong, M. Zhong, W. Shuang, Y. Xu and X.-H. Bu, Chem. Soc. Rev., 2020, 49, 2378–2407 RSC.
- H. Lyu, X.-G. Sun and S. Dai, Adv. Energy Sustainability Res., 2021, 2, 2000044 CrossRef CAS.
- Z. Song, H. Zhan and Y. Zhou, Angew. Chem., Int. Ed., 2010, 49, 8444–8448 CrossRef CAS PubMed.
- Y. Liang, P. Zhang and J. Chen, Chem. Sci., 2013, 4, 1330–1337 RSC.
- B. Häupler, A. Wild and U. S. Schubert, Adv. Energy Mater., 2015, 5, 1402034 CrossRef.
- X. Han, C. Chang, L. Yuan, T. Sun and J. Sun, Adv. Mater., 2007, 19, 1616–1621 CrossRef CAS.
- S. Renault, J. Geng, F. Dolhem and P. Poizot, Chem. Commun., 2011, 47, 2414–2416 RSC.
- T. Nokami, T. Matsuo, Y. Inatomi, N. Hojo, T. Tsukagoshi, H. Yoshizawa, A. Shimizu, H. Kuramoto, K. Komae, H. Tsuyama and J.-i Yoshida, J. Am. Chem. Soc., 2012, 134, 19694–19700 CrossRef CAS PubMed.
- A. Jaffe, A. Saldivar Valdes and H. I. Karunadasa, Chem. Mater., 2015, 27, 3568–3571 CrossRef CAS.
- D. Chen, A.-J. Avestro, Z. Chen, J. Sun, S. Wang, M. Xiao, Z. Erno, M. M. Algaradah, M. S. Nassar, K. Amine, Y. Meng and J. F. Stoddart, Adv. Mater., 2015, 27, 2907–2912 CrossRef CAS PubMed.
- S. K. M. Nalluri, Z. Liu, Y. Wu, K. R. Hermann, A. Samanta, D. J. Kim, M. D. Krzyaniak, M. R. Wasielewski and J. F. Stoddart, J. Am. Chem. Soc., 2016, 138, 5968–5977 CrossRef CAS PubMed.
- Z. Luo, L. Liu, Q. Zhao, F. Li and J. Chen, Angew. Chem., Int. Ed., 2017, 56, 12561–12565 CrossRef CAS PubMed.
- D. J. Kim, K. R. Hermann, A. Prokofjevs, M. T. Otley, C. Pezzato, M. Owczarek and J. F. Stoddart, J. Am. Chem. Soc., 2017, 139, 6635–6643 CrossRef CAS PubMed.
- J. Xie, W. Chen, G. Long, W. Gao, Z. J. Xu, M. Liu and Q. Zhang, J. Mater. Chem. A, 2018, 6, 12985–12991 RSC.
- Y. Lu, X. Hou, L. Miao, L. Li, R. Shi, L. Liu and J. Chen, Angew. Chem., Int. Ed., 2019, 58, 7020–7024 CrossRef CAS.
- C.-J. Yao, Z. Wu, J. Xie, F. Yu, W. Guo, Z. J. Xu, D.-S. Li, S. Zhang and Q. Zhang, ChemSusChem, 2020, 13, 2457–2463 CrossRef CAS PubMed.
- S. Lei, Y. Dong, Y. Dou, X. Zhang, Q. Zhang and Y. Yang, Mater. Adv., 2021, 2, 5785–5790 RSC.
- X. Liu, S. Qiu, P. Mei, Q. Zhang and Y. Yang, J. Mater. Sci., 2021, 56, 3900–3910 CrossRef CAS.
- K. Oyaizu and H. Nishide, Adv. Mater., 2009, 21, 2339–2344 CrossRef CAS.
- T. Janoschka, M. D. Hager and U. S. Schubert, Adv. Mater., 2012, 24, 6397–6409 CrossRef CAS PubMed.
- K. Nakahara, K. Oyaizu and H. Nishide, Chem. Lett., 2011, 40, 222–227 CrossRef CAS.
- N. Oyama, T. Tatsuma, T. Sato and T. Sotomura, Nature, 1995, 373, 598–600 CrossRef CAS.
- S.-R. Deng, L.-B. Kong, G.-Q. Hu, T. Wu, D. Li, Y.-H. Zhou and Z.-Y. Li, Electrochim. Acta, 2006, 51, 2589–2593 CrossRef CAS.
- S. Zheng, D. Shi, D. Yan, Q. Wang, T. Sun, T. Ma, L. Li, D. He, Z. Tao and J. Chen, Angew. Chem., Int. Ed., 2022, 61, e202117511 CAS.
- X.-X. Luo, W.-H. Li, H.-J. Liang, H.-X. Zhang, K.-D. Du, X.-T. Wang, X.-F. Liu, J.-P. Zhang and X.-L. Wu, Angew. Chem., Int. Ed., 2022, 61, e202117661 CAS.
- G.-P. Yang, X.-X. Luo, Y.-F. Liu, K. Li and X.-L. Wu, ACS Appl. Mater. Interfaces, 2021, 13, 46902–46908 CrossRef CAS PubMed.
- M. Nagarathinam, K. Saravanan, E. J. H. Phua, M. V. Reddy, B. V. R. Chowdari and J. J. Vittal, Angew. Chem., Int. Ed., 2012, 51, 5866–5870 CrossRef CAS PubMed.
- K. Wada, K. Sakaushi, S. Sasaki and H. Nishihara, Angew. Chem., Int. Ed., 2018, 57, 8886–8890 CrossRef CAS PubMed.
- S. Gu, Z. Bai, S. Majumder, B. Huang and G. Chen, J. Power Sources, 2019, 429, 22–29 CrossRef CAS.
- K. Zhang, T. H. Lee, B. Bubach, M. Ostadhassan, H. W. Jang, J.-W. Choi and M. Shokouhimehr, RSC Adv., 2019, 9, 21363–21370 RSC.
- S.-Y. Li, W.-H. Li, X.-L. Wu, Y. Tian, J. Yue and G. Zhu, Chem. Sci., 2019, 10, 7695–7701 RSC.
- S. Haldar, K. Roy, S. Nandi, D. Chakraborty, D. Puthusseri, Y. Gawli, S. Ogale and R. Vaidhyanathan, Adv. Energy Mater., 2018, 8, 1702170 CrossRef.
- C. R. DeBlase, K. Hernández-Burgos, K. E. Silberstein, G. G. Rodríguez-Calero, R. P. Bisbey, H. D. Abruña and W. R. Dichtel, ACS Nano, 2015, 9, 3178–3183 CrossRef CAS PubMed.
- S. Wang, Q. Wang, P. Shao, Y. Han, X. Gao, L. Ma, S. Yuan, X. Ma, J. Zhou, X. Feng and B. Wang, J. Am. Chem. Soc., 2017, 139, 4258–4261 CrossRef CAS PubMed.
- J. Merz, M. Dietz, Y. Vonhausen, F. Wöber, A. Friedrich, D. Sieh, I. Krummenacher, H. Braunschweig, M. Moos, M. Holzapfel, C. Lambert and T. B. Marder, Chem. – Eur. J., 2020, 26, 438–453 CrossRef CAS PubMed.
- L. Ueberricke, D. Mizioch, F. Rominger and M. Mastalerz, Eur. J. Org. Chem., 2021, 4816–4823 CrossRef CAS.
- S. Brunauer, P. H. Emmett and E. Teller, J. Am. Chem. Soc., 1938, 60, 309–319 CrossRef CAS.
- A. V. Neimark, Y. Lin, P. I. Ravikovitch and M. Thommes, Carbon, 2009, 47, 1617–1628 CrossRef CAS.
- G. Y. Gor, M. Thommes, K. A. Cychosz and A. V. Neimark, Carbon, 2012, 50, 1583–1590 CrossRef CAS.
- G. Halsey, J. Chem. Phys., 1948, 16, 931–937 CrossRef CAS.
- J. H. de Boer, B. G. Linsen and T. J. Osinga, J. Catal., 1965, 4, 643–648 CrossRef CAS.
- J. H. de Boer, B. G. Linsen, T. van der Plas and G. J. Zondervan, J. Catal., 1965, 4, 649–653 CrossRef CAS.
- C. Jähne, C. Neef, C. Koo, H.-P. Meyer and R. Klingeler, J. Mater. Chem. A, 2013, 1, 2856–2862 RSC.
Footnote |
| † Electronic supplementary information (ESI) available. See DOI: https://doi.org/10.1039/d2ma01039a |
| This journal is © The Royal Society of Chemistry 2023 |

