 Open Access Article
Creative Commons Attribution 3.0 Unported Licence
Co-precipitation of Mg-doped Ni0.8Co0.1Mn0.1(OH)2: effect of magnesium doping and washing on the battery cell performance
Petteri
Laine
ab,
Marianna
Hietaniemi
ac,
Juho
Välikangas
a,
Toni
Kauppinen
ab,
Pekka
Tynjälä
ab,
Tao
Hu
 a,
Shubo
Wang
 d,
Harishchandra
Singh
 d and
Lassi
Ulla
 *ab
*ab
aUniversity of Oulu, Research Unit of Sustainable Chemistry, P.O. Box 3000, FI-90014 University of Oulu, Finland. E-mail: ulla.lassi@oulu.fi; Tel: +358400294090
bUniversity of Jyvaskyla, Kokkola University Consortium Chydenius, Talonpojankatu 2B, FI-67100 Kokkola, Finland
cUmicore Finland Oy, FI-67100 Kokkola, Finland
dUniversity of Oulu, Research Unit of Nano and Molecular Systems, P.O. Box 3000, FI-90014 University of Oulu, Finland
First published on 4th January 2023
Abstract
Co-precipitation of Ni0.8Co0.1Mn0.1(OH)2 (NCM811) and Mg-doped (0.25 wt% and 0.5 wt%) NCM811 precursors is carried out from concentrated metal sulphate solutions. In this paper, the aim is to study the role of magnesium dopant in the co-precipitation step of NCM811, the cathode active material and further the Li-ion battery cell performance. Based on the results, magnesium was fully co-precipitated in the NCM811 precursors, as expected from thermodynamic calculations. The presence of magnesium in these precursors was also confirmed by several characterization methods and magnesium was evenly distributed in the sample. It was observed that tapped density decreased and surface area increased with an expected increase in Mg content. Surprisingly, Mg doping did not improve the cyclability of coin cells, due to the stable crystal structure of NCM811. However, a slight improvement in cyclability was seen in pouch cells after 1000 cycles. A washing effect was clearly seen in lattice parameters and washing also decreased the capacity retention after 62 cycles for all samples.
1. Introduction
Global climate change-driven mobility transformation initiatives in the EU area have set targets to reduce the amount of conventionally fueled vehicles in urban transport by 50 per cent by 2030.1 Electric vehicles (EVs) are seen as an integral part of achieving these goals, as their proportion of global traffic is projected to increase tenfold by 2030.2 This increases the demand to develop advanced battery materials that are affordable, safe to use, environmentally benign and possess high performance characteristics.2 In order to fulfill these demands, various emerging technologies and cathode material alternatives as well as synthesis strategies to replace lithium-ion NCM batteries (LIB) have been suggested, such as anode tuning,3 sulphur-based,4,5 sodium-ion6–8 and magnesium-ion batteries.9 However, it has been estimated that NCM-type active materials, such as LiNi0.8Co0.1Mn0.1O2 (NCM811), will remain highly relevant cathode materials in EV batteries until approximately 2030,2,10,11 the co-precipitation route being the most likely synthesis method.2 Therefore, the study and optimization of simple, affordable and scalable high-volume synthesis methods, such as co-precipitation, calcination and washing, for NCM cathode active materials remains highly relevant.Recently, NCM cathode chemistries have been developed towards lower cobalt and increased nickel content of cathode-active materials to achieve higher specific capacities and lower costs. NCM811 can deliver a discharge capacity of 200 mA h g−1 in the voltage range of 3.0–4.3 V at a 0.1C rate in the first 60 cycles.12 However, this has led to new challenges, i.e., lower stability and capacity fading of high-nickel NCM materials. Nickel tends to mix with the lithium layer and vice versa (cation mixing), which occurs during material synthesis and electrochemical cycling. This makes it difficult to produce high-nickel layered oxide materials, such as NCM811 or LiNiO2, with a stoichiometric Li![[thin space (1/6-em)]](https://www.rsc.org/images/entities/char_2009.gif) :
:![[thin space (1/6-em)]](https://www.rsc.org/images/entities/char_2009.gif) Ni ratio.13 Secondly, when the lithium content of the cathode material is low, it becomes unstable.14 Therefore, doping elements or coating of particles are needed.
Ni ratio.13 Secondly, when the lithium content of the cathode material is low, it becomes unstable.14 Therefore, doping elements or coating of particles are needed.
Magnesium is a doping element, which is used in the co-precipitation of high-nickel NCM precursors. It has a positive impact on electrochemical properties by suppressing cation mixing and stabilizing the structure of the cathode material. This stabilization effect is generally attributed to magnesium's ability to enter lithium sites in the layered structure. From this position, electrochemically inactive magnesium atoms provide support for the layered structure by facilitating cycling-induced phase changes that cause contraction and expansion of the unit cell.15,16 The presence of magnesium also enables more efficient Li+ transfer by increasing the activation barrier.17 Earlier, Weng et al.18 investigated the influence of Mg doping on the NCM111 cathode material. They synthesized Li[Ni1/3Co1/3Mn1/3]1−xMgxO2 (x = 0; 0.01; 0.025; 0.05) cathode materials by adding MgSO4 dopant during the co-precipitation process. Co-precipitated materials showed spherical particle morphology. The study of electrochemical properties showed that the increasing Mg2+ content decreased the reversible capacities of Mg-doped cathode materials. A low concentration of Mg (x ≤ 0.01) was found to improve the cycling performance; however, the higher concentration of Mg (x ≥ 0.025) led to a loss of capacity and cyclability. This was attributed to the inhomogeneous distribution of Mg2+ ions in these materials. The authors concluded that if the concentration of Mg2+ was below 360 mg L−1 in the feed solution, the presence of magnesium in the cathode material remained below an acceptable concentration level (x ≤ 0.01). Thus, it did not have a significant impact on the overall performance of the cathode active material.
Huang et al. (2015)17 studied the effect of Mg doping on NCM622 by co-precipitation using different Mg contents. They observed that the initial discharge capacity decreased slightly with an increase in Mg doping compared to the pristine NCM622 sample. The capacity retention after cycling, however, was found to improve with modest Mg doping. In addition to improved cycling stability, Mg doping had a positive impact on the rate capability. Cycling five times at a rate of 5C indicated an increase in the capacity from 103 mA h g−1 for the pristine sample to 122 mA h g−1 for the sample with an Mg molar ratio of 0.01. With increasing Mg molar ratio, a significant reduction was detected, even below the pristine sample. Huang et al. (2015)17 also found that magnesium doping results in a primary particle size of ∼200 nm in the cathode material with suppressed agglomeration of secondary particles. This enhances the Li+ migration. Magnesium and lithium are similar in size (0.72 Å vs. 0.76 Å), which can lead to the partial substitution of lithium by magnesium. This can have a positive impact on cation mixing, where Ni occupies Li sites, decreasing cation mixing, which in turn improves the cycling stability. However, when the Mg content increases further, the increasing Mg substitution of Li starts to hinder the diffusion of Li during the charging cycles and leads to poor rate capability. Mg substitution of the active Ni ions on the other hand decreases the capacity.17
Washing of lithiated cathode materials is also known to affect the battery cell performance. Washing is typically done to confirm the amount of lithium in the structure. In our previous studies, the washing effect over Co-free LNO as high-capacity cathode active material was investigated. It was observed that the capacity of the unwashed sample was higher compared with the washed LNO sample at the beginning but decreased quickly.19 A high residual lithium amount in the cathode is known to introduce reactions with the electrolyte and produce gases, leading to poor contact inside the battery cell.20–22 In another study,23 the effect of washing was evaluated over NCM622 cathode active materials. It was observed that water had a detrimental effect on the cathode surface structure, which was seen as decreased cycle retention after the washing.24,25 This was, however, also affected by the density of the particles (low-density particles had better capacity retention than high-density particles).
In this research, the effect of magnesium dopant on the synthesis and electrochemical properties of LiNi0.8Co0.1Mn0.1O2 (NCM811) cathode material is studied. Further, the effect of washing on the electrochemical performance is considered.
2. Experimental
2.1 Raw materials and solutions for co-precipitation
In this research, co-precipitation of NCM811 was studied using three different target concentrations (0 wt%, 0.25 wt% and 0.5 wt%) of magnesium. The composition of the solid and liquid samples was determined using ICP-OES (Agilent 5110 VDV ICP-OES) and ICP-MS (Agilent 8900) analyses. ICP-OES analysis was performed until the solid precipitated, and the corresponding Li![[thin space (1/6-em)]](https://www.rsc.org/images/entities/char_2009.gif) :
:![[thin space (1/6-em)]](https://www.rsc.org/images/entities/char_2009.gif) Ni
Ni![[thin space (1/6-em)]](https://www.rsc.org/images/entities/char_2009.gif) :
:![[thin space (1/6-em)]](https://www.rsc.org/images/entities/char_2009.gif) Co
Co![[thin space (1/6-em)]](https://www.rsc.org/images/entities/char_2009.gif) :
:![[thin space (1/6-em)]](https://www.rsc.org/images/entities/char_2009.gif) Mn ratio was determined. Microwave-assisted digestion was used for total dissolution of the samples without any leaching residue. This was based on the EPA3051A standard using nitric acid
Mn ratio was determined. Microwave-assisted digestion was used for total dissolution of the samples without any leaching residue. This was based on the EPA3051A standard using nitric acid![[thin space (1/6-em)]](https://www.rsc.org/images/entities/char_2009.gif) :
:![[thin space (1/6-em)]](https://www.rsc.org/images/entities/char_2009.gif) hydrochloric acid with a ratio of 3
hydrochloric acid with a ratio of 3![[thin space (1/6-em)]](https://www.rsc.org/images/entities/char_2009.gif) :
:![[thin space (1/6-em)]](https://www.rsc.org/images/entities/char_2009.gif) 1 as the solvent.
1 as the solvent.
2.2 Co-precipitation and lithiation of NCM811
2 M MeSO4 solutions with and without magnesium were prepared from industrial-grade raw materials. MeSO4 solutions also contained 0, 0.25 wt% and 0.5 wt% Mg. Sample names refer to the amount of magnesium in metal sulfate solutions, precursors and lithiated cathode materials. Co-precipitation experiments were carried out in a continuous-flow stirred tank reactor. Precursor hydroxides were co-precipitated by pumping 2 M MeSO4, 5 M NaOH and 25 wt% NH4OH solutions into the reactor. The pH of the reactor was kept constant by adjusting the feeding rate of NaOH. An overhead stirrer at 1100 rpm mixed the reactor content. After a total precipitation time of 24 h, the reaction was stopped and solid precursor particles were separated by vacuum filtration. The obtained powder was then washed with an excess of ion exchanged water. Washed NCM811 precursors were dried in a vacuum oven at 60 °C overnight.Dried NCM811 hydroxide precursors (sieved <25 μm) were mixed with LiOH in the molar ratio of Li![[thin space (1/6-em)]](https://www.rsc.org/images/entities/char_2009.gif) :
:![[thin space (1/6-em)]](https://www.rsc.org/images/entities/char_2009.gif) (Ni0.8Co0.1Mn0.1) 1.04
(Ni0.8Co0.1Mn0.1) 1.04![[thin space (1/6-em)]](https://www.rsc.org/images/entities/char_2009.gif) :
:![[thin space (1/6-em)]](https://www.rsc.org/images/entities/char_2009.gif) 1. LiOH excess was used to compensate for the lithium loss during the high-temperature calcination and to ensure homogeneous lithiation. The Li
1. LiOH excess was used to compensate for the lithium loss during the high-temperature calcination and to ensure homogeneous lithiation. The Li![[thin space (1/6-em)]](https://www.rsc.org/images/entities/char_2009.gif) :
:![[thin space (1/6-em)]](https://www.rsc.org/images/entities/char_2009.gif) Ni0.8Co0.1Mn0.1 mixture was calcined under O2 flow with a heating ramp of 2.5 °C min−1 and a holding time of 6 h at 800 °C. Calcined material was milled and sieved to <40 μm in dry room conditions. Residual lithium was washed from the surface of the samples with a certain amount of de-ionized water and the samples were dried in a vacuum oven. The samples were named as shown in Table 1.
Ni0.8Co0.1Mn0.1 mixture was calcined under O2 flow with a heating ramp of 2.5 °C min−1 and a holding time of 6 h at 800 °C. Calcined material was milled and sieved to <40 μm in dry room conditions. Residual lithium was washed from the surface of the samples with a certain amount of de-ionized water and the samples were dried in a vacuum oven. The samples were named as shown in Table 1.
| Sample | ||
|---|---|---|
| NCM811 | Unwashed | |
| NCM811-WD | Washed | |
| NCM811-25Mg | 0.25 wt% Mg | Unwashed |
| NCM811-25Mg-WD | 0.25 wt% Mg | Washed |
| NCM811-50Mg | 0.5 wt% Mg | Unwashed |
| NCM811-50Mg-WD | 0.5 wt% Mg | Washed |
2.3 Characterization of the precursors and cathode powders
The tapped density of powders was measured using an Erweka SVM222 tapped density device according to the ISO EN 787/11 standard. The residual lithium content was determined with an automatic titrator. The particle size distribution (PSD) during the co-precipitation was determined using a Malvern Mastersizer 3000 (Malvern Panalytical) instrument.Synchrotron X-ray measurements of the samples (listed in Table 1) were carried out at the Brockhouse High Energy Wiggler Beamline,26 Canadian Light Source (CLS), Canada. A 2D PerkinElmer detector, 200 × 200 μm2 pixel size and 40 × 40 cm2 in area, was placed downstream of the powders in Kapton capillary, allowing data acquisition in transmission mode. Synchrotron X-ray diffraction (SXRD) patterns were acquired using a monochromatic focused beam of 30 keV. The calibrated X-ray wavelength and sample-to-detector distance from a Ni calibrant were λ = 0.4087 Å and 478.8 mm, respectively. An exposure time of 0.2 s was used and a total of 64 snapshots were acquired to ensure good data quality. Total scattering data for the atomic pair distribution function (PDF) were collected with an X-ray wavelength of 0.1905 Å (65 keV) and a sample-to-detector distance of 134.8 mm. The exposure time was set to be 0.5 s and 256 snapshots were acquired to optimize the data quality. A value of Qmax = 26 Å was applied for the PDF calculation. The obtained raw 2D diffraction patterns (Fig. 1) were integrated in a radial direction using the GSAS-II software.27 Then, the resulting 1D SXRD profiles were analyzed using Rietveld refinement analysis.28
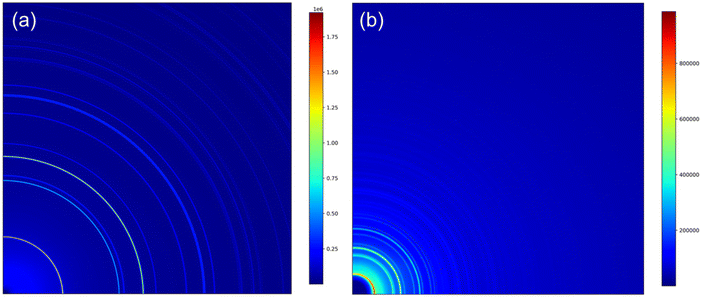 | ||
| Fig. 1 Representative quarter of the 2D patterns acquired for pristine NCM811: (a) SXRD pattern and (b) total scattering pattern of PDF calculation. | ||
The microstructure and morphology of the samples were determined using a field emission scanning electron microscope (Zeiss Sigma FESEM), operating at 5 keV. The elemental mapping was performed using a JEOL JXA-8530F Plus field emission electron probe microanalyzer (FE-EPMA) at the Centre for Material Analysis in the University of Oulu. The epoxy samples for EPMA were prepared by mixing the epoxy resin and hardener properly and then adding the sample powders at room temperature. The epoxy samples were cured and polished to get a flat surface. The EPMA was equipped with a five wavelength dispersive X-ray spectrometer (WDS) and an energy-dispersive X-ray spectroscopy (EDS) detector with the smallest detectable element concentration of 100 ppm. The elements Ni, Mn, Co, Mg, O were analyzed.
2.4 Electrochemical measurements/characterization
The cathode material was first sieved <40 μm in dry room conditions. The cathode slurry was mixed using a Thinky ARE-250 mixer. Slurry composition was 4 wt% PVDF binder (Kureha #1100), 4 wt% conductive carbon (TIMCAL C45) and 92 wt% active NCM811 material using NMP as the solvent. The cathode slurry was coated on an aluminum foil with a 100 μm applicator. The coated foils were dried on a hot plate at 50 °C for a few hours followed by overnight drying in a vacuum oven at 120 °C. Dried cathode foils were calendered three times before the cell assembly using HRP-02 Bench-Top precision automatic heating rolling press. The active material loading on the foil was about 12 mg cm−2 and the theoretical capacity used to calculate the C-rate was 200 mA h g−1.Electrochemical performance measurements were carried out using coin cells and pouch cells. The coin cells were prepared using metallic lithium (99.9% 0.75 mm foil, Alfa Aesar) as a counter electrode and an electrolyte of 1 M LIPF6 in EC![[thin space (1/6-em)]](https://www.rsc.org/images/entities/char_2009.gif) :
:![[thin space (1/6-em)]](https://www.rsc.org/images/entities/char_2009.gif) DMC
DMC![[thin space (1/6-em)]](https://www.rsc.org/images/entities/char_2009.gif) :
:![[thin space (1/6-em)]](https://www.rsc.org/images/entities/char_2009.gif) EMC (1
EMC (1![[thin space (1/6-em)]](https://www.rsc.org/images/entities/char_2009.gif) :
:![[thin space (1/6-em)]](https://www.rsc.org/images/entities/char_2009.gif) 1
1![[thin space (1/6-em)]](https://www.rsc.org/images/entities/char_2009.gif) :
:![[thin space (1/6-em)]](https://www.rsc.org/images/entities/char_2009.gif) 1) solvent. The coin cell testing program and C-rates used are described in detail.19 Two separate coin cells were prepared to check the reproducibility of the results. The pouch cells were prepared with a graphite anode (Hitachi), an electrolyte of 1.15 M LIPF6 in EC
1) solvent. The coin cell testing program and C-rates used are described in detail.19 Two separate coin cells were prepared to check the reproducibility of the results. The pouch cells were prepared with a graphite anode (Hitachi), an electrolyte of 1.15 M LIPF6 in EC![[thin space (1/6-em)]](https://www.rsc.org/images/entities/char_2009.gif) :
:![[thin space (1/6-em)]](https://www.rsc.org/images/entities/char_2009.gif) DMC
DMC![[thin space (1/6-em)]](https://www.rsc.org/images/entities/char_2009.gif) :
:![[thin space (1/6-em)]](https://www.rsc.org/images/entities/char_2009.gif) EMC (2
EMC (2![[thin space (1/6-em)]](https://www.rsc.org/images/entities/char_2009.gif) :
:![[thin space (1/6-em)]](https://www.rsc.org/images/entities/char_2009.gif) 4
4![[thin space (1/6-em)]](https://www.rsc.org/images/entities/char_2009.gif) :
:![[thin space (1/6-em)]](https://www.rsc.org/images/entities/char_2009.gif) 4) and 1% vinylene carbonate in dry room conditions. After the formation cycle, the pouch cells were at first charged at a constant current until 4.2 V was reached, and after that with a constant voltage until the current was decreased to 0.03C and discharged to 2.8 V at 0.1C. Cycling was continued by charging the cells at 0.2C, after which the cells were discharged at varying rates of 0.2C (3 times), 0.5C, 1C, 2C, 3C, 5C and 10C. After these cycles, successive cycles were performed at 1C (2.8–4.2 V) and, for every 100 cycles, a capacity check cycle was run and, after the capacity check, the cells were discharged at 0.2C.
4) and 1% vinylene carbonate in dry room conditions. After the formation cycle, the pouch cells were at first charged at a constant current until 4.2 V was reached, and after that with a constant voltage until the current was decreased to 0.03C and discharged to 2.8 V at 0.1C. Cycling was continued by charging the cells at 0.2C, after which the cells were discharged at varying rates of 0.2C (3 times), 0.5C, 1C, 2C, 3C, 5C and 10C. After these cycles, successive cycles were performed at 1C (2.8–4.2 V) and, for every 100 cycles, a capacity check cycle was run and, after the capacity check, the cells were discharged at 0.2C.
3. Results and discussion
3.1 Characterization of NCM811 samples
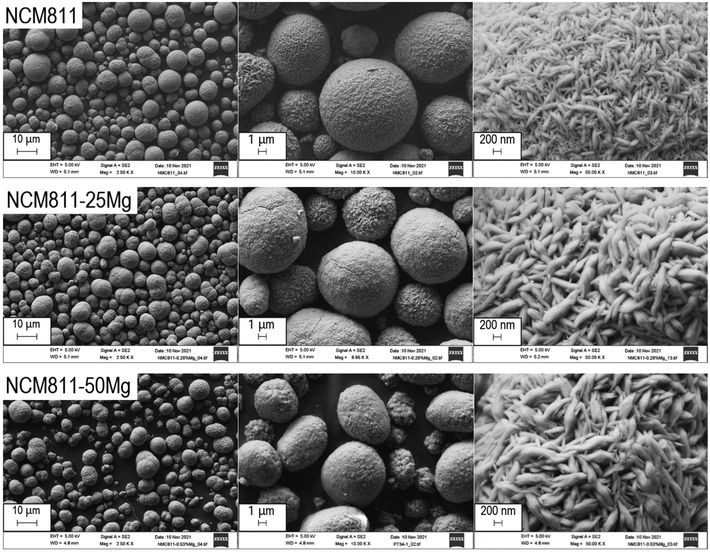
The NCM811 cathode active material was prepared by co-precipitation and lithiation as described in section 2.2. The morphology of co-precipitated (Ni0.8Co0.1Mn0.1)OH2 particles was followed by the particle size growth and is shown in Fig. 2. All precursors showed a quite spherical particle morphology and radial growth of particles.Next, the role of Mg during the co-precipitation was evaluated. The 2 M MeSO4 solutions contained 0, 0.26 wt% (target 0.25) and 0.53 wt% (target 0.5) of Mg. The solubility of magnesium as a function of pH was evaluated using MEDUSA and HYDRA and it was predicted to co-precipitate under the used co-precipitation conditions.
The presence of Mg in the samples and metal ratios (Ni![[thin space (1/6-em)]](https://www.rsc.org/images/entities/char_2009.gif) :
:![[thin space (1/6-em)]](https://www.rsc.org/images/entities/char_2009.gif) Co
Co![[thin space (1/6-em)]](https://www.rsc.org/images/entities/char_2009.gif) :
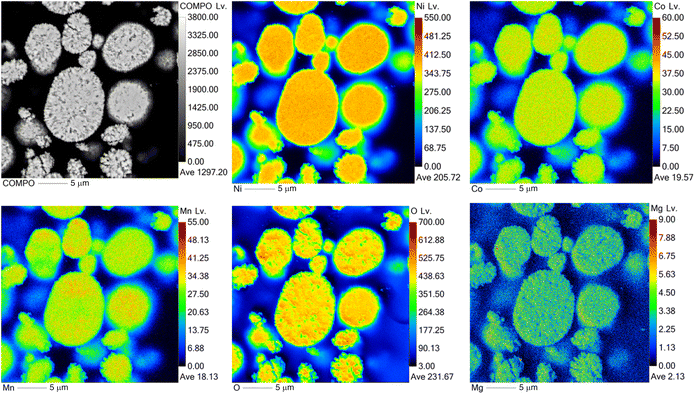
:![[thin space (1/6-em)]](https://www.rsc.org/images/entities/char_2009.gif) Mn) of precursors was determined by ICP-OES prior to the lithiation. The metal contents of the lithiated samples are shown in Table 2. The presence of Mg in the samples was also confirmed by elemental mapping (EPMA measurements) (Fig. 3) for all samples. As can be seen in Fig. 3, Mg is present in the sample and it is evenly distributed.
Mn) of precursors was determined by ICP-OES prior to the lithiation. The metal contents of the lithiated samples are shown in Table 2. The presence of Mg in the samples was also confirmed by elemental mapping (EPMA measurements) (Fig. 3) for all samples. As can be seen in Fig. 3, Mg is present in the sample and it is evenly distributed.
| Sample | Ni (mol%) | Co (mol%) | Mn (mol%) | Mg (mol%) | Li/Me (mol ratio) | Na (mg g−1) | S (mg g−1) |
|---|---|---|---|---|---|---|---|
| NCM811 | 80.0 | 9.9 | 10.1 | 0.0 | 1.05 | 0.952 | 1.24 |
| NCM811-25Mg | 79.7 | 9.6 | 10.1 | 0.6 | 1.04 | 1.24 | 1.35 |
| NCM811-50Mg | 79.2 | 9.6 | 10.0 | 1.2 | 1.04 | 1.04 | 1.41 |
| NCM811-WD | 80.0 | 9.9 | 10.1 | 0.0 | 1.02 | 0.099 | 0.20 |
| NCM811-25Mg-WD | 79.6 | 9.7 | 10.1 | 0.6 | 1.00 | 0.194 | 0.25 |
| NCM811-50Mg-WD | 79.1 | 9.7 | 10.0 | 1.2 | 1.01 | 0.119 | 0.27 |
As can be seen in Table 2, Mg co-precipitated to a large extent to these precursors, as expected based on the thermodynamic calculations. The presence of Mg also affected the tap density of the precursor materials (see Table 3). The tapped density decreased with increasing Mg content. Interestingly, precursor NCM811-25Mg showed the highest average particle size, lowest surface area and highest mesopore concentration.
| Sample | Tapped density (g mL−1) | D50 (μm) | BET SSA (m2 g−1) | Porea volume (cm3 g−1) | Micropores (%) | Mesopores (%) | Macropores (%) |
|---|---|---|---|---|---|---|---|
| a Pore volume and porosity were calculated based on the DFT model (N2 geometry slit). | |||||||
| NCM811 | 2.12 | 7.90 | 6.11 | 0.00698 | 18.48 | 74.50 | 7.02 |
| NCM811-25Mg | 2.07 | 8.17 | 5.75 | 0.00763 | 13.11 | 81.13 | 5.77 |
| NCM811-50Mg | 2.00 | 7.11 | 10.50 | 0.0115 | 18.35 | 78.17 | 3.48 |
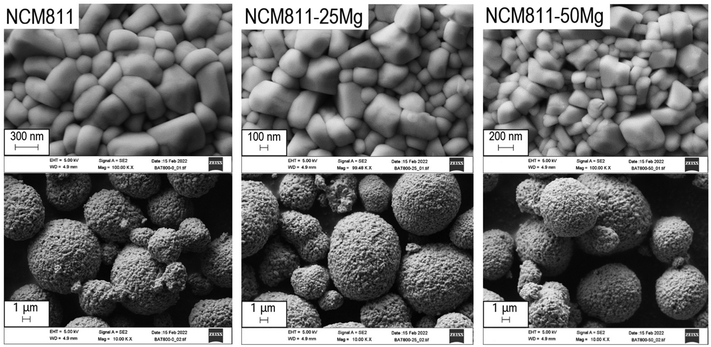
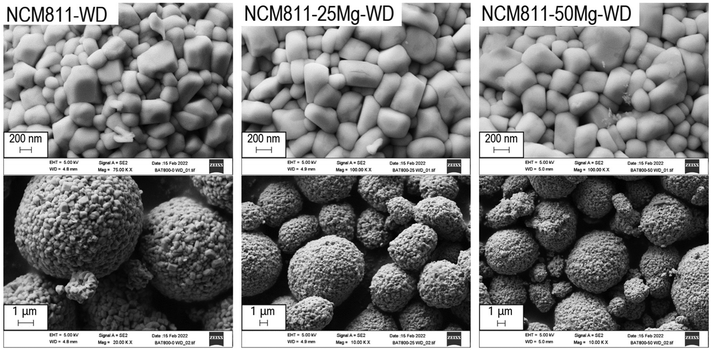
The FESEM images of the lithiated NCM cathode powders are shown in Fig. 4 and 5, for unwashed and washed samples, respectively. The micrometer-sized particles are of spherical shape and they have the typical structure of secondary particles with densely packed primary particles. However it is believed that a slight agglomeration of secondary particles, visible in Fig. 4 and corroborated by the physical properties analysis of the lithiated material (Table 4), can be observed. During the lithiation procedure, the secondary precursor particles are somewhat fused together, explaining the increase in average particle side and the decrease in tapped density, whereby deviation from secondary particle sphericity leads to inconsistent packing of the material.
| Sample | Tapped density (g mL−1) | D50 (μm) | BET SSA (m2 g−1) | Porea volume (cm3 g−1) | Micropores (%) | Mesopores (%) | Macropores (%) |
|---|---|---|---|---|---|---|---|
| a Pore volume and porosity were calculated based on the DFT model (N2 geometry slit). | |||||||
| NCM811 | 2.04 | 13.7 | 0.3 | 0.0006 | 11.67 | 55.00 | 33.33 |
| NCM811-25Mg | 2.04 | 13.3 | 0.4 | 0.0007 | 8.57 | 62.86 | 28.57 |
| NCM811-50Mg | 1.81 | 13.3 | 0.3 | 0.0007 | 12.86 | 44.29 | 42.86 |
| NCM811-WD | 2.12 | 13.4 | 0.6 | 0.0018 | 6.67 | 65.56 | 27.78 |
| NCM811-25Mg-WD | 2.23 | 12.4 | 0.7 | 0.0023 | 4.78 | 60.43 | 34.78 |
| NCM811-50Mg-WD | 1.98 | 12.5 | 0.6 | 0.0019 | 5.79 | 62.63 | 31.58 |
Next, the effect of washing was studied. As can be seen in Table 2, washing efficiently removed excess lithium from the particle surface and reduced the lithium amount close to a stoichiometric value. Washing also reduced the amount of Na and S in the samples. Based on the crystallographic data, some structural changes between washed and unwashed samples are seen. This will be discussed in detail in section 3.2 where the synchrotron X-ray diffraction and total scattering data for the samples are discussed.
3.2 Synchrotron X-ray diffraction and total scattering
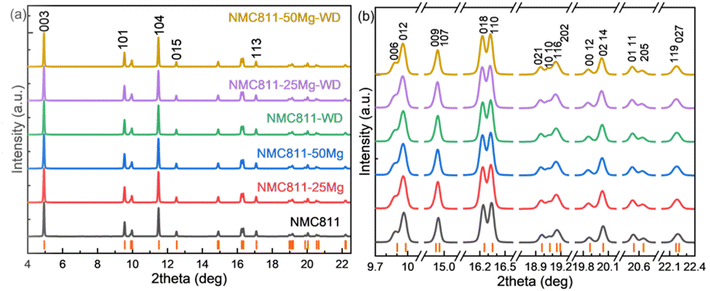
Fig. 6a displays the SXRD patterns of the NCM811 materials. All the diffraction peaks in the patterns of all the samples can be indexed to the ‘layered α-NaFeO2 structure with R![[3 with combining macron]](https://www.rsc.org/images/entities/char_0033_0304.gif) m space group’. There were no distinct impurity phases found in any of these patterns. Clearly, washing and doping did not influence the crystal structure of the samples, i.e., Mg has been successfully incorporated into the lattice of NCM811. Fig. 6b shows the clear doublet peak splitting of (006)/(102), (018)/(110), (021)/(10 10), (00 12)/(02 14), (01 11)/(205) and asymmetric peak shapes due to doublets with very close interplanar distance, e.g. (009)/(107), (116)/(202) and (119)/(207). These results indicate that all the samples developed a well-ordered crystalline structure.
m space group’. There were no distinct impurity phases found in any of these patterns. Clearly, washing and doping did not influence the crystal structure of the samples, i.e., Mg has been successfully incorporated into the lattice of NCM811. Fig. 6b shows the clear doublet peak splitting of (006)/(102), (018)/(110), (021)/(10 10), (00 12)/(02 14), (01 11)/(205) and asymmetric peak shapes due to doublets with very close interplanar distance, e.g. (009)/(107), (116)/(202) and (119)/(207). These results indicate that all the samples developed a well-ordered crystalline structure.
The SXRD patterns for all these samples were analyzed by the Rietveld refinement method. The refinement results are shown in Fig. 7. The estimated unit-cell parameters are summarized in Table 5. It is seen that the a and c lattice parameters of the unwashed samples increase with Mg addition, while the c/a values show that the hexagonal structural disorder remains unchanged. Washing leads to increasing a and c lattice parameters, but a decreasing c/a ratio of the NCM811. No distinct changes of a, c and c/a values are observed in washed NCM811s with Mg addition. Nevertheless, I003/I104 decrease due to washing and the increase in Mg content suggest that the cation disorder increases. As per the reports, Li and Ni ions occupy the 3b site, Ni, Mn and Co take the 3a site, O is in the 6c site and Mg is assumed to locate in the Li and/or Ni layers. Table 5 lists the atomic occupancies of all the samples. The occupancy of Mg is predominantly in the Li sites, which is highly ascribed to the smaller ionic radius of Mg2+ (0.72 Å) as compared with 0.76 Å of Li+ and 0.69 Å of Ni2+.
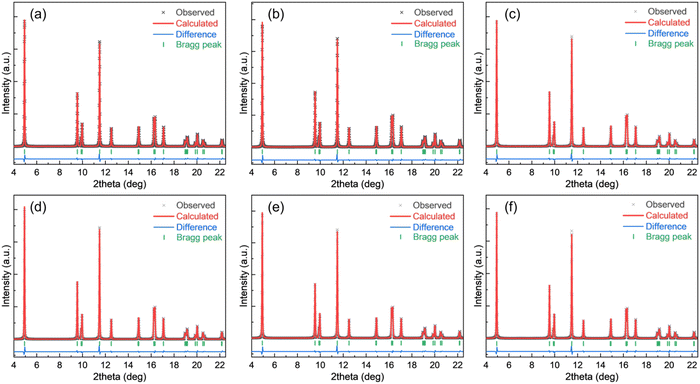 | ||
| Fig. 7 Rietveld refinement fitting results for all the NCM powders: (a) NCM811, (b) NCM811-25Mg, (c) NCM811-50Mg, (d) NCM811-WD, (e) NCM811-25Mg-WD and (f) NCM811-50Mg-WD. | ||
| Sample | a (Å) | c (Å) | c/a | c/3a | I 003/I104 | R wp (%) |
|---|---|---|---|---|---|---|
| NCM811 | 2.8738 | 14.2039 | 4.9425 | 1.6475 | 1.2377 | 5.48 |
| NCM811-25Mg | 2.8750 | 14.2088 | 4.9422 | 1.6474 | 1.1583 | 7.68 |
| NCM811-50Mg | 2.8755 | 14.2121 | 4.9425 | 1.6475 | 1.1045 | 7.11 |
| NCM811-WD | 2.8756 | 14.2097 | 4.9415 | 1.6472 | 1.1277 | 7.32 |
| NCM811-25Mg-WD | 2.8765 | 14.2132 | 4.9411 | 1.6470 | 1.1064 | 7.49 |
| NCM811-50Mg-WD | 2.8763 | 14.2121 | 4.9411 | 1.6470 | 1.0998 | 5.47 |
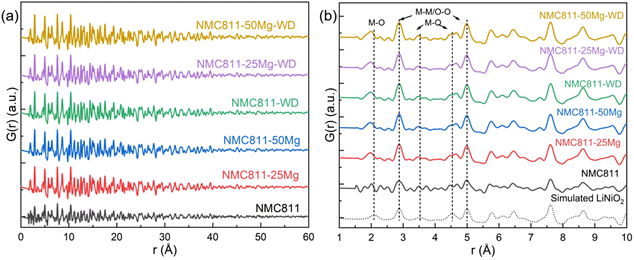
Consistent with the SXRD study, similar plots for the X-ray PDF data of all samples are shown in Fig. 8a. The PDF patterns simulated using the undistorted LiNiO2 structure (R![[3 with combining macron]](https://www.rsc.org/images/entities/char_0033_0304.gif) m symmetry with cell parameters of a = 2.87772 Å, c = 14.20520 Å, ICDD PDF 00-066-0856) are very close to the experimental profiles, suggesting the similar nature of the interatomic distances of atom pairs. The situation is different when focusing on the peaks in the 2–5 Å range, highlighted by the vertical dotted lines in Fig. 8b. Greater discrepancies are seen between the simulated LiNiO2 and experimental NCM811 profile. It is noteworthy that peaks below 1.8 Å are ripples that do not represent any real structural features (Table 6).
m symmetry with cell parameters of a = 2.87772 Å, c = 14.20520 Å, ICDD PDF 00-066-0856) are very close to the experimental profiles, suggesting the similar nature of the interatomic distances of atom pairs. The situation is different when focusing on the peaks in the 2–5 Å range, highlighted by the vertical dotted lines in Fig. 8b. Greater discrepancies are seen between the simulated LiNiO2 and experimental NCM811 profile. It is noteworthy that peaks below 1.8 Å are ripples that do not represent any real structural features (Table 6).
| Atom | Site | Occupancy | |||||
|---|---|---|---|---|---|---|---|
| NCM811 | NCM811-25Mg | NCM811-50Mg | NCM811-WD | NCM811-25Mg-WD | NCM811-50Mg-WD | ||
| Li1 | 3b | 0.973 | 0.971 | 0.973 | 0.972 | 0.97 | 0.976 |
| Ni2 | 3b | 0.027 | 0.029 | 0.027 | 0.028 | 0.03 | 0.024 |
| Mg2 | 3b | — | 0.008 | 0.021 | — | 0.008 | 0.032 |
| Ni1 | 3a | 0.802 | 0.800 | 0.800 | 0.800 | 0.800 | 0.801 |
| Co1 | 3a | 0.099 | 0.100 | 0.100 | 0.100 | 0.100 | 0.099 |
| Mn1 | 3a | 0.099 | 0.100 | 0.100 | 0.100 | 0.100 | 0.100 |
| Mg1 | 3a | — | 0.002 | 0 | — | 0.002 | 0 |
| O | 6c | 1.000 | 1.000 | 1.000 | 1.000 | 1.00 | 1.000 |
The first peak at 2.09 Å in the simulated undistorted LiNiO2 profiles is ascribed to the M–O atomic pairs in the [MO6] octahedron. This peak position for the investigated NCM811s shifts to a smaller interatomic distance to around 1.95 Å due to the superposition of M–O atomic pairs (M ≈ Li, Ni, Mn, Co and Mg according to the SXRD results) and smaller Co–O, Mn–O and Mg(Li site)–O than Ni–O and Li–O distances.29,30 It should be noted that the PDF peak for NCM811 that was assigned at 1.95 Å is seen to have two shoulders at 1.79 and 2.01 Å. A similar feature is found in the NCM8111-50Mg-WD sample, but it is much fuzzier in the other samples. Such a double-peak structure is much clearer at the second and third shortest M–O distances at approximately 3.54 Å and 4.53 Å, which is reported to be associated with elongated [NiO6] octahedra due to local Jahn–Teller distortions.31,32 It might also lead to the appearance of multiple minor peaks just next to those main peaks attributable to the possible M–O distances in the distorted [MO6] octahedra. Such results indicate that the local lattice Jahn–Teller distortion of the NCM811 sample prepared by the aforesaid method is highly oriented. Washing and Mg addition to substitute for the Li site could randomize the distortion, which could be either beneficial or detrimental for the lithium intercalation and deintercalation during the charging/discharging cycles.
3.3 Effect of Mg content and washing on the cycling performance
Table 7 presents the first cycle charge and discharge capacities for the samples. It also presents the last discharge capacity after 62 cycles, and coulombic efficiency after the first and last cycles. As can be seen in Table 7, undoped NCM811 samples showed the highest initial discharge capacities and the doped NCM811-50Mg the lowest. The decreases in initial capacities can be explained by the magnesium position in the Li layer. For each Mg2+ ion, two lithium atoms are replaced in the structure, thus lowering the amount of lithium available for cycling.15 Two separate coins cells were tested and only minor differences in the electrochemical performance can be observed at moderate rates (0.1–0.2C) for the unwashed and washed samples in the coin cells. For the unwashed NMC811 materials, the first discharge cycle was 196.8–197.7 mA h g−1 and the 62nd discharge cycle was 191.5–191.9 mA h g−1. Similarly for samples NCM811-25WD and NCM811-50WD, the first and 62nd discharge cycles were 191.9–192.1 mA h g−1 and 184.9–186.2 mA h g−1, and 190.5–190.8 mA h g−1 and 184.1–185.3 mA h g−1, respectively. The increased rate seems to influence the electrochemical performance of the repeated experiments more significantly.| Sample | CC 4.3 V /0.1C (mA h g−1) | First DC 3.0 V/0.1C (mA h g−1) | Eff. (%) | Last DC 3.0 V/0.1C (mA h g−1) | Last/first eff. (%) |
|---|---|---|---|---|---|
| NCM811 | 226.4 | 187.9 | 83.0 | 191.9 | 102.1 |
| NCM811-WD | 224.6 | 193.0 | 86.0 | 150.7 | 78.1 |
| NCM811-25Mg | 223.1 | 182.7 | 81.9 | 186.2 | 101.9 |
| NCM811-25Mg-WD | 222.1 | 190.4 | 85.7 | 145.0 | 76.2 |
| NCM811-50Mg | 220.2 | 180.3 | 81.9 | 185.3 | 102.8 |
| NCM811-50Mg-WD | 219.6 | 181.2 | 82.5 | 142.8 | 78.8 |
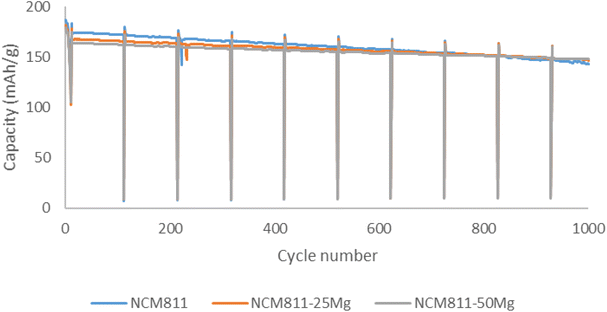
Washing also affects the cycling performance by increasing the initial discharge capacities for all the washed samples. Undoped NCM811 samples also showed the highest capacities after 62 cycles and washing decreased the capacity retention after 62 cycles for all the samples. Pouch cell testing was carried out for all the samples. For the unwashed samples, initial capacities follow a similar trend as in coin cell testing. Discharge capacities decreased as the Mg dopant quantity increased. However, after prolonged testing of 1000 cycles, sample NCM811-50Mg exhibits the largest capacity of 148 mA h g−1 in comparison with NCM811 and NCM811-25Mg, with 143 mA h g−1 and 147 mA h g−1, respectively (Fig. 9). This would suggest that magnesium indeed slightly improves the capacity retention of these samples, but the influence is rather minuscule and observable only after prolonged testing. This is somewhat contrary to the behavior suggested by Huang et al.,17 where Mg doping significantly improved the capacity retention of NCM622 material even after 100 cycles.
Fig. 10 shows the voltage curves of pouch cells at different current rates. At low current rates of 0.1C–2C, undoped NCM811 shows the best performance. However, at higher current densities of 5C–10C, magnesium doped samples, namely NCM811-25Mg, show an increased rate performance. This behavior could possibly be explained electrochemically by the lower charge-transfer resistance of the Mg doped material leading to decreased impedance and internal resistance and conductivity as reported by Xiang et al.33 and Muto et al.34 However Huang et al.17 further proposed that increased Mg doping would additionally increase the Li+ activation barrier, leading to decreased rate performance, perhaps further clarifying the observed behavior of the samples.
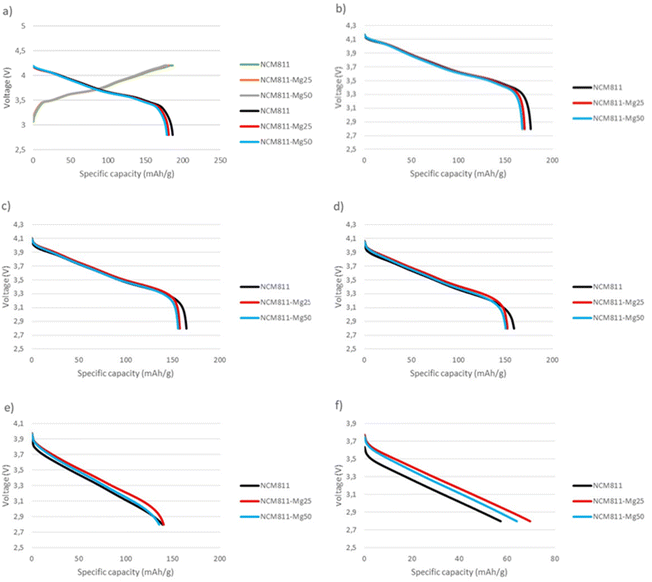 | ||
| Fig. 10 Pouch cell voltage curves at different currents: (a) 0.03C charge and 0.1C discharge, (b) 0.5C discharge, (c) 1C discharge, (d) 2C discharge, (e) 5C discharge and (f) 10C discharge. | ||
The influence of physical properties of the cathode materials on the electrochemical performance has been proposed by several authors.35–38 The increase in surface area by hollow particle design was reported to increase the rate capacity and cycle durability of NCM11 by shortening the Li-ion diffusion distance as well as increasing the electrochemical reaction area.35 It has been suggested that the electrochemical performance can partly derive from apparent porosity, as the more macroporous NCM11 material had an increased rate performance.36 Furthermore, additional crystal properties of the particle, such as radially aligned single-crystal primary particles, can lead to increased mechanical strength by facilitating anisotropic volume expansion and thus lead to decreased cracking of the secondary particles, limiting surface area exposure to an electrolyte.37 These factors can be highly significant as NCM811 was proposed to be prone to mechanical instability during the cycling.38
In this study, sample NCM811-25Mg has the highest surface area and mesopore concentration, but the lowest micro- and macropore concentration of the lithiated samples (Table 4), which might suggest similar behavior to that proposed by Aida et al.,35 where an increase in surface area leads to an increased rate performance of the aforementioned sample. While measured differences are rather minor, the possible role of Mg dopant and physical properties on the electrochemical performance can be observed only at elevated C-rates.
Table 8 shows the half-cell rate performance tests results. Again, the undoped NCM811 sample shows the highest discharge capacities for all tested currents. It was also observed that washing decreased the rate performance for all samples by removing excess lithium from the surface and possibly from the surface of the NCM structure, thus forming a lithium-deficient layer on the material surface limiting Li diffusion.39
| Charge 0.1C + 0.02C → 4.3 V | |||||
|---|---|---|---|---|---|
| Sample | DC 3 V 0.2C (mA h g−1) | DC 3 V 0.33C (mA h g−1) | DC 3 V 0.5C (mA h g−1) | DC 3 V 1C (mA h g−1) | DC 3 V 2C (mA h g−1) |
| NCM811 | 185.7 | 182.7 | 180.1 | 176.1 | 171.7 |
| NCM811-WD | 187.2 | 182.5 | 178.4 | 167.7 | 150.4 |
| NCM811-25Mg | 179.2 | 176.1 | 173.1 | 168.4 | 164.2 |
| NCM811-25Mg-WD | 183.9 | 179.2 | 174.8 | 165.1 | 151.9 |
| NCM811-50Mg | 176.2 | 172.9 | 169.7 | 164.3 | 156.8 |
| NCM811-50Mg-WD | 177.8 | 174.1 | 170.1 | 159.4 | 151.4 |
4. Conclusions
NCM811 cathode active materials were successfully prepared by co-precipitation and calcination from three different metal sulfate solutions containing various amounts of magnesium. Based on the results, magnesium was fully co-precipitated in the precursors and evenly distributed in the samples. Mg as a dopant decreased the tapped density and increased the surface area of samples, but Mg doping had minute beneficial effects on the cell performance or cyclability observable only after prolonged cycling. However, an increase in rate performance was observed for Mg-doped samples at high C-rates. The washing effect was clearly seen in lattice parameters of the samples. Washing also influenced the cell performance, by decreasing the capacity retention for all samples.Author contributions
Petteri Laine: writing – original draft, writing – review & editing, and conceptualization. Marianna Hietaniemi: writing – original draft and conceptualization. Juho Välikangas: writing – original draft. Toni Kauppinen: writing – original draft. Pekka Tynjälä: writing – original draft. Tao Hu: writing – original draft and conceptualization. Shubo Wang: data curation and conceptualization. Harishchandra Singh: writing – review & editing and formal analysis. Ulla Lassi: writing – review & editing and conceptualization.Conflicts of interest
The authors declare that they have no known competing financial interests or personal relationships that could have appeared to influence the work reported in this paper.Acknowledgements
The authors acknowledge Business Finland for the research funding 2021–2024 (University of Oulu, BATCircle2.0, Dnro 44612/31/2020). The authors also acknowledge Dr Graham King and Al Rahemtulla for their assistance in the Synchrotron X-ray measurements. Part of the research described in this work was performed at the Canadian Light Source, a national research facility of the University of Saskatchewan, which is supported by the Canada Foundation for Innovation (CFI), the Natural Sciences and Engineering Research Council (NSERC), the National Research Council (NRC), the Canadian Institutes of Health Research (CIHR), the Government of Saskatchewan, and the University of Saskatchewan.References
- M. Gallo and M. Marinelli, Sustainability, 2020, 12(18), 7499 CrossRef CAS.
- W. Li, E. M. Ericson and A. Manthiram, Nat. Energy, 2020, 5(1), 2058–7546 CrossRef.
- L. Fagiolari, M. Sampò, A. Lamberti, J. Amici, C. Francia, S. Bodoardo and F. Bella, Energy Storage Mater., 2022, 51(6), 400–434 CrossRef.
- H. Duan, L. Li, X. Fu, Y. Deng and G. Chen, Chem. Eng. J., 2022, 450(3), 138208 CrossRef CAS.
- M. Alidoost, A. Mangini, F. Caldera, A. Anceschi, J. Amici, D. Versaci, L. Fagiolari, F. Trotta, C. Francia, F. Bella and S. Bodoardo, Eur. J. Chem., 2021, 28(6), e202104201 Search PubMed.
- K. Hemalatha, M. Jayakumar and A. S. Prakash, Dalton Trans., 2018, 47, 1223–1232 RSC.
- D. Dwibedi, R. Gond, A. Dayamani, R. B. Araujo, S. Chakraborty, R. Ahuja and P. Barpanda, Dalton Trans., 2017, 46, 55–63 RSC.
- N. C. Paranamana, X. He and M. j. Young, Dalton Trans., 2021, 50, 18128–18142 RSC.
- F. Bella, S. De Luca, L. Fagiolari, D. Versaci, J. Amici, C. Francia and S. Bodoardo, Nanomaterials, 2021, 11(3), 810 CrossRef CAS PubMed.
- W. Bernhart , ATZ-electronik worldwide, 2019, 01–02, 38–43.
- M. S. E. Houache, C. Yim, Z. Karkar and Y. Abu-Lebdeh, Batteries, 2022, 8(70), 3–19 Search PubMed.
- M-H. Kim, H-S. Shin, D. Shin and Y-K. Sun, J. Power Sources, 2006, 159(2), 1328–1333 CrossRef CAS.
- S. Ahmed, A. Pokle, S. Schweidler, A. Beyer, M. Biachini, F. Walther, A. Mazilkin, P. Hartmann, T. Brezesinski, J. Janek and K. Volz, ACS Nano, 2019, 13, 10694–10704 CrossRef CAS PubMed.
- M. S. Whittingham, Chem. Rev., 2004, 104, 4271–4301 CrossRef CAS PubMed.
- H. Li, M. Cormier, N. Zhang, J. Inglis, J. Li and J. R. Dahn, J. Electrochem. Soc., 2019, 166(4), A429–A439 CrossRef CAS.
- Q. Xie, W. Li and A. Manthiram, Chem. Mater., 2019, 31(3), 938–946 CrossRef CAS.
- Z. Huang, Z. Wang, X. Zheng, H. Guo, X. Li, Q. King and Z. Yang, Electrochim. Acta, 2015, 182, 795–802 CrossRef CAS.
- Y. Weng, S. Xu, G. Huang and C. Jiang, J. Hazard. Mater., 2013, 246–247, 163–172 CrossRef CAS PubMed.
- J. Välikangas, P. Laine, M. Hietaniemi, T. Hu, P. Tynjälä and U. Lassi, Appl. Sci., 2020, 10, 8988 CrossRef.
- R. Moshtev, P. Zlatilova, S. Vasilev, I. Bukalova and A. Kozawa, J. Power Sources, 1999, 81–82, 434–441 CrossRef CAS.
- R. Imhof, J. Electrochem. Soc., 1999, 146, 1702–1706 CrossRef CAS.
- S. E. Renfrew and B. D. McCloskey, J. Am. Chem. Soc., 2017, 139, 17853–17860 CrossRef CAS PubMed.
- M. Hietaniemi, T. Hu, J. Välikangas, J. Niittykoski and U. Lassi, J. Appl. Electrochem., 2021, 51(11), 1545–1557 CrossRef CAS.
- L. Azhari, X. Zhou, B. Sousa, Z. Yang, G. Gao and Y. Wang, ACS Appl. Mater. Interfaces, 2020, 12, 57963–57974 CrossRef CAS PubMed.
- D. Pritzl, T. Teufl, A. T. S. Freiberg, B. Strehle and J. Sicklinger, J. Electrochem. Soc., 2019, 166, A4056–A4066 CrossRef CAS.
- A. Gomez, G. Dina and S. Kycia, Rev. Sci. Instrum., 2018, 89, 063301 CrossRef CAS PubMed.
- B. H. Toby and R. B. Von Dreele, J. Appl. Crystallogr., 2013, 46, 544–549 CrossRef CAS.
- H. M. Rietveld, J. Appl. Crystallogr., 1969, 2, 65–71 CrossRef CAS.
- J. Bréger, N. Dupré, P. J. Chupas, P. L. Lee, P. Proffen, J. B. Parise and C. P. Grey, J. Am. Chem. Soc., 2005, 127(30), 7529–7537 CrossRef PubMed.
- D. S. Adipranoto, T. Ishigaki, A. Hoshikawa, K. Iwase, M. Yonemura, K. Mori, T. Kamiyama, Y. Morii and M. Hayashi, Solid State Ionics, 2014, 262, 92–97 CrossRef CAS.
- J.-H. Chung, Th. Proffen, S. Shamato, A. M. Ghorayeb, L. Croguennec, W. Tian, B. C. Sales, R. Jin, D. Mandrus and T. Egami, Phys. Rev. B: Condens. Matter Mater. Phys., 2005, 71, 064410 CrossRef.
- S. Sicolo, M. Mock, M. Bianchini and K. Able, Chem. Mater., 2020, 32(23), 10096–10103 CrossRef CAS.
- J. Xiang, C. Chang, F. Zhang and J. Sun, J. Alloys Compd., 2009, 475(1–2), 483–487 CrossRef CAS.
- S. Muto, K. Tatsumi, Y. Kojima, H. Oka, H. Kondo, K. Horibuchi and Y. Ukyo, J. Power Sources, 2012, 205, 449–455 CrossRef CAS.
- T. Aida, T. Toma and S. Kanada, J. Solid State Electrochem., 2020, 24, 1415–1425 CrossRef CAS.
- K. M. Shaju and P. G. Bruce, Adv. Mater., 2006, 18, 2330–2334 CrossRef CAS.
- X. Xu, H. Huo, J. Jian, L. Wang, H. Zhu, S. Xu, X. He, G. Yin, C. Du and X. Sun, Adv. Energy Mater., 2019, 9(15), 1803963 CrossRef.
- J.-M. Lim, T. Hwang, D. Kim, M.-S. Park, K. Cho and M. Cho, Sci. Rep., 2017, 7, 39669 CrossRef CAS PubMed.
- M. R. Palacin, D. Larcher, A. Audemer, N. Sac-Épée, G. G. Amatucci and J.-M. Tarascon, J. Electrochem. Soc., 1997, 144(12), 4226–4236 CrossRef CAS.
| This journal is © The Royal Society of Chemistry 2023 |

