
Nonadiabatic molecular dynamics simulations for ultrafast photo-induced ring-opening and isomerization reactions of 2,2-diphenyl-2H-chromene†
He
Wang‡
a,
Tianhe
Yang‡
a,
Yuechun
Li
a,
Le
Yu
*a,
Yibo
Lei
 *a and
Chaoyuan
Zhu
*bc
*a and
Chaoyuan
Zhu
*bc
aKey Laboratory of Synthetic and Natural Functional Molecule Chemistry of Ministry of Education, College of Chemistry & Materials Science, Shaanxi Key Laboratory of Physico-Inorganic Chemistry, Northwest University, Xi’an, Shaanxi 710127, P. R. China. E-mail: yule@nwu.edu.cn; leiyb@nwu.edu.cn
bDepartment of Applied Chemistry and Institute of Molecular Science, National Yang Ming Chiao-Tung University, Hsinchu 30010, Taiwan. E-mail: cyzhu@mail.nctu.edu.tw
cKey Laboratory of Theoretical Chemistry of Environment, Ministry of Education, School of Environment, South China Normal University, Guangzhou 51006, P. R. China
First published on 1st November 2023
Abstract
Nonadiabatic molecular dynamics simulations with a global switching algorithm have been performed at the TD-CAM-B3LYP-D3/def2-SVP level of theory for ultrafast photo-induced ring-opening and isomerization reactions upon S1 excitation for 2,2-diphenyl-2H-chromene (DPC). Both DPC-T and DPC-C conformers undergo ring-opening relaxation and isomerization pathways accompanied with pyran conformation conserved and converted on the S1 or S0 states via competition and cooperation between C–O bond dissociation and pyran inversion motions. Upon S1 excitation, the DPC-T mainly relaxes to the T-type conical intersection region and thus yields a higher ring-opening efficiency with a faster S1 decay and intermediate formation than those of the DPC-C mainly relaxing to C-type conical intersection. The simulated ring-opening quantum yield for DPC-T (DPC-C) is 0.91 (0.76), which is in good agreement with the experimental value of 0.7–0.9, and the thermal weight averaged lifetimes are estimated as 182.0 fs, 228.6 fs, and 1262.4 fs for the excited-state decay, intermediate formation, and ring-opening product, respectively. These time constants are in good agreement with the experimentally measured τ1 time constant of 190–450 fs and τ2 time constant of 1000–1800 fs. The present work could be a valuable reference for understanding the nature of the photorelaxation mechanisms of DPC, and could help to develop DPC-based photoresponsive materials.
1. Introduction
Chromenes with 2,2-diphenylbenzopyran (also namely as 2,2-diphenyl-2H-chromene, DPC (see Fig. 1)) have attracted increasing interest for both their fundamental scientific significance1–3 and their technique applications4,5 with their specialized photocoloration under UV irradiation and thermal (T-type) or visible-light (P-type) triggered fast color fading. The underlying essences of such photochromic phenomenon are associated with the bidirectional isomerization transformation between the colorless closed form (CF) and the colored open form (OF) via the intermediate C(spiro)–O bond of the pyran ring and the reversible sequential isomerization among metastable cisoid-cis (CC), transoid-cis (TC) and transoid-trans (TT) conformers. The CC isomer is supposed to decay within a few picoseconds, while the more stable TC and TT isomers could be detected by spectroscopy with lifetimes varying from μs to seconds and from ms to minutes, respectively.2 In order to improve the colorability, photostability and fatigue resistance performances of benzopyrans, numerous investigations have been carried out by means of modulating the kinetic equilibrium towards TC or TT isomers based on inductive, mesomeric and steric effects, heterocyclic substitution and ring annulation strategies.6–19 Fully T-type photochromism chromenes have been synthesized with suitable substitutions toward a pyran ring that stabilizes the TC isomer, and thus prevents the ensuing formation of TT both thermally and optically8–10 and guarantees promising applications in photochromic lenses. On the other hand, helicene annulation gives rise to P-type chromenes6,7 with potential applications, such as molecular motors, high density data storage devices and electronic devices.3 Beyond the substantially varied spetrokinetics of chromenes relevant to the position and character of substitution groups, the measured quantum yield for the photo-induced ring-opening is close to unity (Φ = 0.7–0.9),20,21 and even independent of solvent polarity. Therefore, unveiling detailed mechanisms for the photo-transformation of DPC could be essential for developing DPC-related photoresponsive materials.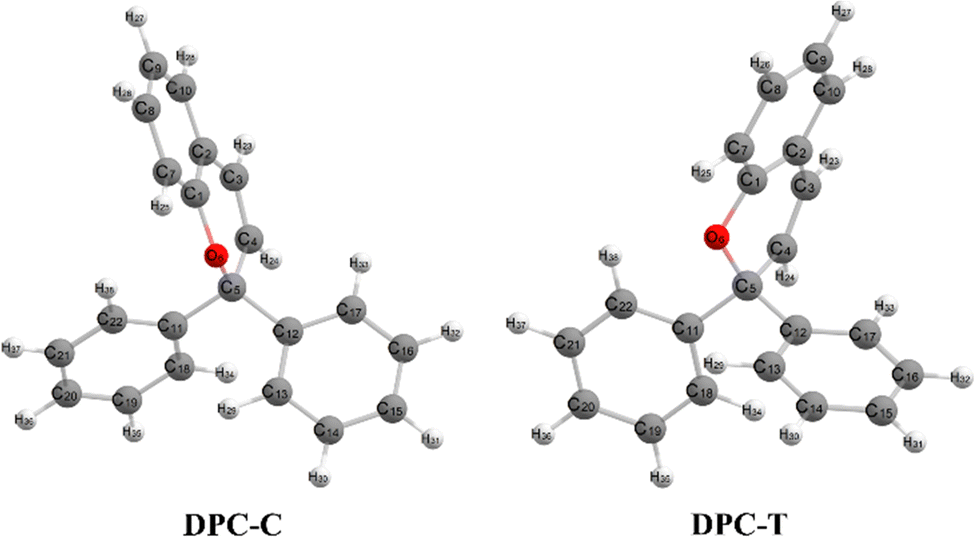 | ||
| Fig. 1 Atomic numbering and conformation of DPC-C and DPC-T. | ||
Numerous experimental studies utilizing time-resolved transient absorption techniques in the visible and IR regions, transient fluorescence, flash photolysis and NMR spectroscopy have been carried out to trace the generation and evolution of CF and OF intermediates for disclosing the microscopic dynamics of DPC and its derivatives.20–28 The presented models basically agreed with a multi-component decay pattern, however, which intermediate and which electronic state accounts for each of the dynamics step is still debated. Kodama et al.22 investigated a series of chromenes with time-resolved absorption spectra and predicted that the C–O bond cleavage occurs on the S1 state within 2 ps and recovers in a ∼ns to ∼ms time domain. The proposed sequential model consists of two photo-triggered steps, CF photolysis only yields a revertible CC intermediate which subsequently converts into other OF photoproducts. Görner and Chibisov20 measured the absorption spectra of naphthopyran in different solvents with continuous irradiation and proposed a parallel model with competing CF → TC and CF → TT processes taking place on the S1 state. This model was not widely adopted and only in a recent spectra study on bromoalkoxyl substitution effects by Chernikova et al.,28 which was suggested to compete with the sequential model and exhibited sensitive dependency on the solution concentration and length of the bromoalkoxyl group. Successive time-resolved spectroscopy studies attempted to perfect the tri-component sequential model progressively. Gentili et al.23 suggested that an S1 state zwitterionic or biradical character C–O cleavage product is generated within 0.23 ± 0.05 ps. Following a barrierless relaxation pathway, internal conversion occurs and gives rise to a ground state CC intermediate at 1.1 ± 0.1 ps, which ultimately transforms to TC within 1.4 ± 0.5 ps. Moine et al.24 addressed that two minima exist on the S1 state in the vicinity of and far away from the Franck–Condon region prior to the decay pathway. Therefore, the τ1 time constant is assigned as the excited-state evolution towards the far minimum, τ2 for the ring-opening process and τ3 for the equilibrium between TC and TT isomers. This sequential model was refined by Herzog et al.25 with τ1 attributed to the excited-state relaxation towards the CF minimum and τ2 to overcoming the insignificant barrier that hinders the conversion to the ground state TC. However, according to the time-resolved vibrational spectroscopy study on DPC in acetonitrile by Strudwick et al.,27 the formation of excited state species was ruled out and the internal conversion to the ground state occurs in less than a few hundred fs with the CC isomer as the exclusive product. The subsequent sequential CC → TC → TT transformation was attributed to the τ2 and τ3 time constants of 7 and 13 ps, respectively. Similar results were proposed by Brazevic et al.26 with naphthopyran as the model compound.
Theoretical studies for the photochemical mechanisms of chromenes are relatively limited and the adopted models are usually truncated.29–32 Celani et al.29 performed CASSCF calculations for the parent benzopyran and a ring-opening reaction coordinate on the S1 state is proposed as a transition state connecting the CF intermediate with the acyclic S1/S0 conical intersection (CI). Migani et al.30 carried out combined CASPT2//CASSCF calculations for the parent and 2,2-diethyl-2H-chromene and proposed the same photochromic mechanism as that of Celani et al.29 Furthermore, the energy profile along the S1 state ring-opening reaction coordinate was refined with the inclusion of a dynamic correlation energy. The barrierless relaxation slope was observed to encounter a flat initial stage, which is inconsistent with experiment results and this process would finish within a few hundred fs. The quantum yield dependence on the excitation of vibronic modes33,34 is interpreted by the fact that the low-frequency ring-puckering mode has the largest projection onto the reactive out-of-plane mode which promotes the C–O fission process. With 2H-pyran used as the model compound, Hewage31 utilized the maximum overlap method to explore the excited state ring opening process. The conversion from the more stable ring-puckered conformation to the planar form is required to activate the ring-opening process. Galvão32 reported a CR-EOMCCSD(T)//CIS study on benzopyran with both CF and CC intermediates optimized on the S1 state and suggested the internal conversion may occur earlier when approaching CI along reaction path. Besides these truncated models, Chuev et al.35 explored the ground and first excited state pyran-ring opening mechanism of 2H-pyridochromene derivatives utilizing the semi-empirical PM3 method with a multielectron configuration interaction. The formation of TC was proposed to follow a similar CI dominated relaxation pathway, as interpreted by ab initio calculations.29,30 Furthermore, TT formation was attributed to a vertical decay from the OF-type S1 minimum. In a recent series of combined time-resolved spectroscopy and theoretical studies by the Burdzinski group aimed at unmasking the substitution control on naphthopyran photocoloration mechanisms,9,12,13,26 the ADC(2) method with a cc-pVDZ basis set was employed to construct minimum energy potential energy curves (PECs) or 2-dimensional potential energy surfaces (PESs) towards specific reaction coordinates. The sequential CF ↔ CF* → CC → TC → TT mechanisms were verified as the energetically favored reaction pathway, however, the S1 PES connecting the CF Franck–Condon and the S1/S0 conical intersection regions was steeply descending without an initially flat topology. Although the electronic structure calculation studies provided qualitative reaction routes based on key intermediates, the time-dependent dynamical properties, such as lifetimes for reactive transients, quantum yields and branching ratios between different pathways, rely on nonadiabatic molecular dynamics simulations. Among the popular methods, the global switching algorithm36 (without calculating the nonadiabatic coupling vector) based trajectory surface hopping dynamics simulations with time dependent density functional theory (TDDFT) on-the-fly potential energy surfaces has been successfully applied to simulate ultrafast photo-triggered processes of realistic systems.37–39 In the present work, the TD-CAM-B3LYP-D3/def2-SV(P) nonadiabatic molecular dynamics simulations based on a global switching algorithm is utilized to investigate the mechanisms for photo-triggered ring-opening and ensuing ring-opening and isomerization reactions of the DPC. A quantitatively dynamic point of view for the competition and cooperation of ring-opening and ring-inversion pathways as well as the effects of intramolecular hydrogen bonds are presented in the present study.
2. Computational methods and details
Following studies for spirobenzopyran,40,41 DPC can also have two nearly isoenergetic CF conformations of DPC-T and DPC-C isomers due to pyran ring inversion, however, only one of them was considered in previous theoretical investigations.29–32 In the present study, we consider both of them and define the C-type (T-type) isomer as the pyran ring bending to the left (right)-hand side as shown in Fig. 1. Both electronic structure calculations and on-the-fly trajectory surface hopping molecular dynamics simulations for DPC are performed utilizing the TDDFT method with a long-range corrected CAM-B3LYP hybrid functional,42 which has been recommended to provide optimal results for the photochemical cyclization of a similar benzopyran derivative.43We made the benchmark calculation by using a static-dynamic-static multi-state multi-reference second-order perturbation method (SDSPT2)44,45 at (TD)-CAM-B3LYP-D3 optimized geometries for ten key electronic structures, as shown in Fig. 2. In SDSPT2 calculations, the active space with 12 electrons in 11 orbitals (12e, 11o) is composed of five π and four π* orbitals of benzopyran as well as the σ and σ* orbitals of the C(spiro)–O bond in which the iCAS46 approach is adopted to ensure active spaces for all the optimized geometries maintaining the same atomic orbital character. The energy profiles calculated by (TD)-CAM-B3LYP-D3/def2-SVP are in good agreement with those calculated by SDSPT2/def2-SVP, as shown in Fig. 3 and in Table S1 (ESI†) (the relative energy differences between these two methods are less than 0.3 eV except for S1-C). Actually, the SDSPT2 calculation indicates that the single electron excitation configurations are dominant for the S1 state in all the key intermediates involved in the DPC ring-opening reaction. Therefore, the TD-CAM-B3LYP-D3/def2-SVP is a suitable choice for investigating the photochemical reaction of DPC starting from the S1 state.
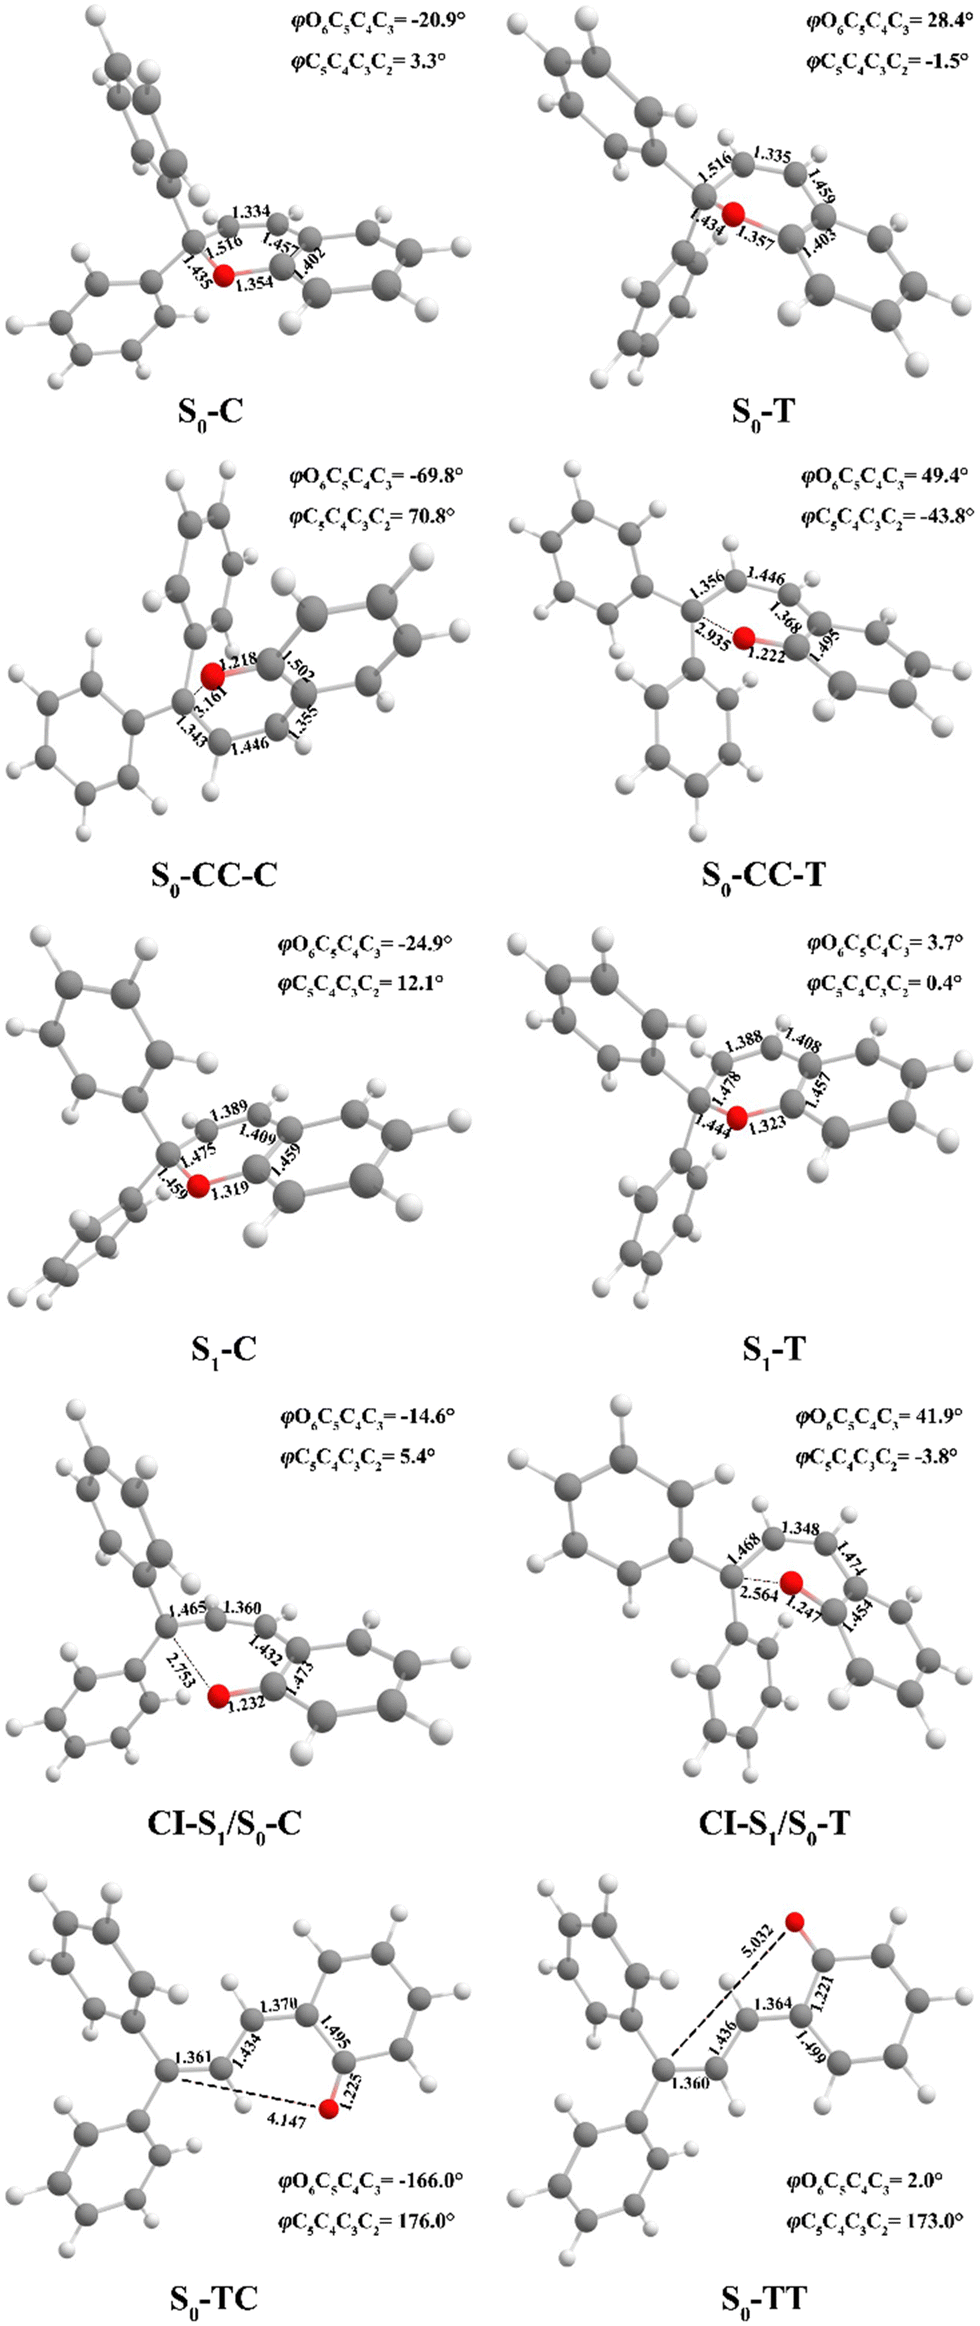 | ||
| Fig. 2 Optimized geometry structures of ten critical points for DPC (bond length in angstroms and dihedral angles in degrees) by (TD)-CAM-B3LYP-D3/def2-SVP. | ||
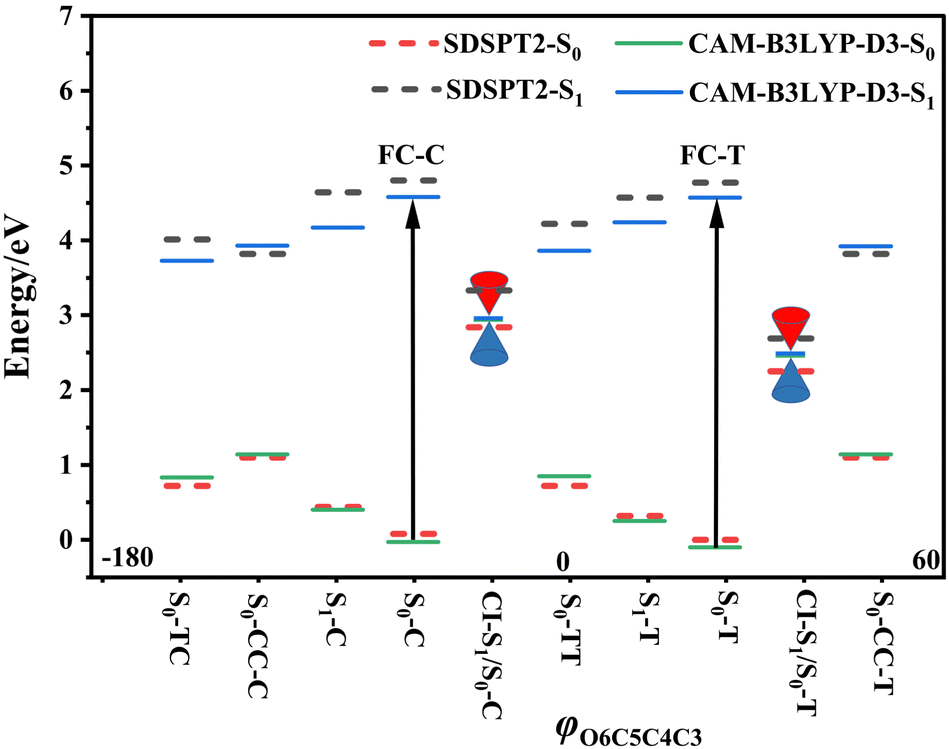 | ||
| Fig. 3 Potential energy profiles for DPC isomers; the eight minima plus two conical intersections with respect to the φO6C5C4C3 dihedral angle. FC-C and FC-F stand for the Franck–Condon regions for its corresponding S0-C and S0-T minima, respectively. The SDSPT2 energy calculations (dashed lines) were carried out at (TD)-CAM-B3LYP-D3 optimized geometries (solid lines). | ||
The Grimme's D3 dispersion correction47 is adopted to achieve a better description of the intramolecular hydrogen bonding. In the geometry optimization and single point energy calculation, the def2-SVP basis set48 is used. All local minima on both the S0 and S1 states are optimized, and the linear interpolated internal coordinate (LIIC) PES scans and ground state minimum energy reaction paths are calculated by using the ORCA49 program. Moreover, the conical intersections between the S1 and S0 states are optimized at the TD-CAM-B3LYP-D3/def2-SVP level by a BDF program suite50 and their energies are recalculated by ORCA with the same method. The multistate SDSPT2 calculations are conducted by the Xi’an-CI module51 in the BDF program.
The nonadiabatic molecular dynamics simulations are performed by using the TD-CAM-B3LYP-D3 on-the-fly potential energy surfaces with a global switching based trajectory surface hopping algorithm. The time limit for trajectory propagation is set as 1.5 ps, but for those resonance trajectories without experiencing any attempt at hopping during the evolution, an additional 1.5 ps is added in order to ensure the internal conversion to ground state S0. The step size for both electronic and nuclear motions is chosen as 0.5 fs. Nuclear motion is propagated by numerically integrating the Newtonian equation of motion with the velocity-Verlet method.52 In order to accelerate the trajectory simulation, a slightly small basis set def2-SV(P)48 plus the resolution of identity (RI) approach53 are considered in on-the-fly trajectory surface hopping calculations for both potential energies and energy gradients. Actually, all the optimized structures obtained by def2-SV(P) basis set with RI approximations are basically identical with those calculated with the def2-SVP basis set without RI. A dynamical code from our own group is utilized to do on-the-fly trajectory propagation, and a global switching algorithm36 is used to compute the nonadiabatic hopping probability whenever an avoided crossing point is detected (minimum energy separation between two adjacent adiabatic PESs in three consecutive time steps). The initial geometries and velocities for the sampling trajectories are obtained by random seed sampling with a Boltzmann distribution at a temperature of 300 K. A total of 200 (150) sampling trajectories are run starting from vertically excited DPC-T (DPC-C) to the Franck–Condon region on the S1 state. The TDDFT on-the-fly potential energy surfaces are carried out by using the ORCA49 program.
After a trajectory hops to the ground state S0, we collect metastable cisoid-cis (CC), namely C-type (S0-CC-C) and T-type (S0-CC-T) intermediates, when the rCO distance matches the optimized S0-CC intermediate form. When trajectories propagate to the transoid-cis (TC) conformer, we define the optimized S0-TC as products by detecting two dihedral angles φC2C3C4C5 and φC1C2C3C4 varying in 180 ± 20° and 0 ± 20°, respectively. On the other hand, for nonreactive trajectories back to minima on the S0 state, namely C-type (S0-C) and T-type (S0-T), the terminal condition is set as an rCO distance varying in the 1.40 ± 0.10 Å region.
3. Results and discussion
3.1 Minima and S1/S0 conical intersections for DPC-C and DPC-T
We carried out optimization at the CAM-B3LYP-D3/def2-SVP level of theory and found two minima corresponding to the colorless closed form (CF), namely S0-T and S0-C, and four other minima corresponding to the colored open form (OF), namely S0-CC-T, S0-CC-C, S0-TT and S0-TC. We also found two CF minima on the S1 state, namely S1-T and S1-C. Two conical intersections are also optimized as T-type CI-S1/S0-T and C-type CI-S1/S0-C between the ground S0 and excited S1 states. All the geometry structures of the ten critical points are depicted in Fig. 2 in which the two most important dihedral angles φO6C5C4C3 and φC5C4C3C2 plus six bond lengths in the center ring of DPC are explicitly marked. The more complete set of internal coordinates for these ten critical points are given in Table S2 (ESI†) and the corresponding Cartesian coordinates are given in the last section of the ESI.† The energy of the global minimum of S0-T is set as zero and energies for the other nine isomers are calculated based on S0-T, and potential energy profiles are depicted in Fig. 3 arranged from −180° to +60° with respect to the φO6C5C4C3 dihedral angle (corresponding data are given in Table S3 (ESI†)).The energy difference between S0-T and S0-C is 0.07 eV and it is similar to those for the analog molecules of spirobenzopyran.40,41 The conformation difference originates from the pyran ring inversion direction and amplitude of the benzene ring twisting associated with the intramolecular C–H⋯O and C–H⋯π hydrogen bonding. The φO6C5C4C3 values in S0-T and S0-C are 28.4° and −20.9°, respectively. The phenyl ring twisting angles φC13C12C5C4 and φC18C11C5C4 for S0-T (S0-C) are 174.5° (−148.3°) and 90.1° (57.6°), respectively, and this implies that the O6 atom position determines the conformation of the two phenyl rings. Additionally, the bond lengths rH38O6, rH29O6, rH34C12, rH33C4 and rH29C11 in S0-T and S0-C are 2.312 (2.336) Å, 2.660 (3.349) Å, 2.666 (3.025) Å, 2.497 (2.554) Å, and 2.898 (2.533) Å, respectively. The latter three are shorter than the conventional C–H⋯π hydrogen bonding length in T-shape stacked benzene. It is clear that the intramolecular hydrogen bonds between the benzene and pyran rings play an important role in the spatial topology of DPC and would also affect the molecular structure evolution in the photo-induced dynamics processes. The relatively stronger intramolecular hydrogen bonding in S0-T leads to a lower energy in comparison with that of S0-C. The isomerization between S0-T and S0-C could easily take place on the S0 state since this process is basically barrierless, as shown in Fig. S1a (ESI†).
The vertical excitation energy to the S1 state is estimated as 4.67 eV (4.61 eV) from the Franck–Condon region of S0-T (S0-C) and the corresponding oscillator strength is 0.11 (0.12), and this indicates that the S1 state is the lowest “bright” state. The main electronic configuration is the HOMO → LUMO transition for the S1 state. The S1-T minimum has a planar benzopyran moiety which lies in the middle of the S1 state isomerization pathway between the Franck–Condon (FC) regions of DPC-T and DPC-C with the selected internal coordinates close to the average value from S0-T and S0-C. It can be seen from the LIIC PESs of FC-C ↔ S1-T ↔ FC-T in Fig. S1b (ESI†) that the depth of the smooth potential well is about 0.32 eV, and this indicates that the helicity interconversion would take place upon S1 excitation and this plays an important role for the ring-opening process starting from both FC-C and FC-T. On the other hand, the S1-C minimum lies in vicinity of the FC-C region, with a 0.025 Å longer bond length rO6C5 and 0.07 eV lower in energy than S1-T.
The energy difference between FC-C and CI-S1/S0-C (FC-T and CI-S1/S0-T) is 1.62 eV (2.08 eV), in agreement with those reported for benzopyran (1.73 eV by CASPT230) and naphthopyran (1.79 eV by ADC(2)26). Two conical intersections have low energy in comparison with that of the FC regions and thus this could lead to efficient decay processes for the photo-induced ring-opening dynamics of DPC. As depicted in Fig. 2, the geometry structures of CI-S1/S0-C and CI-S1/S0-T are quite different, and this indicates that the decay processes approaching two conical intersections can be quite different from those of its corresponding FC regions. The structure of CI-S1/S0-C is similar to that of S1-C with a relative planar pyran ring moiety, but with a 1.294 Å longer rO6C5 bond and 0.087 Å shorter rO6C1 bond than those of S1-C. This indicates that semi-opened quinoid character in-plane pyran ring expansion of CI-S1/S0-C can be involved in the DPC-C relaxation process on the S1 state. While, in comparison with that of CI-S1/S0-T, it has a 1.12 Å longer rO6C5 bond and 0.076 Å shorter rO6C1 bond than that of S1-T. Comparing with the rO6C5 bond of 2.753 Å (2.564 Å) for CI-S1/S0-C (CI-S1/S0-T), its rH29O6 bond increased to 3.792 Å (3.214 Å). The lengths of other intramolecular hydrogen bonds remain close to those in the corresponding S1 minimum or FC. This indicates that as C5–O6 bond dissociation occurs, the other hydrogen bonds are accompanied with a pyran ring expansion and inversion motion. This can be seen from the fact that the rO6C5 bond of the intermediate local minimum S0-CC-C (S0-CC-T) is increased to 3.161 Å (2.935 Å) in comparison with that of its corresponding CI-S1/S0-C (CI-S1/S0-T). However, the rearrangement of bonds in the pyran ring moiety is completed in S0-CC-C (S0-CC-T), as the rO6C1, rC4C5 and rC2C3 convert into double bonds, while the rC3C4 and rC1C2 become single bonds, and these are opposite to the corresponding CI-S1/S0-C (CI-S1/S0-T). Both S0-CC-C and S0-CC-T approach S0-TC from the opposite direction with two benzene rings exchanging position as seen from the twisting towards φC5C4C3C2. Finally, φC5C4C3C2 for S0-TT (S0-TC) is 173.0° (176.0°), and the relative energies and VEEs for these two isomers are quite similar, which is in agreement with previous experimental reports.20–28
3.2 Quantum yields and time constants for DPC-C and DPC-T
We have performed 200 (150) sampling trajectories starting from S0-T (S0-C) vertically excited to the FC-T (FC-C) region on the S1 surface, and we have plotted trajectory hopping spots at CI-S1/S0-T and CI-S1/S0-C in terms of time evolution, as shown in Fig. 4a, distributions of S0-CC-T and S0-CC-C intermediate formations after hopping, as shown in Fig. 4b, and distributions of S0-TC product formations from the corresponding S0-CC, as shown in Fig. 4c. Among all the sampling trajectories, no matter starting from FC-T or FC-C, most could end up as products of the S0-TC region but none of them could reach the S0-TT region. Actually, the 181 (114) sampling trajectories initially starting from the FC-T (FC-C) region end up at the S0-TC region after the S1 → S0 decay processes, and thus the simulated ring-opening quantum yield of 181/200 = 0.91 (114/150 = 0.76) is in very good agreement with the experimental value of 0.7–0.9.20,21 As shown in Fig. 4a, most of the trajectories starting from FC-T decay to the S0 state within 200 fs, while in the case starting from FC-C, the maximum number of hopping events occurs at ∼400 fs for the pyran ring conformations in both the isomerized and retained ones. The wide regional distribution of hopping points in terms of time indicates that trajectories starting from FC-C region can experience a different number of periods of vibrations at the S1 state potential well before reaching the conical intersections. After the trajectories hop at CI-S1/S0, the process of conversion into the S0-CC intermediate takes place at an ultrafast time scale, as shown in Fig. 4b; most of the trajectories take less than 40 fs from CI-S1/S0 to S0-CC, and trajectories starting from the FC-T region are slightly faster than those starting from the FC-C region. Very few trajectories take up to 300 fs to achieve a transformation into S0-CC as accompanied with the pyran ring moiety conformation conversion. For trajectories running from S0-CC to the S0-TC product region, it is surprising that the trajectories starting from the FC-T region need a much longer time than those starting from the FC-C region, and the peak time scale is about 1100 fs from the FC-T region versus 300 and 700 fs from the FC-C region. Due to the wide distribution of time constants in Fig. 4 and limited number of trajectories, the time profiles are analyzed with the arithmetic mean value μ and standard deviation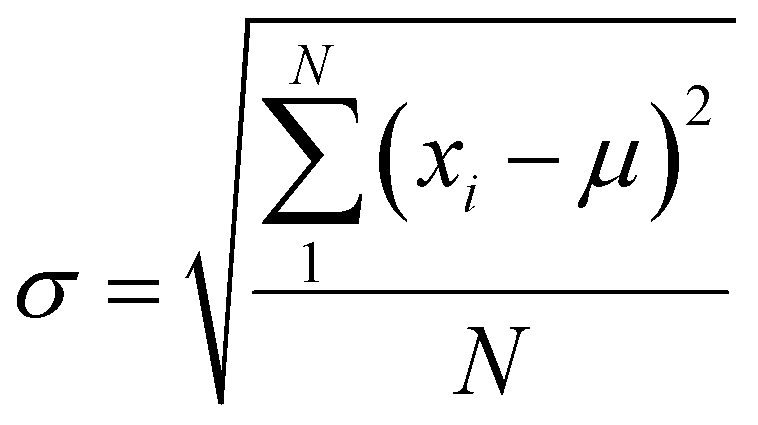 where N is the number of trajectories, and xi is the time constant of each trajectory. We can estimate the trajectory average lifetimes (standard deviation) for reaching CI-S1/S0 hops, to S0-CC intermediates, and to S0-TC products as 141.8 (126.2) fs, 180.0 (135.5) fs and 1271.5 (616.8) fs, respectively, for those starting from the FC-T region, and as 439.8 (355.4) fs, 540.2 (227.2) fs, and 1203.9 (412.6) fs, respectively, for those starting from the FC-C region. We consider the Gibbs free energy difference between S0-T and S0-C to be about 1.1 kcal mol−1 (energy corrected by the def2-TZVP basis set at geometries optimized by def2-SVP). According to the Boltzmann statistical distribution at room temperature (25 °C), the equilibrium weight is estimated as 13.5% at S0-C vs. 86.5% at S0-T, for which the weight averaged lifetimes are estimated for S1 state relaxation to CI-S1/S0 hops, to S0-CC intermediates, and to S0-TC products as 182.0 fs, 228.6 fs, and 1262.4 fs, respectively. The simulation results confirm that the DPC ring opening takes place sequentially, and comparing with the experiments of Gentili et al.,23 Moine et al.,24 Herzog et al.25 and Strudwick et al.,27 who also agree with a sequential model, their predicted τ1 values of 0.23 ± 0.05 ps, 0.45 ps, and 0.20 ± 0.10 ps a and few hundred fs assigned to the S1 intermediate formation or S1/S0 decay can be explained by the first two theoretical averaged lifetimes. Moreover, the simulated S0-TC formation lifetime of 1262.4 fs also agrees with the experimentally fitted time constants τ2 of 1.4 ± 0.5 ps, 1.8 ps and 1.3 ± 0.3 ps. However, the experimentally predicted τ3 time constant of up to tens of ps that is assigned as vibrational cooling or equilibration within S0-TC and S0-TT, which belongs to adiabatic motion on the ground state, is beyond the interest of the present work.
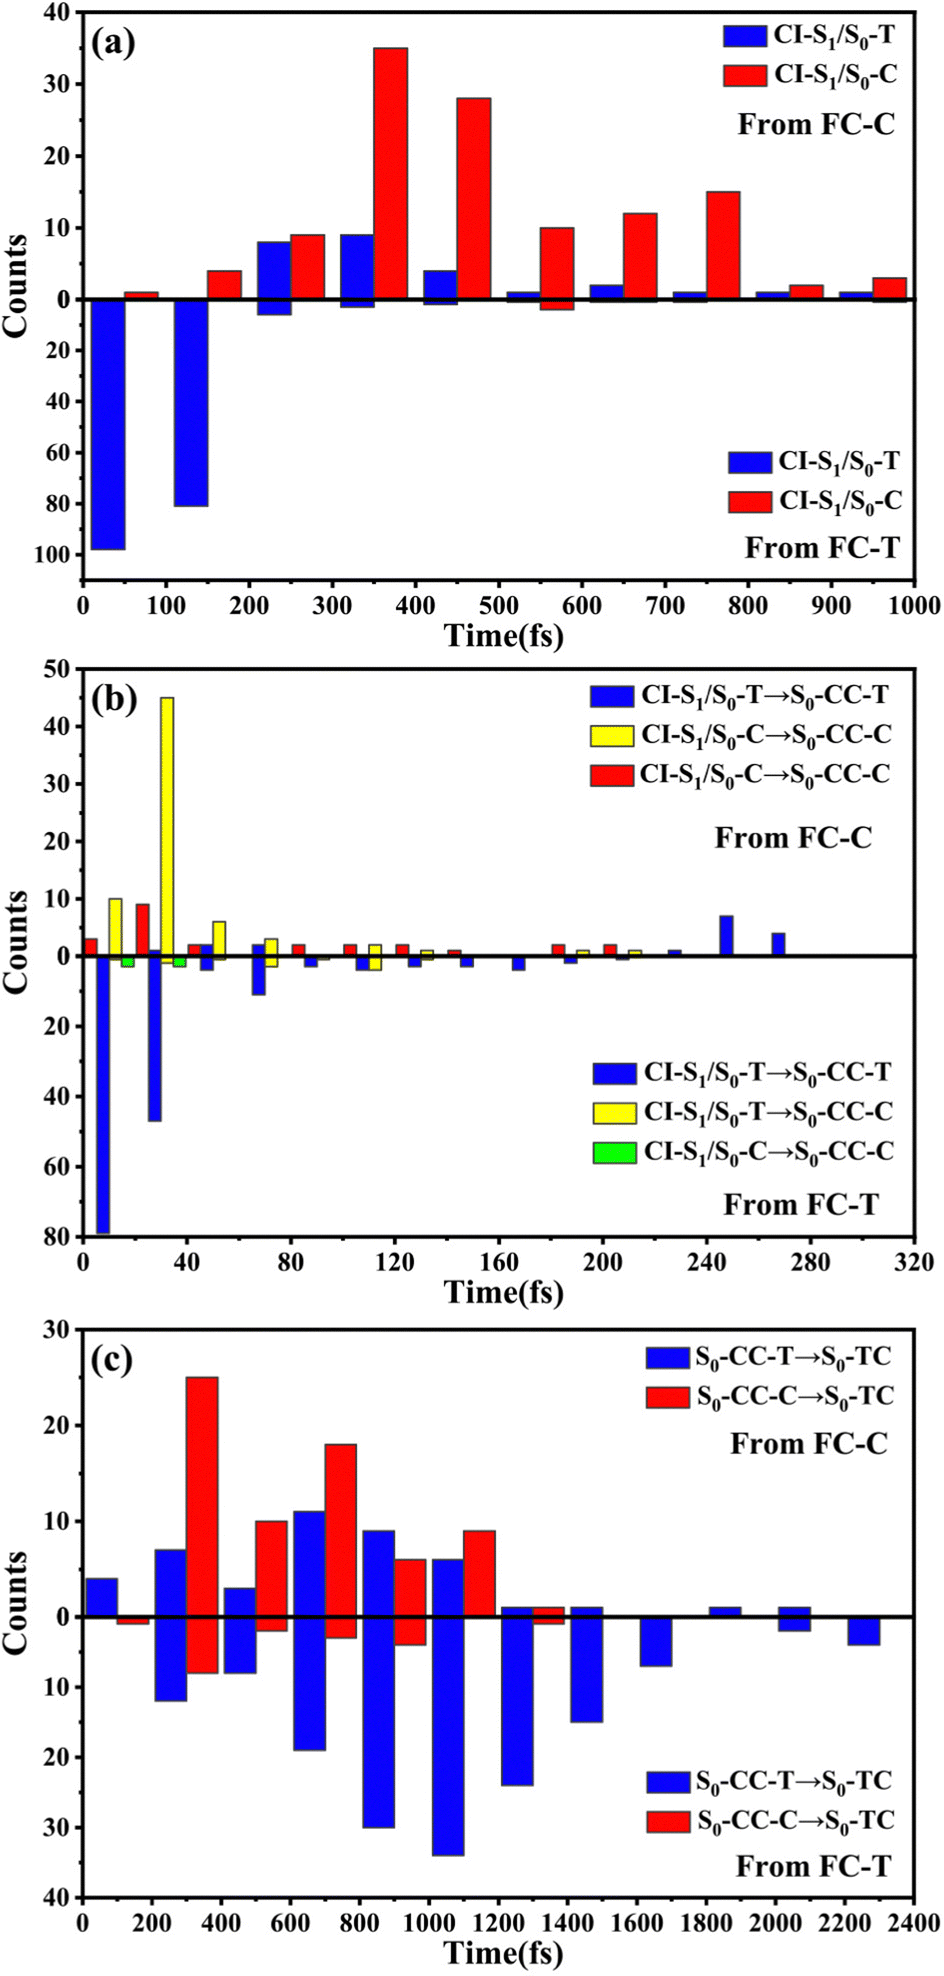 | ||
| Fig. 4 Various distributions for sampling trajectories starting from FC-C and FC-T with respect to time. (a) Hopping spots around CI-S1/S0-T and CI-S1/S0-C, (b) CI-S1/S0 to S0-CC formation and (c) S0-CC to S0-TC formation. | ||
Let us turn to a more detailed analysis about the trajectory hopping spot distributions at CI-S1/S0-T and CI-S1/S0-C in terms of two key internal coordinates, rC5O6 and φC4C3C2C1, as shown in Fig. 5, at which the sampling trajectories are marked as finally ending up with ring closing or opening region. The rC5O6 bond is the main relaxation coordinate that elongates to the hopping region at 2.4–2.9 Å for trajectories starting from both FC-T and FC-C, and this indicates that the pyran ring inversion induced DPC-C ↔ DPC-T isomerization could be taking place on the S1 state. While the hopping region of φC4C3C2C1 is mainly distributed around −30° (+30°), as shown in Fig. 5a (Fig. 5b) for trajectories starting from FC-T (FC-C). Fig. 5 indicates that the DPC-C → DPC-T isomerization ratio is about 18.7% in comparison to the DPC-T → DPC-C isomerization ratio of about 3.0%. This is because the potential well on the S1 state makes trajectories starting from FC-C get more chance to isomerize to DPC-T than the trajectories starting from FC-T, which favors the barrierless relaxation path to CI-S1/S0-T on the S1 state than the potential well hampered DPC-T → DPC-C isomerization. After the sampling trajectories hopping to the ground state, they can form an intermediate state S0-CC, which is described mostly by two key dihedral angles, φC5C4C3C2 and φH24C4C5C12. Trajectories starting from FC-T can form an intermediate state S0-CC-C around φC5C4C3C2 0°–140° and φH24C4C5C12 0°–60°, as shown in Fig. 6a, while trajectories starting from FC-C can form intermediate state S0-CC-T around φC5C4C3C2 −110° to −50° and φH24C4C5C12 ±150° to ±180°, as shown in Fig. 6b. Based on the asynchronous rotation motion of φC5C4C3C2 and φH24C4C5C12, the ground state pyran inversion can be attributed to H24 out of the C5C4C3 plane (HOOP) motion during an aliphatic bridge rearrangement. After a fast H24 twisting motion (finishing at a similar time scale to those that do not experience S0 pyran inversion, ca. 20 fs), the ensuing large amplitude φC5C4C3C2 twisting takes place with a much longer time scale. It has been reported that the HOOP motion plays an important role in the excited state decay of spirobenzopyran,40,41 but for DPC, the influence is less evident. Fig. S2 (ESI†) shows hopping-spot distributions at CI-S1/S0-C and CI-S1/S0-T with respect to the φH24C4C5C3 and φH23C3C4C2 dihedral angles, and HOOP coordinates φH23C3C4C2 and φH24C4C5C3 are distributed from −20° to +20° for trajectories starting from both FC-C and FC-T. HOOP motions of the two typical trajectories starting from FC-T (FC-C) are demonstrated in terms of the rC5O6 bond dissociation against varying of the two HOOP coordinates as shown in Fig. S3 and S4 (ESI†).
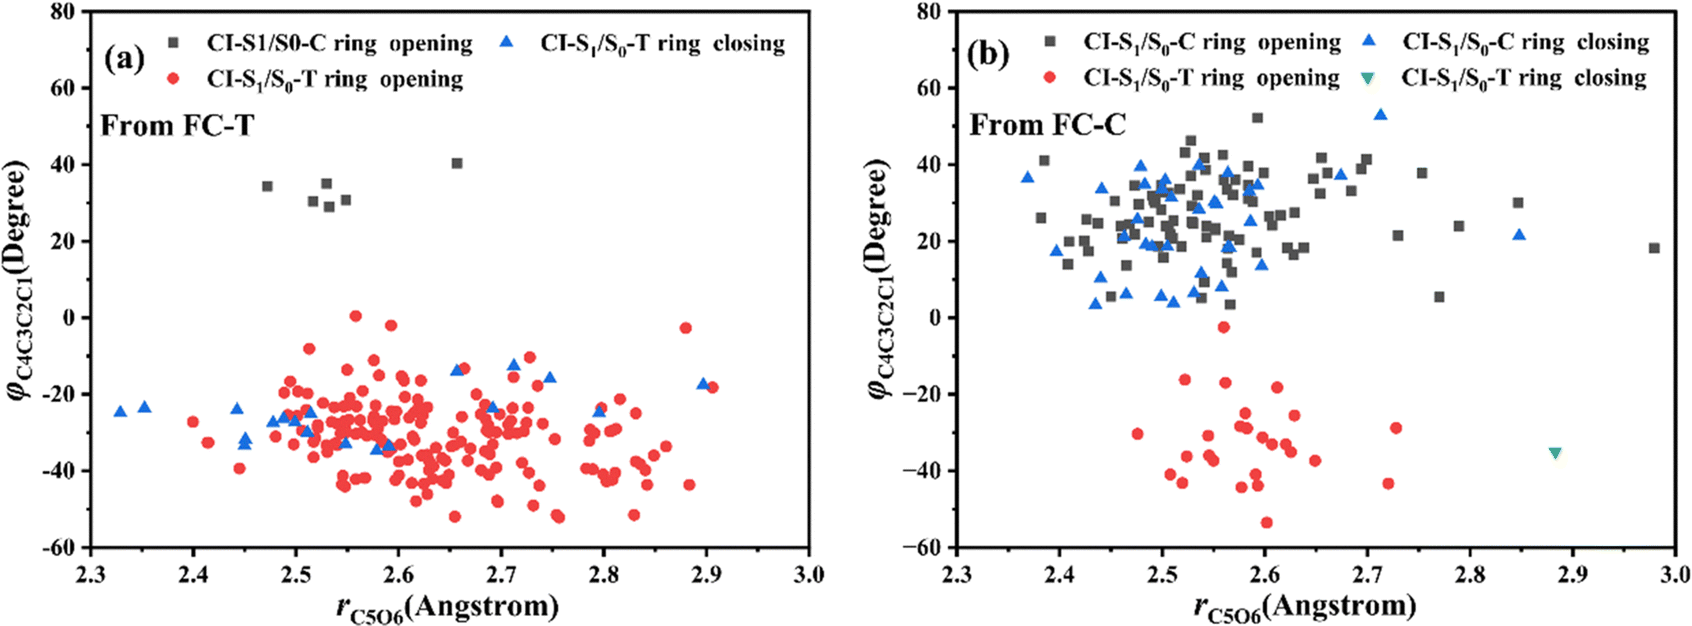 | ||
| Fig. 5 Hopping-spot distributions at CI-S1/S0-C and CI-S1/S0-T with respect to the rO6C5 bond and φO6C5C4C3 dihedral angle for trajectories starting from (a) FC-T and (b) FC-C. | ||
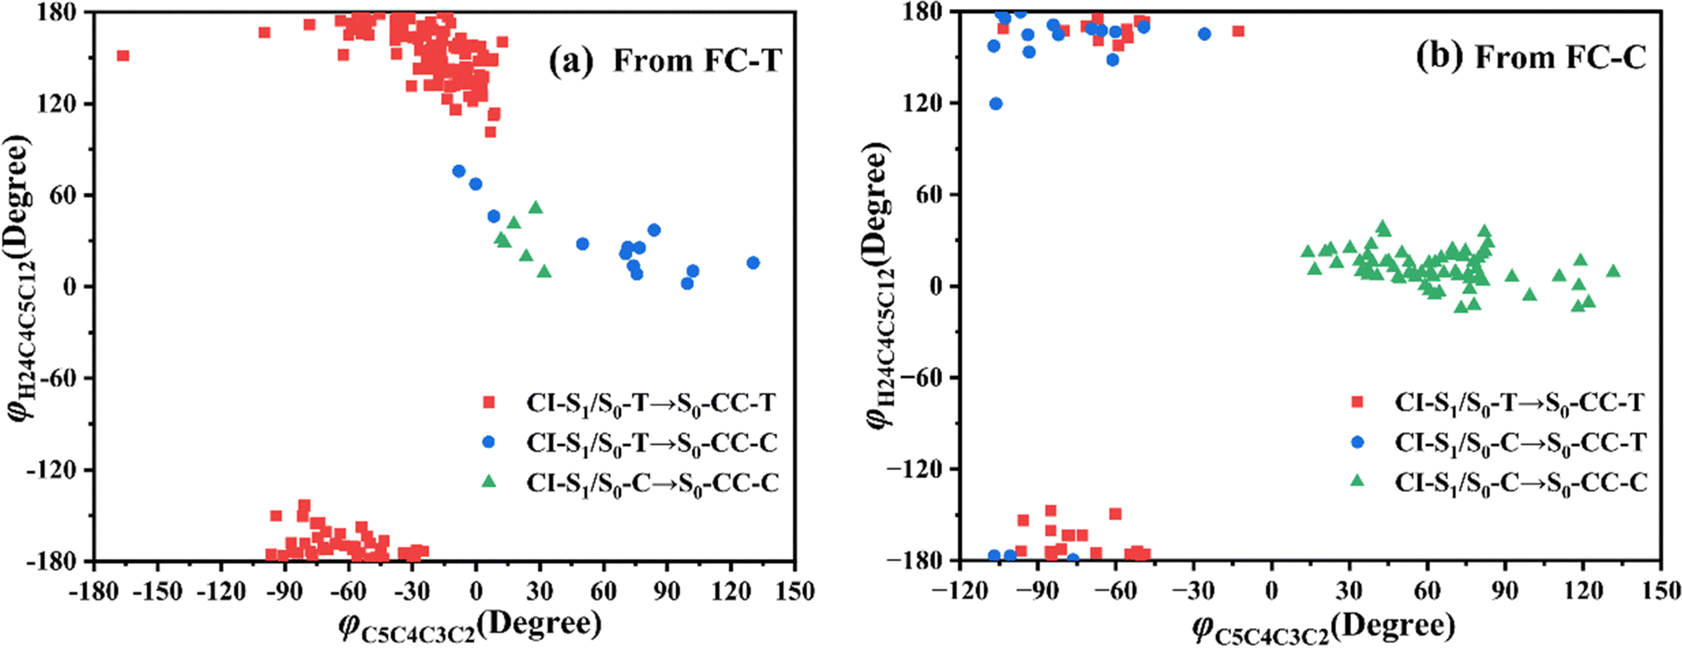 | ||
| Fig. 6 Distributions of CI-S1/S0 to S0-CC formations with respect to φH24C4C5C12 and φC5C4C3C2 dihedral angles for trajectories starting from (a) FC-T and (b) FC-C. | ||
Finally, we summarize the relaxation pathways for the sampling trajectories starting from FC-T (FC-C) on the S1 state, as shown in Fig. 7. For the trajectories starting from FC-T, the major S1 state relaxation pathway is C5–O6 bond dissociation followed by hopping via CI-S1/S0-T, which accounts for 97.0% of trajectories, as shown in Fig. 7a. The minor relaxation pathway accounts for 3.0% of trajectories hopping at CI-S1/S0-C, which consists of sequential pyran chirality conversion and C5–O6 bond dissociation. As illustrated in Fig. 7a, once the trajectories decay to the S0 state via CI-S1/S0-T, 9.5% go back to the S0-T reactant, 81.0% evolve directly to the S0-CC-T intermediate, and the rest, 6.5%, yield the S0-CC-C intermediate by means of a ground state HOOP induced aliphatic chain inversion. Similar analysis can be made for relaxation pathways for the sampling trajectories starting from FC-C, as shown in Fig. 7b, in which the major relaxation pathway accounts for 81.3% of trajectories hopping at CI-S1/S0-C, followed by 23.3% back to S0-C, 46.0% converting to S0-CC-C as the C5–O6 elongation and 12.0% transforming to S0-CC-T due to C5C4C3C2 twisting motion. The minor relaxation pathway that inverts the pyran moiety on the S1 state accounts for 18.7% of trajectories hopping at CI-S1/S0-T, followed by 0.7% back to S0-T and the rest go via S0-CC-T before reaching S0-TC. In the next sections, we will demonstrate relaxation mechanisms with time constants for each step as listed in Table S4 (ESI†) based on representative ring-opening trajectories for the sampling trajectories starting from FC-T and FC-C separately.
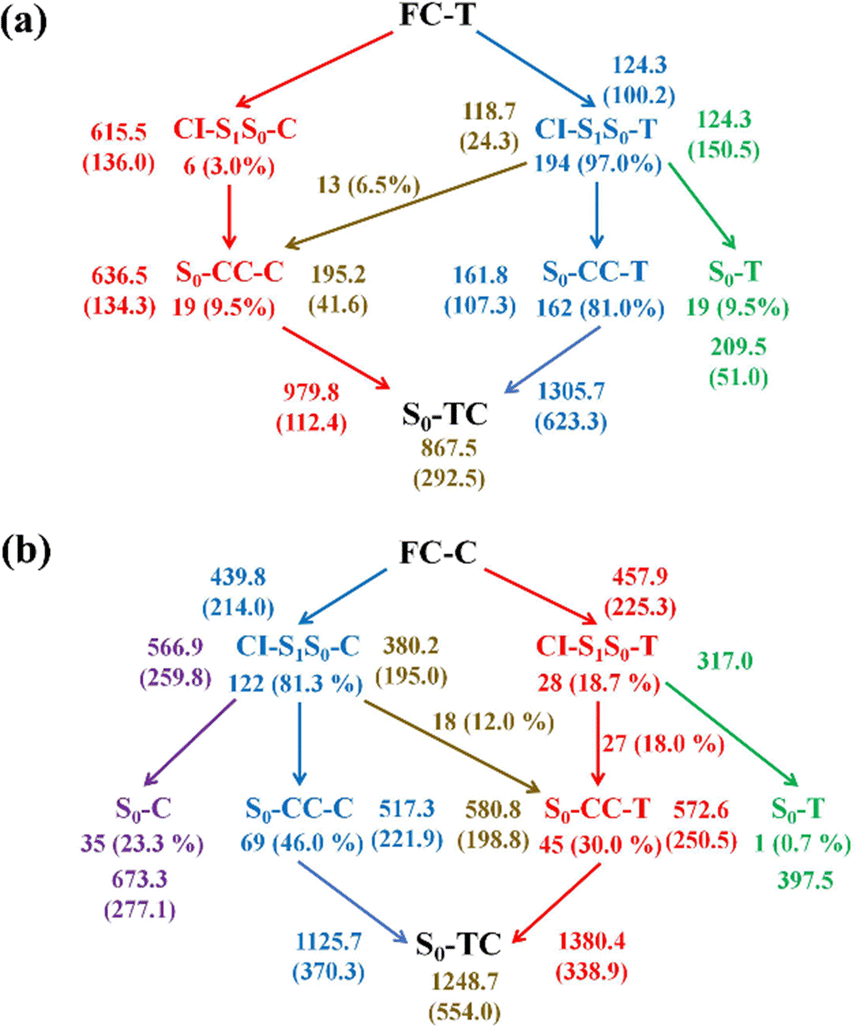 | ||
| Fig. 7 Photorelaxation mechanisms and branching ratios for trajectories starting from (a) FC-T and (b) FC-C. The average time constants (standard deviation) for S1/S0 hop, S0-CC intermediate formation, and ring-opening product formation processes in the ring-opening pathways and two step (no S0-CC intermediate) nonreactive pathways are presented with the same color as the arrows. | ||
3.3 Photorelaxation mechanism based on typical trajectories starting from FC-T
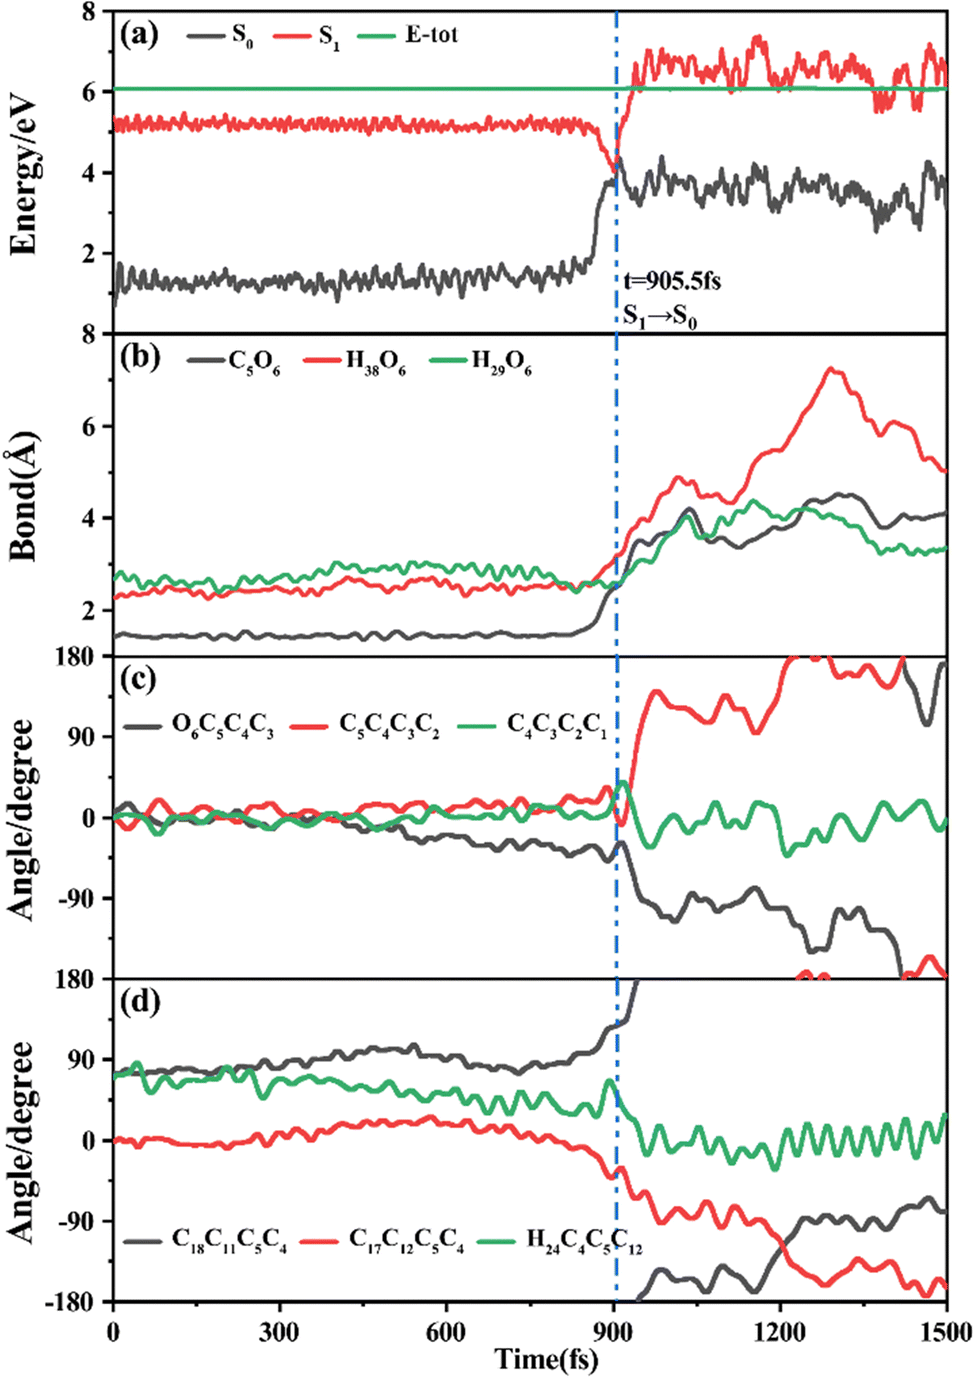
Among 200 sampling trajectories starting from FC-T, 162 following the FC-T → CI-S1/S0-T → S0-CC-T → S0-TC ring-opening reaction pathway, the average lifetime is 123.9 fs with a standard deviation of 96.6 fs. A typical trajectory following this mechanism is shown in Fig. 8 with the S1 → S0 hop at 80.0 fs. Along with the rC5O6 elongation dissociation, rH38O6 and rH29O6 bonds keep within the less than 3.0 Å region before hopping, and this implies that intramolecular C–H⋯O hydrogen bonds interact with the ring-opening process on the S1 state. After decay to S0, rH38O6 and rH29O6 fluctuate toward 6.0 Å and 3.5 Å, respectively, and this reflects that during the separation of the quinoid ring from the left benzene ring, the direction of the carbonyl oxygen keeps its head to the right benzene ring. The oscillation of φC5C4C3C2 shown in Fig. 8c indicates that intermediate S0-CC-T forms at 92.5 fs with φC5C4C3C2 around −90° and S0-TC forms at 411.5 fs with φC5C4C3C2 around −180°. This sample trajectory is trapped in the S0-CC-T potential well for 319.0 fs, however, the average trapping time is 1144.0 fs with a standard deviation of 628.2 fs, implying a multi-cycle vibration relaxation within the S0-CC-T potential well may be needed to activate the φC5C4C3C2 twisting mode. After the formation of S0-TC, the conformations of two benzene rings remain basically unchanged due to the reciprocating change of φC18C11C5C4 and φC17C12C5C4. A typical trajectory for the FC-T → CI-S1/S0-T → S0-CC-C → S0-TC ring-opening reaction pathway with a hop at 124 fs and S0-CC-C and S0-TC forming at 133.0 fs and 520.5 fs is shown in Fig. S5 (ESI†), and they only differ as the trajectory goes to the S0-CC-T intermediate before reaching the ring-opening state S0-TC. In Fig. 8, this trajectory goes to S0-CC-C intermediate. Among the total 200 sampling trajectories, 13 follow this pathway, and the time constants for S1/S0 hopping, S0-CC-C formation and S0-TC formation with their standard deviations are 118.7 (24.3) fs, 195.2 (41.6) fs and 867.5 (292.5) fs. In the similar S1 state relaxation process, ground state evolution to the S0-CC-C intermediate is slower than corresponding process to S0-CC-T in Fig. 8, owing to the additional inversion of a benzopyran moiety conformation. The S0-CC-C trapping time evidently shortens to 672.3 fs with a standard deviation of 292.5 fs, since the proceeding ethylenetic bridge twisting benefits further isomerization to S0-TC. Fig. 9 shows a typical trajectory following the FC-T → CI-S1/S0-C → S0-CC-C → S0-TC ring-opening reaction pathway (6 among the total 200 sampling trajectories were via this pathway with time constants and standard deviations of 615.5 (136.0) fs, 636.5 (134.3) fs and 979.8 (112.4) fs) with a hop at 905.5 fs with S0-CC-C and S0-TC forming at 925.0 fs and 1217.0 fs, respectively. The S1 state conformation inversion is much slower compared with those that take place in the S0 state shown in Fig. 8, which can be attributed to the trapping of S1-T and S1-C potential wells between FC-T and CI-S1/S0-C. Moreover, the much accelerated ground state S0-CC-C → S0-TC isomerization is also observed, and it appears that the pre-twisting of the ethylenetic bridge on the S1 state shows a more pronounced effect. As shown in Fig. 9c, during the DPC-T → DPC-C moiety inversion motion on the S1 state, the phenyl rings towards the spiro-carbon keep basically unchanged as the synchronous oscillation motions of rC5O6, rH38O6 and rH29O6 and small amplitude fluctuations of φC18C11C5C4 and φC17C12C5C4. And after hopping, the benzopyran ring inverted C form intermediate S0-CC-C is generated when φC5C4C3C2 varies at ∼90°. Furthermore, the pyran ring inversion can be traced as φO6C5C4C3 varying from a positive geometry to a negative one at a hop spot, as shown in Fig. 9c. The large scale changes of φC18C11C5C4 and φC17C12C5C4 from 90° to −90° and from 0° to −180°, respectively, imply that the synchronous rotation of benzene rings could also be taking place in company with the S0-CC-C intermediate and S0-TC product formation process, as shown in Fig. 9d. Although this pyran inversion pathway for DPC-T is energetically allowed, it is dynamically unfavored.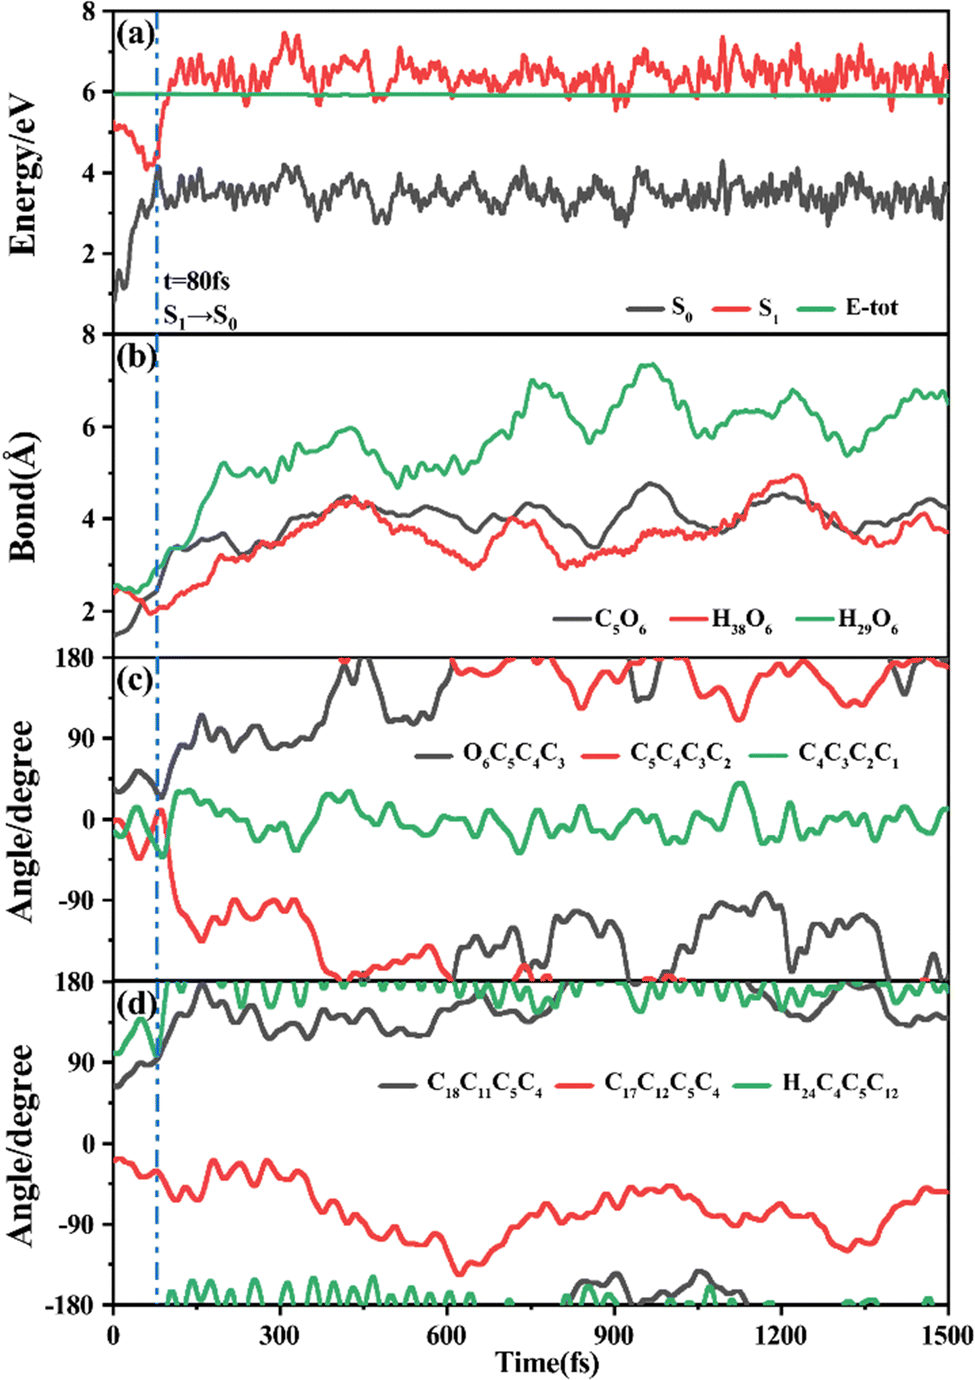 | ||
| Fig. 8 A typical ring-opening reactive trajectory starting from FC-T going via the FC-T → CI-S1/S0-T → S0-CC-T → S0-TC pathway as a function of time. (a) Potential energy profiles of the S0 and S1 states, (b) evolution of rC5O6, rH38O6 and rH29O6, (c) φO6C5C4C3, φC5C4C3C2 and φC4C3C2C1, and (d) φC18C11C5C4, φC17C12C5C4 and φH24C4C5C12. | ||
 | ||
| Fig. 9 A typical ring-opening reactive trajectory starting from FC-T going via the FC-T → CI-S1/S0-C → S0-CC-C → S0-TC pathway as a function of time. (a) Potential energy profiles of the S0 and S1 states, (b) evolution of rC5O6, rH38O6 and rH29O6, (c) φO6C5C4C3, φC5C4C3C2 and φC4C3C2C1, and (d) φC18C11C5C4, φC17C12C5C4 and φH24C4C5C12. | ||
3.4 Photorelaxation mechanism based on typical trajectories starting from FC-C
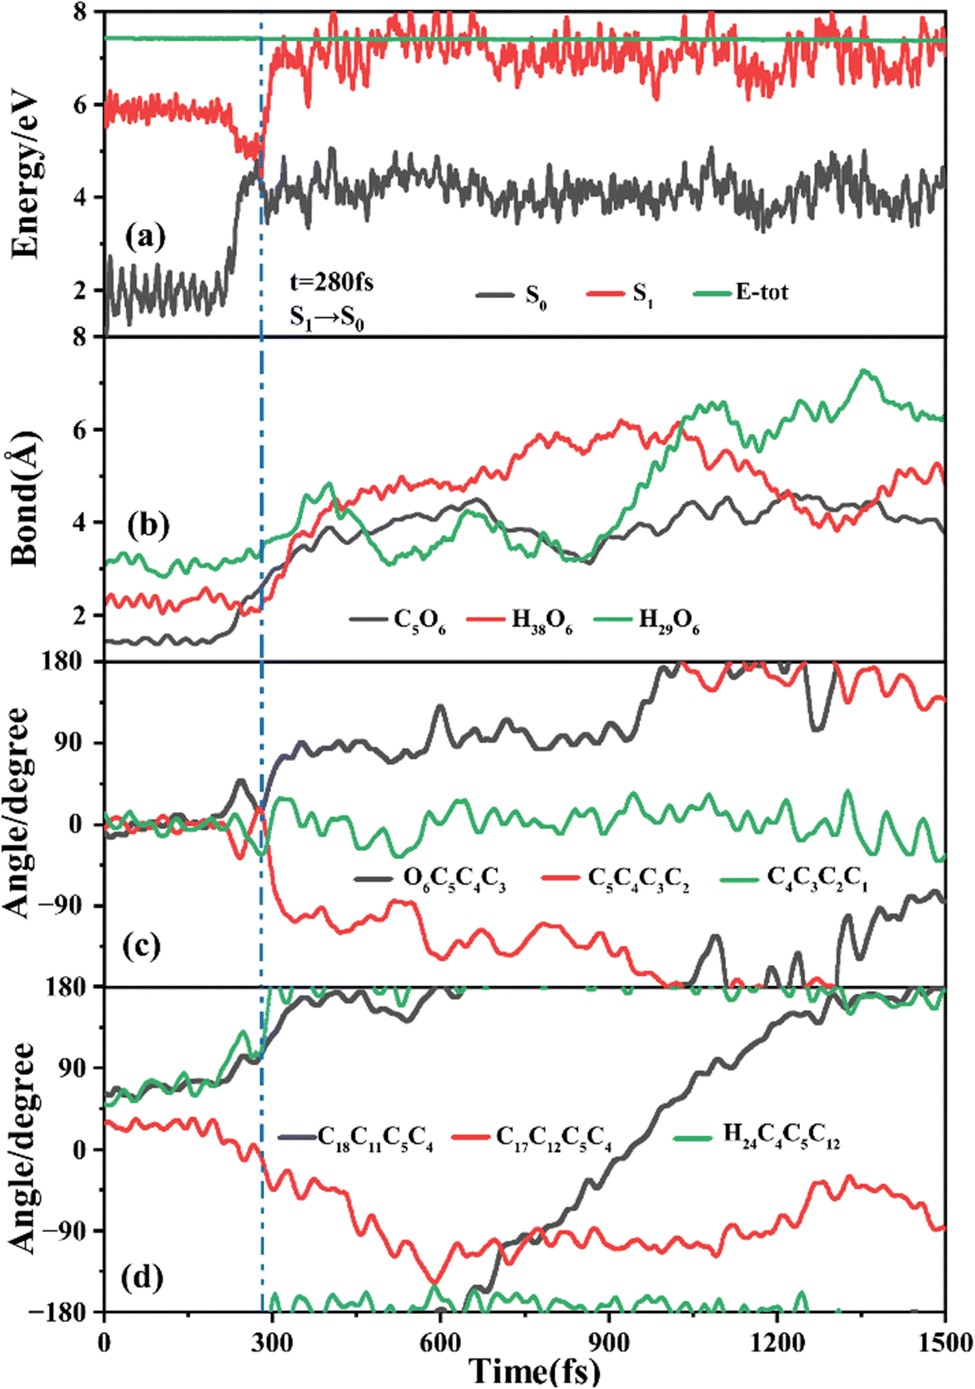
The primary ring-opening reaction pathway starting from FC-C is conformation preserved FC-C → CI-S1/S0-C → S0-CC-C → S0-TC; 69 of the total 150 sampling trajectories are via this pathway with S1/S0 hopping, S0-CC-C formation and S0-TC formation time constants (standard deviation) of 439.8 (214.0) fs, 517.3 (221.9) fs and 1125.7 (370.3) fs. Fig. 10 shows a typical trajectory following this reaction pathway with a hop at 309.0 fs. The initial value of φO6C5C4C3 is negative before hopping and turns positive due to the inversion of the pyran moiety, as shown in Fig. 10c. The evolution tendency of φC5C4C3C2 is symmetric with that of φO6C5C4C3 since these two are neighboring dihedral angels within the same moiety. The platform type variation of φC5C4C3C2 and φO6C5C4C3 values in Fig. 10c correspond to trapping in the S0-CC-C potential well. The average value of 608.4 fs with a standard deviation of 294.2 fs implies that the ground state S0-CC-C → S0-TC isomerization efficiency is comparable with that of the second type of pathway among those that started from FC-T; however, the S1 state relaxation time is closer to the third pathway in Fig. 9 due to the similar out of potential well process. Fig. S6 (ESI†) shows a typical trajectory for a conformation converted ring-opening reaction pathway (FC-C → CI-S1/S0-C → S0-CC-T → S0-TC; 18 among the total of 150 sampling trajectories via this pathway) with a hop at 381.0 fs, and the only difference is that this trajectory goes to a S0-CC-T intermediate while the trajectory in Fig. 10 goes to a S0-CC-C intermediate before reaching the ring-opening state S0-TC. The S1/S0 hopping, S0-CC-T formation and S0-TC formation time constants (standard deviation) for this pathway are 380.2 (195.0) fs, 580.8 (198.8) fs and 1248.7 (554.0) fs, respectively, suggesting that the CI-S1/S0-C → S0-CC-T process is evidently slower than the CI-S1/S0-C → S0-CC-C process. Fig. 11 shows a typical trajectory following the conformation of a converted FC-C → CI-S1/S0-T → S0-CC-T → S0-TC ring-opening pathway (27 among a total of 150 sampling trajectories are via this pathway) with a hop at 280.0 fs. As φO6C5C4C3 switches to a positive sign before hopping, a pyran inversion takes place on the S1 state as shown in Fig. 11c. The intramolecular hydrogen bond participates in the C5–O6 bond dissociation process as both rH38O6 and rH29O6 fluctuate in the 2.0–3.0 Å region before hopping and then rH29O6 changes concurrently with rC5O6 after hopping. The unidirectional twisting of φC18C11C5C4 during the S0-CC-T → S0-TC is displayed in Fig. 11d, and this indicates that the benzene ring rotation could also interplay with isomerization of the aliphatic chain. The HOOP motion of H24 heads to ∼0° conformation preserved trajectory, whereas, upon a DPC-C → DPC-T isomerization conversion, the φH24C4C5C12 varies at ∼180° since the H24 inverts to a left hand side benzene ring. The time constants (standard deviation) of 457.9 (225.3) fs, 572.6 (250.5) fs and 1380.4 (338.9) fs for S1/S0 hopping, S0-CC-T formation and S0-TC formation in this pathway are similar to those of the aforementioned two pathways starting from FC-C, implying that the vibration relaxation leaping out of the twin potential wells on S1 state determines the time constants for trajectories starting from FC-C.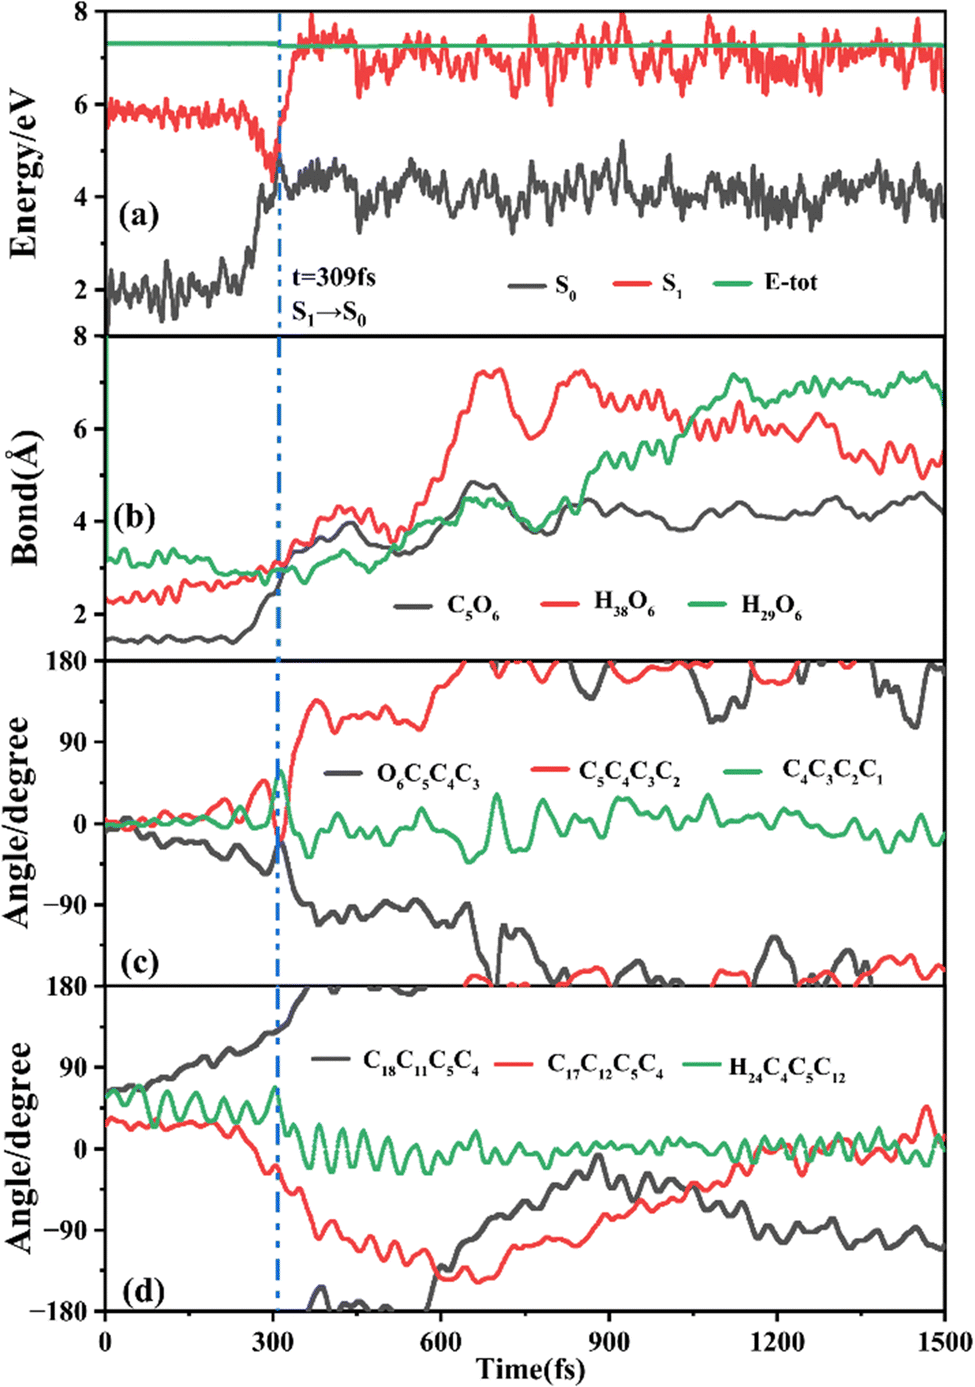 | ||
| Fig. 10 A typical ring-opening reactive trajectory starting from FC-C going via the FC-C → CI-S1/S0-C → S0-CC-C → S0-TC pathway as a function of time. (a) Potential energy profiles of the S0 and S1 states, (b) evolution of rC5O6, rH38O6 and rH29O6, (c) φO6C5C4C3, φC5C4C3C2 and φC4C3C2C1, and (d) φC18C11C5C4, φC17C12C5C4 and φH24C4C5C12. | ||
 | ||
| Fig. 11 A typical ring-opening reactive trajectory starting from FC-C going via the FC-C → CI-S1/S0-T → S0-CC-T → S0-TC pathway as a function of time. (a) Potential energy profiles of the S0 and S1 states, (b) evolution of rC5O6, rH38O6 and rH29O6, (c) φO6C5C4C3, φC5C4C3C2 and φC4C3C2C1, and (d) φC18C11C5C4, φC17C12C5C4 and φH24C4C5C12. | ||
4. Concluding remarks
On-the-fly trajectory surface hopping molecular dynamics simulations with a global switching algorithm have been carried out at the TD-CAM-B3LYP-D3/def2-SV(P) level of theory to reveal photorelaxation mechanisms for the ring-opening and isomerization reactions of DPC upon S1 excitation. Based on a total of 200 (150) sampling trajectories starting from FC-T (FC-C), we have revealed that besides the major C5–O6 dissociation pathways relaxing to the nearby conical intersections with the same conformations leading to a ring-opening reaction, another major pyran inversion motion pathway makes an efficient DPC-C ↔ DPC-T conformation isomerization reaction. The interplay between these two major pathways could be taking place in both the S1 and S0 states, and thus can give rise to various characteristic and subsequent photorelaxation pathways. Moreover, the DPC-C and DPC-T conformers show distinct differences for branching ratios among the relaxation pathways and lifetimes for the involved intermediates. The ring-opening quantum yield for trajectories starting from FC-T (FC-C) is estimated as 0.91 (0.76), in good agreement with the experimental value of 0.7–0.9.20,21 Furthermore, the DPC-T → DPC-C (DPC-C → DPC-T) conformation conversion ratios on S1 and S0 states are estimated as 3.0% (18.7%) and 6.5% (12.0%), respectively. The thermal equilibrium weight averaged lifetimes of S1/S0 hopping at the S0-CC formation and finally isomerizing to S0-TC are 182.0, 228.6, and 1262.4 fs, respectively, and these time constants could reasonably reproduce the experimentally measured τ1 (0.19–0.45 ps) and τ2 (1.0–1.8 ps) time constants for a sequential model. The present simulation is very encouraging for us to deepen our understanding of the photorelaxation mechanisms of DPC from a theoretical point of view and we hope that the present work will promote experimental design for DPC based photoresponsive materials.Conflicts of interest
The authors declare no competing financial interests.Acknowledgements
This work is supported by the National Natural Science Foundation of P. R. China under grant no. 21603174 and 22273071 and by the Fund of Education Department of Shaanxi Provincial Government (23JP172). C. Z. thanks support from the Ministry of Science and Technology, Taiwan (grant no. 110-2113-M-A49-022-).References
- R. S. Becker and G. Favaro, J. Photochem. Photobiol., C, 2011, 12, 167–176 CrossRef CAS.
- A. Mukhopadhyay and J. N. Moorthy, J. Photochem. Photobiol., C, 2016, 29, 73–106 CrossRef CAS.
- J. Volarić, W. Szymanski, N. A. Simeth and B. L. Feringa, Chem. Soc. Rev., 2021, 50, 12377–12449 RSC.
- H. Kuroiwa, Y. Inagaki, K. Mutoh and J. Abe, Adv. Mater., 2019, 31, 1805661 CrossRef PubMed.
- T. Yan, X. Tu, Z. Xi, S. Du, J. Han, B. Zhao and Z. He, J. Mater. Chem. C, 2022, 10, 5542–5549 RSC.
- J. N. Moorthy, S. Mandal, A. Mukhopadhyay and S. Samanta, J. Am. Chem. Soc., 2013, 135, 6872–6884 CrossRef CAS PubMed.
- M. Frigoli, J. Marrot, P. L. Gentili, D. Jacquemin, M. Vagnini, D. Pannacci and F. Ortica, ChemPhysChem, 2015, 16, 2447–2458 CrossRef CAS PubMed.
- Y. Inagaki, Y. Kobayashi, K. Mutoh and J. Abe, J. Am. Chem. Soc., 2017, 139, 13429–13441 CrossRef CAS PubMed.
- S. Brazevic, S. Nizinski, M. Sliwa, J. Abe, M. F. Rode and G. Burdzinski, Int. J. Mol. Sci., 2020, 21, 7825 CrossRef CAS PubMed.
- S. Brazevic, M. Baranowski, M. Sikorski, M. F. Rode and G. Burdziński, ChemPhysChem, 2020, 21, 1402–1407 CrossRef CAS PubMed.
- A. Mukhopadhyay, S. Jindal, V. K. Maka and J. N. Moorthy, ACS Omega, 2021, 6, 21113–21124 CrossRef CAS PubMed.
- S. Brazevic, M. Sikorski, M. Sliwa, J. Abe, M. F. Rode and G. Burdzinski, Dyes Pigm., 2022, 201, 110249 CrossRef CAS.
- B. Gierczyk, M. F. Rode and G. Burdzinski, Sci. Rep., 2022, 12, 10781 CrossRef CAS PubMed.
- Y. Inagaki, K. Mutoh and J. Abe, Photochem. Photobiol. Sci., 2018, 17, 946–953 CrossRef CAS PubMed.
- M. Sakuragi, Y. Kawanishi, Y. Suzuki and H. Sakuragi, Bull. Chem. Soc. Jpn., 2008, 81, 641–643 CrossRef CAS.
- M. R. di Nunzio, E. O. Danilov, M. A. Rodgers and G. Favaro, Photochem. Photobiol. Sci., 2010, 9, 1391–1399 CrossRef CAS PubMed.
- J. Harada, K. Ueki, M. Anada, Y. Kawazoe and K. Ogawa, Chem. – Eur. J., 2011, 17, 14111–14119 CrossRef CAS PubMed.
- P. Ravat, T. Šolomek and M. Juríček, ChemPhotoChem, 2019, 3, 180–186 CrossRef CAS.
- T. Yan, X. Li, Z. Xu, Z.-M. Yang, J. Han and Z. He, Dyes Pigm., 2023, 211, 111070 CrossRef CAS.
- H. Görner and A. K. Chibisov, J. Photochem. Photobiol., A, 2002, 149, 83–89 CrossRef.
- S. Brazevic, M. Sliwa, Y. Kobayashi, J. Abe and G. Burdzinski, J. Phys. Chem. Lett., 2017, 8, 909–914 CrossRef CAS PubMed.
- Y. Kodama, T. Nakabayashi, K. Segawa, E. Hattori, M. Sakuragi, N. Nishi and H. Sakuragi, J. Phys. Chem. A, 2000, 104, 11478–11485 CrossRef CAS.
- P. L. Gentili, E. Danilov, F. Ortica, M. A. J. Rodgers and G. Favaro, Photochem. Photobiol. Sci., 2004, 3, 886–891 CrossRef CAS PubMed.
- B. Moine, J. Réhault, S. Aloïse, J.-C. Micheau, C. Moustrou, A. Samat, O. Poizat and G. Buntinx, J. Phys. Chem. A, 2008, 112, 4719–4726 CrossRef CAS PubMed.
- T. T. Herzog, G. Ryseck, E. Ploetz and T. Cordes, Photochem. Photobiol. Sci., 2013, 12, 1202–1209 CrossRef CAS PubMed.
- S. Brazevic, S. Nizinski, R. Szabla, M. F. Rode and G. Burdzinski, Phys. Chem. Chem. Phys., 2019, 21, 11861–11870 RSC.
- B. H. Strudwick, C. O'Bryen, H. J. Sanders, S. Woutersen and W. J. Buma, Phys. Chem. Chem. Phys., 2019, 21, 11689–11696 RSC.
- E. Y. Chernikova, P. S. Perevozchikova, N. E. Shepel, O. A. Fedorova and Y. V. Fedorov, ChemPhotoChem, 2023, 7, e202200268 CrossRef CAS.
- P. Celani, F. Bernardi, M. Olivucci and M. A. Robb, J. Am. Chem. Soc., 1997, 119, 10815–10820 CrossRef CAS.
- A. Migani, P. L. Gentili, F. Negri, M. Olivucci, A. Romani, G. Favaro and R. S. Becker, J. Phys. Chem. A, 2005, 109, 8684–8692 CrossRef CAS PubMed.
- J. W. Hewage, Eur. Phys. J. D, 2013, 67, 181 CrossRef.
- A. M. Galvão, J. Photochem. Photobiol., A, 2014, 289, 66–72 CrossRef.
- R. S. Becker, A. P. Pelliccioli, A. Romani and G. Favaro, J. Am. Chem. Soc., 1999, 121, 2104–2109 CrossRef CAS.
- P. L. Gentili, A. Romani, R. S. Becker and G. Favaro, Chem. Phys., 2005, 309, 167–175 CrossRef CAS.
- I. I. Chuev, S. M. Aldoshin, A. Samat, F. Maurel and J. Aubard, THEOCHEM, 2001, 548, 123–132 CrossRef CAS.
- L. Yu, C. Xu, Y. Lei, C. Zhu and Z. Wen, Phys. Chem. Chem. Phys., 2014, 16, 25883–25895 RSC.
- L. Yue, Y. Liu and C. Zhu, Phys. Chem. Chem. Phys., 2018, 20, 24123–24139 RSC.
- Y. Hu, C. Xu, L. Ye, F. L. Gu and C. Zhu, Phys. Chem. Chem. Phys., 2021, 23, 5236–5243 RSC.
- Y. Liu and C. Zhu, Phys. Chem. Chem. Phys., 2021, 23, 23861–23874 RSC.
- F. Liu and K. Morokuma, J. Am. Chem. Soc., 2013, 135, 10693–10702 CrossRef CAS PubMed.
- Y.-H. Zhang, X.-W. Sun, T.-S. Zhang, X.-Y. Liu and G. Cui, J. Phys. Chem. A, 2020, 124, 2547–2559 CrossRef CAS PubMed.
- T. Yanai, D. P. Tew and N. C. Handy, Chem. Phys. Lett., 2004, 393, 51–57 CrossRef CAS.
- I. N. Dobrovolskiy and V. V. Kostjukov, J. Comput. Chem., 2023, 44, 1928–1940 CrossRef CAS PubMed.
- W. Liu and M. R. Hoffmann, Theor. Chem. Acc., 2014, 133, 1481 Search PubMed.
- Y. Lei, W. Liu and M. R. Hoffmann, Mol. Phys., 2017, 115, 2696–2707 CrossRef CAS.
- Y. Lei, B. Suo and W. Liu, J. Chem. Theory Comput., 2021, 17, 4846–4859 CrossRef CAS PubMed.
- S. Grimme, J. Antony, S. Ehrlich and H. Krieg, J. Chem. Phys., 2010, 132, 154104 CrossRef PubMed.
- F. Weigend and R. Ahlrichs, Phys. Chem. Chem. Phys., 2005, 7, 3297–3305 RSC.
- F. Neese, Wiley Interdiscip. Rev.: Comput. Mol. Sci., 2018, 8, e1327 Search PubMed.
- Y. Zhang, B. Suo, Z. Wang, N. Zhang, Z. Li, Y. Lei, W. Zou, J. Gao, D. Peng, Z. Pu, Y. Xiao, Q. Sun, F. Wang, Y. Ma, X. Wang, Y. Guo and W. Liu, J. Chem. Phys., 2020, 152, 064113 CrossRef PubMed.
- B. Suo, Y. Lei, H. Han and Y. Wang, Mol. Phys., 2018, 116, 1051–1064 CrossRef CAS.
- L. Verlet, Phys. Rev., 1967, 159, 98–103 CrossRef CAS.
- F. Neese, J. Comput. Chem., 2003, 24, 1740–1747 CrossRef CAS PubMed.
Footnotes |
| † Electronic supplementary information (ESI) available. See DOI: https://doi.org/10.1039/d3cp04132h |
| ‡ These authors contribute equally to this article. |
| This journal is © the Owner Societies 2023 |