
 Open Access Article
 This Open Access Article is licensed under a
 Creative Commons Attribution 3.0 Unported Licence
Lifting the discrepancy between experimental results and the theoretical predictions for the catalytic activity of RuO2(110) towards oxygen evolution reaction
Spyridon
Divanis
 ,
Adrian Malthe
Frandsen
*,
Tugce
Kutlusoy
and
Jan
Rossmeisl
,
Adrian Malthe
Frandsen
*,
Tugce
Kutlusoy
and
Jan
Rossmeisl
Center for High Entropy Alloy Catalysis, Department of Chemistry, University of Copenhagen, Denmark. E-mail: amf@chem.ku.dk
First published on 23rd August 2021
Abstract
Developing new efficient catalyst materials for the oxygen evolution reaction (OER) is essential for widespread proton exchange membrane water electrolyzer use. Both RuO2(110) and IrO2(110) have been shown to be highly active OER catalysts, however DFT predictions have been unable to explain the high activity of RuO2. We propose that this discrepancy is due to RuO2 utilizing a different reaction pathway, as compared to the conventional IrO2 pathway. This hypothesis is supported by comparisons between experimental data, DFT data and the proposed reaction model.
Introduction
As part of a transition to a future sustainable economy, there is a need for sustainable fuel and energy storage. Hydrogen gas is an ideal candidate for such a fuel and storage compound, as it can be readily produced by the electrolysis of water.1 Furthermore, the hydrogen is completely sustainable if the source of electricity is renewable.2 Currently, the major challenge facing widespread electrolyzer use is the sluggish kinetics of the Oxygen Evolution Reaction (OER) at the anode,3 fundamentally limited by the universal scaling relations.4,5 Further development of the water electrolyzer thus requires finding efficient and practical catalysts to facilitate the OER. There are three types of water electrolyzers: alkaline water electrolyzers, proton exchange membrane (PEM) water electrolyzers and solid oxide water electrolyzers.6 Of these three the alkaline water electrolyzer is the most mature and commercialized. Yet PEM technology has many advantages compared to the alkaline electrolyzer. Some examples include a much higher current density, purer gas, a smaller size for the same power and even the ability to operate at high pressure.6,7 Currently the best candidates for PEM electrolyzer anode material are IrO2 and RuO2, as these are both stable and active.8–13 Both iridium and ruthenium are however scarce materials and thus expensive.14 It is therefore unrealistic to expect that these catalysts can be used on an industrial scale that would have an impact on society.1,15 Due to the high catalytic performance of IrO2 and RuO2,9 a deeper understanding of how these catalysts interact with water could greatly improve the search for and development of new efficient OER catalysts.16 Current theory and computational DFT models form a relatively accurate description of the experimental behaviour of IrO2.9,17,18 However, for the case of RuO2 there is a glaring discrepancy between theoretical predictions and experimental results.18–20 This suggests that either the current reaction model is wrong in the case of RuO2 or the under-evaluation is due to a computational artefact. In this work we propose that the discrepancy is due to RuO2 utilizing an alternate reaction pathway for oxygen evolution as compared to IrO2. We therefore argue that it is not due to a computational artefact.Results-discussion
The conventional pathway describing the interaction between water molecules and the surface of an electrocatalyst was suggested in 2004.21 During this reaction pathway three intermediates are produced via four electron–proton pair exchanges between the anode and the electrolyte, presented in the following reactions:| H2O + * → HO* + H+ + e− | (1) |
| HO* → O* + H+ + e− | (2) |
| H2O + O* → HOO* + H+ + e− | (3) |
| HOO* → * + O2 + H+ + e− | (4) |
A schematic representation of the conventional OER reaction path is depicted in Fig. 1a, while the RuO2 surface sites are illustrated in Fig. 1c. First, water approaches the surface and the first intermediate HO* is created. Second, the oxygen forms another bond to the surface losing the remaining proton as shown in eqn (2). Third, a water molecule binds to the surface-bound oxygen, dropping a proton in the process. Simultaneously the double bond of O* breaks, creating the third intermediate HOO*. The fourth and last step, happens while the oxygen atoms bond with each other, breaking their bonds with the surface and the hydrogen respectively. This reaction mechanism succeeds to accurately describe the trends of catalytic activity for the majority of the metal oxides. For example the per site DFT activity of IrO2 places IrO2 among the best catalysts, in agreement with the experimental observations concerning the performance of the material either in the nanoparticle or the single crystal form.4,9,17,23
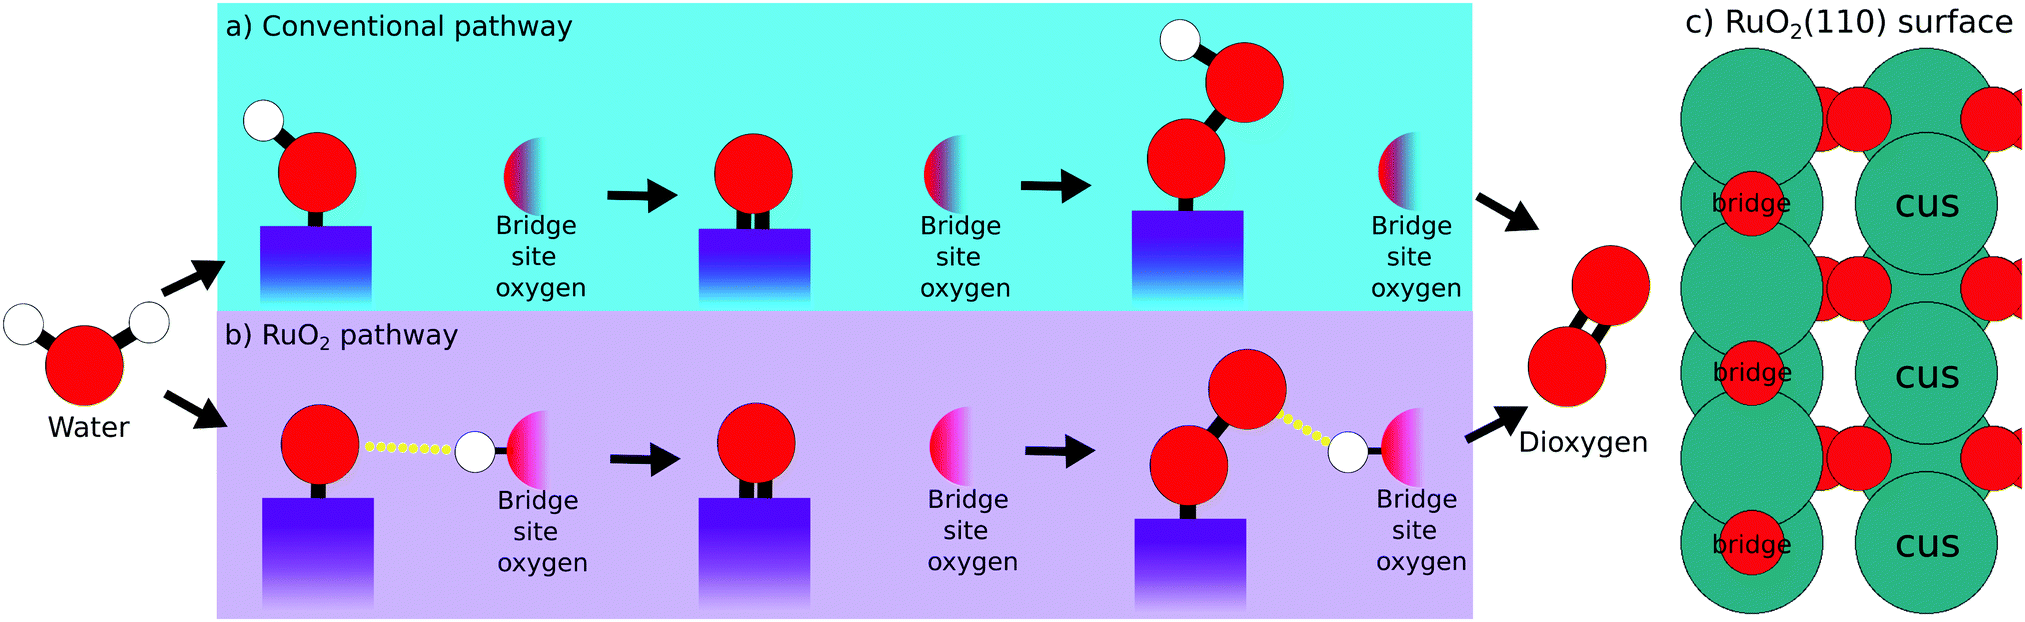 | ||
| Fig. 1 Illustration of two oxygen evolution reaction pathways. Each step is accompanied with the exchange of a proton–electron pair between the electrolyte and the catalyst surface. (a) The conventional OER path. (b) The proposed reaction mechanism for OER on RuO2 surfaces. (c) Illustration of the relevant RuO2(110) surface sites. | ||
DFT calculations following this model have however been unable to explain the high experimental activity of RuO2.18–20 Previous studies have shown that the usage of a dopant at the bridge site of RuO2 makes the bridge oxygen more eager to interact with the proton of the intermediates.24,25 We propose that RuO2 follows such a mechanism without the usage of a dopant, as illustrated in the schematic representation Fig. 1b. This RuO2 pathway is very reminiscent of the conventional pathway, differing only in steps one and three. Here, instead of the proton being directly bound to the adsorbed intermediate, the proton has migrated to the bridge site oxygen. This complex is stabilized by a weak interaction between this bridge-bound proton and the intermediate (indicated by a yellow dotted line). This hypothesis is supported by the experimental works of Rao et al., who identified a –OO species at high potentials.17,26 This –OO species is the experimental equivalent of the third intermediate of the RuO2 pathway depicted in Fig. 1b.
The different way that the first and third intermediates are adsorbed on the surface, has an effect on their binding energy and thereby on the overall activity. The energy inter-dependency of the HO* and HOO* intermediates thus changes from ≈3.2 eV, as dictated by the universal scaling relations,4,5 to ≈2.7 eV, a value that is closer to the ideal value of 2.46 eV. This relation is depicted in the activity volcano of Fig. 2 by the blue trend line. The activity volcano supports our hypothesis, as the DFT data point corresponding to RuO2 following pathway Fig. 1b (blue pentagon), holds a lower overpotential compared to the data point corresponding to the conventional pathway (blue circle). This places it right on top of the blue trend line. An observation that is strengthening our analysis, is that the blue trend line is followed by experimental data produced in the work of Suntivich et al.27 In their experiments, RuO2(110) surfaces were synthesized and their electrochemical response in different pH is recorded. Furthermore, they assign the first and second pre-oxidation peaks observed at the cyclic voltammetries, as the HO* and O* intermediates respectively. The experimental HO* energies serve the role of the descriptor for the experimental data at the activity volcano in the diagram (Fig. 2). The red triangles corresponding to IrO2, reproduced from another work of Suntivich et al.,28 tend as an ensemble to be placed closer towards the strong binding side of the conventional activity volcano. This is an indication that IrO2 follows the conventional reaction pathway. The RuO2 experimental data points are however spread. The two most active data points, corresponding to pH 13 (the left-most point) and pH 1 (the right-most point), are placed right on top of the blue trend-line together with the theoretical prediction for pathway Fig. 1b. In contrast, those corresponding to neutral, weakly acidic and weakly alkaline electrolytes are placed closer to the conventional activity volcano. This V-shaped activity trend has been attributed to a dependence of the HOO* formation energy on pH in tandem with the fact that there is a clear pathway to HOO* formation (from O*) in both high and low pH.27 Furthermore, recent studies have suggested that the activity at high pH is mediated by cations.29
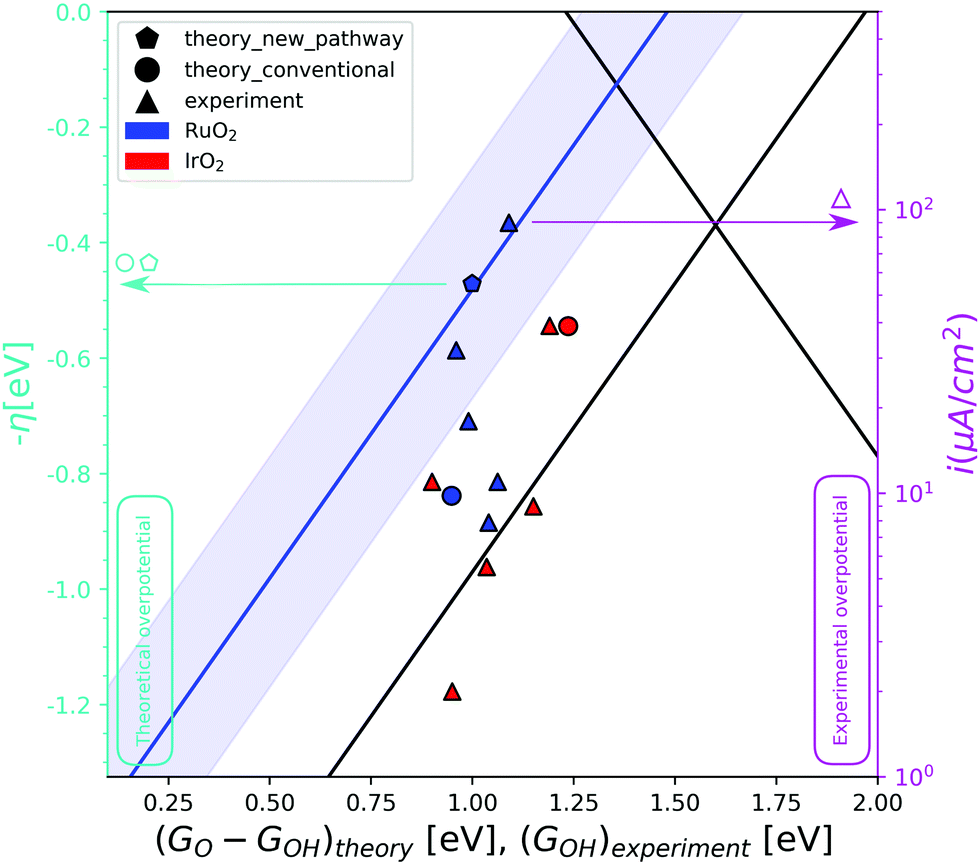 | ||
| Fig. 2 The OER activity volcano. The red data points correspond to IrO2 and the blue ones to RuO2. The triangles represent the experimental data in varying pH conditions,27,28 while the circle and the pentagon are theoretical data for the conventional and the RuO2 pathway respectively. The blue trend line corresponds to the strong binding side of the volcano if the RuO2 pathway is followed. The blue shaded area around the blue trend line, is the DFT error of ±0.2 eV. The left y-axis (cyan) presents the theoretical overpotential and the right y-axis (magenta) presents the experimental overpotential, as the logarithm on the current is what you would expect from the Butler–Volmer equation to compare with potential. As we can only hope to compare trends, and not absolute numbers, the theoretical and experimental overpotentials are calibrated by overlapping the theoretical and experimental overpotential for IrO2(110). We cannot expect the scale of changes to be the same for calculations and experiments as the predicted differences are often larger than the measured. This figure is therefore two different figures overlapped for the comparison of trends. This also means that the two y-axes can be scaled and translated relative to each other. Two different descriptors with the same scale are used on the x-axis. GO–GHO and GHO for the theoretical and the experimental data respectively. | ||
In Fig. 3 the scaling relations between HO* and O* intermediates on the cus site are depicted for both experimental and theoretical results. The calculated data subtracted from the work of Federico Calle-Vallejo et al.,19 were produced by DFT calculations on (110) surfaces of IrO2 and RuO2, using different implementations of DFT. In this figure, the experimental points relating to the aforementioned V-shaped activity pattern constitute a clear trend-line. This hints at them following the same pathway, even though their activity dips at neutral pH, and suggests that the activity dip might be mechanistic in nature.
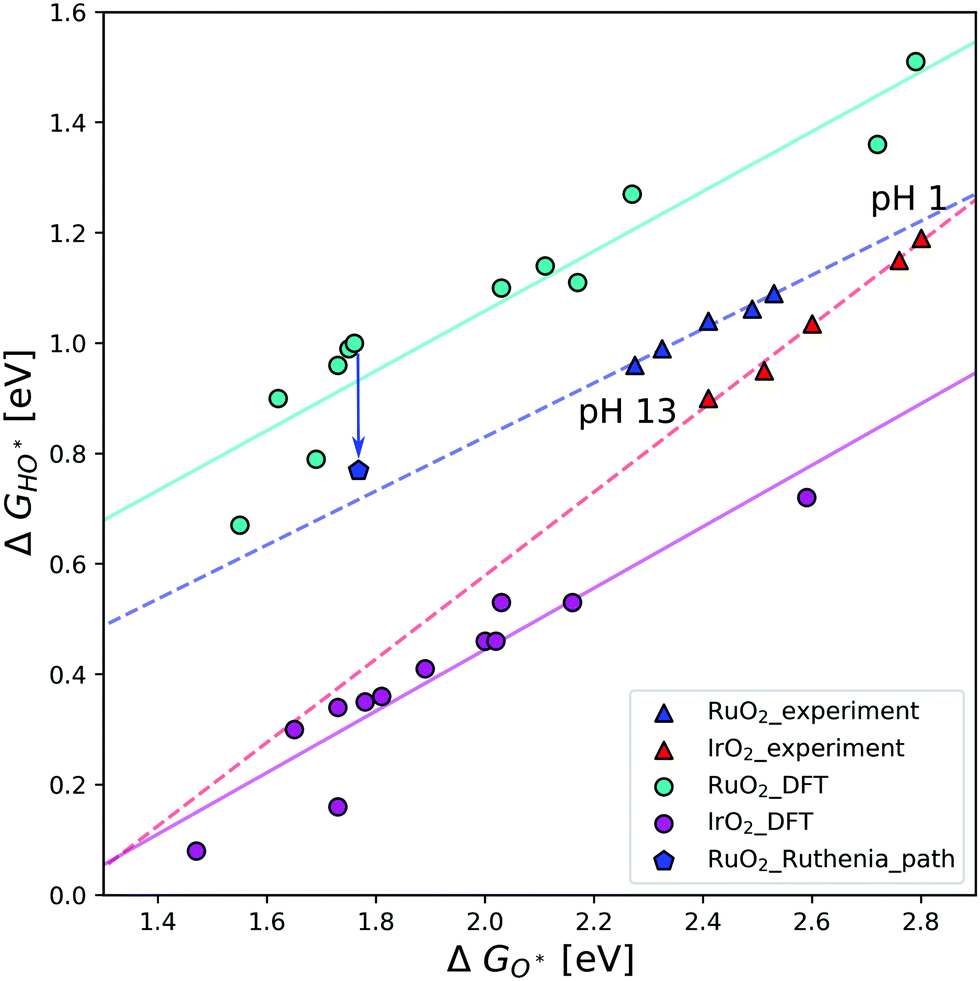 | ||
| Fig. 3 Scaling relation of HO* binding energies against O* on the cus site for IrO2 and RuO2(110) surfaces. The circles correspond to DFT data following different DFT implementations as reproduced from Federico Calle-Vallejo et al.19 In contrast, the triangles correspond to experimental data in varying electrolyte conditions.27,28 Each of these data sets have their own corresponding trend-line. The blue pentagon represents RuO2 DFT data following pathway Fig. 1b, and the blue arrow represents the difference in ΔGHO* as a result of following this pathway. This indicated difference is the same size as the difference between the experimental and DFT trend-lines for RuO2. | ||
It is the relative strong binding of the oxygen intermediate, which makes the calculated activity of RuO2 smaller than IrO2. Whereas the binding of HO* and HOO* on the RuO2 cus site is similar, the O* binding is much stronger than that on IrO2. This could be an artefact of the DFT calculations, however, it is seen to hold across DFT implementations. The binding energies vary between the different methods, but the difference between HO* and O* binding is close to constant. Previous experimental studies also show that RuO2 binds oxygen stronger than IrO2 for the same HO* binding,27 even if the difference is smaller than that found in the DFT data. In contrast to the DFT data, differences in experimental data is due to varying electrolyte pH. As previously mentioned, the experiments measure the potentials for the first and second oxidation peaks, those are normally assumed to be related to the HO* and O* intermediates on the cus site. However, it could just as well be related to the reaction path Fig. 1b. The stronger the relative O* binding on the cus site, the more likely reaction (1) becomes, as the then relatively unstable HO* intermediate is avoided. Doing a DFT calculation following the RuO2 pathway creates the point represented by a blue pentagon. This point is placed towards a stronger binding of HO*, and thus comes very close to the experimental trend-line. As points corresponding to different DFT implementations could lie anywhere on the teal trend-line, it is fair to assume that the calculated pentagon could lie anywhere on the experimental trend-line, as dependent on the specific DFT implementation. It therefore seems that pathway Fig. 1b accurately describes the experimental trend.
Computational methods
Density functional theory calculations were done using Grid-based Projector Augment Wave (GPAW),30,31 assisted by the Atomic Simulation Environment (ASE)32 interface. Using the generalized gradient approximation (GGA), the BEEF-vdW functional33 expressed exchange and correlation. This functional was chosen specifically, as it gives a better description of the long range interactions, compared to the initially chosen RPBE.34 RPBE provides trustworthy results for strong interacting chemical complexes (chemi-adsorption of a molecule on a surface), but it is not as efficient as BEEF-vdW in describing long range interactions. In this particular case the usage of RPBE, placed the blue trend-line of Fig. 2 much closer to the strong side of the conventional volcano. This result differentiates the interpretation of the phenomena and thus the conclusions of the study. The IrO2 and RuO2(110) surfaces consist of four atomic layers where the two bottom layers were fixed in their initial position, as to mimic the bulk of the corresponding material. The top layers were free to converge to their minimum electronic energy positions. In the x and y directions the structures were replicated by 1 and 3 times respectively. The sampling of the Brillouin zone was done with a k-point mesh of (3, 2, 1) and the calculations were conducted with a grid spacing of 0.18 Å. Above and below the structures a vacuum of 15 Å was introduced to avoid unintended interactions between the slab and itself. The structures were relaxed until the total forces in the system were below 0.05 eV Å−1.Conclusion
In this work we are studying the discrepancy between DFT and experimental results, regarding the oxygen evolving reactivity of RuO2. We propose that the reaction pathway for electrochemical water oxidation on RuO2(110) surfaces, at least in acidic conditions, is slightly different from the reaction path on IrO2. In particular, the differences are located at the first and third intermediates, where the protons of HO* and HOO* are migrating towards the bridge oxygen surface. The energy inter-dependency of HO* and HOO* is 2.7 eV for the RuO2 pathway, and is much closer to the ideal difference of 2.46 eV. As a consequence the DFT activity is much higher than the one produced by the conventional mechanism and thus the structure is placed closer to the apex of the activity volcano. Furthermore the new placement of RuO2(110) on the activity volcano, is at the same region of the RuO2 experimental results for highly acidic and highly alkaline electrolytes. By using the conventional pathway we have a very weak interaction of HO* with the surface's cus site. On the other hand, using the RuO2 pathway widens the energy difference between HO* and O*, placing this DFT calculation closer to experimental trend-lines. This theoretical–experimental agreement, indicates that the RuO2 mechanism is generally followed. It is to be expected that this trend extends to other active RuO2 facets, as it is the strong binding of the O* intermediate that makes the conventional path too difficult. Given that other facets share this strong oxygen binding, the alternate mechanism would likely apply.Conflicts of interest
There are no conflicts to declare.Acknowledgements
This project was supported by European Union's Horizon 2020 research and innovation programme under the Marie Skłodowska–Curie Innovative Training Network (ITN-ELCOREL-722614), the Villum Foundation to the Villum Center for the Science of Sustainable Fuels and Chemicals (#9455) and The Center of Excellence program. The Center of Excellence is funded by the Danish National Research Foundation DNRF 149.References
- H. B. Gray, Nat. Chem., 2009, 1, 7 CrossRef CAS PubMed
.
- Z. Yan, J. L. Hitt, J. A. Turner and T. E. Mallouk, Proc. Natl. Acad. Sci. U. S. A., 2020, 117, 12558–12563 CrossRef CAS PubMed
- J. Durst, C. Simon, F. Hasché and H. A. Gasteiger, J. Electrochem. Soc., 2014, 162, F190–F203 CrossRef
- I. C. Man, H.-Y. Su, F. Calle-Vallejo, H. A. Hansen, J. I. Martínez, N. G. Inoglu, J. Kitchin, T. F. Jaramillo, J. K. Nørskov and J. Rossmeisl, ChemCatChem, 2011, 3, 1159–1165 CrossRef CAS
- S. Divanis, T. Kutlusoy, I. M. Ingmer Boye, I. C. Man and J. Rossmeisl, Chem. Sci., 2020, 11, 2943–2950 RSC
- Q. Feng, X. Yuan, G. Liu, B. Wei, Z. Zhang, H. Li and H. Wang, J. Power Sources, 2017, 366, 33–55 CrossRef CAS
- G. Matute, J. Yusta and L. Correas, Int. J. Hydrogen Energy, 2019, 44, 17431–17442 CrossRef CAS
- S. Trasatti, J. Electroanal. Chem. Interfacial Electrochem., 1980, 111, 125–131 CrossRef CAS
- Y. Lee, J. Suntivich, K. J. May, E. E. Perry and Y. Shao-Horn, J. Phys. Chem. Lett., 2012, 3, 399–404 CrossRef CAS PubMed
- R. Frydendal, E. A. Paoli, B. P. Knudsen, B. Wickman, P. Malacrida, I. E. L. Stephens and I. Chorkendorff, ChemElectroChem, 2014, 1, 2075–2081 CrossRef CAS
- O. Kasian, S. Geiger, T. Li, J.-P. Grote, K. Schweinar, S. Zhang, C. Scheu, D. Raabe, S. Cherevko, B. Gault and K. J. J. Mayrhofer, Energy Environ. Sci., 2019, 12, 3548–3555 RSC
- M. Escudero-Escribano, A. F. Pedersen, E. A. Paoli, R. Frydendal, D. Friebel, P. Malacrida, J. Rossmeisl, I. E. L. Stephens and I. Chorkendorff, J. Phys. Chem. B, 2018, 122, 947–955 CrossRef PubMed
- M. Bernt, A. Siebel and H. A. Gasteiger, J. Electrochem. Soc., 2018, 165, F305–F314 CrossRef CAS
-
D. Hageluken and V. den Broeck, Precious Materials Handbook, 2012, pp. 10–35 Search PubMed
- P. C. K. Vesborg and T. F. Jaramillo, RSC Adv., 2012, 2, 7933–7947 RSC
- A. Grimaud, A. Demortière, M. Saubanère, W. Dachraoui, M. Duchamp, M.-L. Doublet and J.-M. Tarascon, Nat. Energy, 2016, 2, 16189 CrossRef
- R. Rao, M. Kolb and L. E. A. Giordano, Nat Catal., 2020, 3, 516–525 CrossRef CAS
- J. Rossmeisl, Z.-W. Qu, H. Zhu, G.-J. Kroes and J. Nørskov, J. Electroanal. Chem., 2007, 607, 83–89 CrossRef CAS
- L. G. V. Briquet, M. Sarwar, J. Mugo, G. Jones and F. Calle-Vallejo, ChemCatChem, 2017, 9, 1261–1268 CrossRef CAS
- Y. Lee, J. Suntivich, K. J. May, E. E. Perry and Y. Shao-Horn, J. Phys. Chem. Lett., 2012, 3, 399–404 CrossRef CAS PubMed
- J. K. Nørskov, J. Rossmeisl, A. Logadottir, L. Lindqvist, J. R. Kitchin, T. Bligaard and H. Jónsson, J. Phys. Chem. B, 2004, 108, 17886–17892 CrossRef
- J. Rossmeisl, A. Logadottir and J. Nørskov, Chem. Phys., 2005, 319, 178–184 CrossRef CAS
- K. A. Stoerzinger, O. Diaz-Morales, M. Kolb, R. R. Rao, R. Frydendal, L. Qiao, X. R. Wang, N. B. Halck, J. Rossmeisl, H. A. Hansen, T. Vegge, I. E. L. Stephens, M. T. M. Koper and Y. Shao-Horn, ACS Energy Lett., 2017, 2, 876–881 CrossRef CAS
- N. B. Halck, V. Petrykin, P. Krtil and J. Rossmeisl, Phys. Chem. Chem. Phys., 2014, 16, 13682–13688 RSC
- M. Busch, N. Halck, U. Kramm, S. Siahrostami, P. Krtil and J. Rossmeisl, Nano Energy, 2016, 29, 126–135 CrossRef CAS
- R. R. Rao, M. J. Kolb, N. B. Halck, A. F. Pedersen, A. Mehta, H. You, K. A. Stoerzinger, Z. Feng, H. A. Hansen, H. Zhou, L. Giordano, J. Rossmeisl, T. Vegge, I. Chorkendorff, I. E. L. Stephens and Y. Shao-Horn, Energy Environ. Sci., 2017, 10, 2626–2637 RSC
- D.-Y. Kuo, H. Paik, J. Kloppenburg, B. Faeth, K. M. Shen, D. G. Schlom, G. Hautier and J. Suntivich, J. Am. Chem. Soc., 2018, 140, 17597–17605 CrossRef CAS PubMed
- D.-Y. Kuo, J. K. Kawasaki, J. N. Nelson, J. Kloppenburg, G. Hautier, K. M. Shen, D. G. Schlom and J. Suntivich, J. Am. Chem. Soc., 2017, 139, 3473–3479 CrossRef CAS PubMed
- R. R. Rao, B. Huang, Y. Katayama, J. Hwang, T. Kawaguchi, J. R. Lunger, J. Peng, Y. Zhang, A. Morinaga, H. Zhou, H. You and Y. Shao-Horn, J. Phys. Chem. C, 2021, 125, 8195–8207 CrossRef CAS
- J. Enkovaara, C. Rostgaard, J. J. Mortensen, J. Chen, M. Dułak, L. Ferrighi, J. Gavnholt, C. Glinsvad, V. Haikola and H. A. Hansen, J. Phys.: Condens. Matter, 2010, 22, 253202 CrossRef CAS PubMed
- J. J. Mortensen, L. B. Hansen and K. W. Jacobsen, Phys. Rev. B: Condens. Matter Mater. Phys., 2005, 71, 035109 CrossRef
- A. H. Larsen, J. J. Mortensen, J. Blomqvist, I. E. Castelli, R. Christensen, M. Dułak, J. Friis, M. N. Groves, B. Hammer and C. Hargus, J. Phys.: Condens. Matter, 2017, 29, 273002 CrossRef PubMed
- J. Wellendorff, K. T. Lundgaard, A. Møgelhøj, V. Petzold, D. D. Landis, J. K. Nørskov, T. Bligaard and K. W. Jacobsen, Phys. Rev. B: Condens. Matter Mater. Phys., 2012, 85, 235149 CrossRef
- B. Hammer, L. B. Hansen and J. K. Nørskov, Phys. Rev. B: Condens. Matter Mater. Phys., 1999, 59, 7413–7421 CrossRef
| This journal is © the Owner Societies 2021 |