Relationship between structural and dielectric properties of Zn-substituted Ba5CaTi2−xZnxNb8O30 tetragonal tungsten bronze
Amine
Bendahhou
 *a,
Pascal
Marchet
b,
Ablouh
El-Houssaine
 c,
Soufian
El Barkany
a and
Mohamed
Abou-Salama
 a
a
aLaboratory of Molecular Chemistry, Materials and Environment, Department of Chemistry, Faculty Multidisciplinary Nador, University Mohamed Premier, B.P. 300, Selouane, Nador 62700, Morocco. E-mail: bendahhou_amine1718@ump.ac.ma; Tel: +212606849738
bIRCER – UMR CNRS 7315, Centre Européen de la Céramique, Université de Limoges, 12 Rue Atlantis, F-87068 Limoges Cedex, France
cLaboratory of Bioorganic and Macromolecular Chemistry, Department of Chemistry, Faculty of Sciences and Technologies, Cadi Ayyad University, 40000 Marrakesh, Morocco
First published on 9th November 2020
Abstract
Ba5CaTi2−xZnxNb8O30 ceramics (x = 0, 0.04, and 0.08) were synthesized by a conventional solid-state reaction method at 1300 °C for 6 hours. The effects of the Ti/Zn ratio on structural and dielectric properties were studied by changing the value of x. The pure phase formation of all prepared Ba5CaTi2−xZnxNb8O30 compositions was confirmed by X-ray diffraction. The refinement of the (XRD) data by the Rietveld method confirmed the tetragonal crystal structure with the space group P4bm at room temperature. Scanning electron microscopy (SEM) showed that the Ba5CaTi2−xZnxNb8O30 ceramics have good sinterability, low porosity and uniform distribution of grains of unequal size over the entire surface in all the samples. The average grain size is in the range of 1.3 to 1.6 μm. The frequency-dependent dielectric properties were examined by complex impedance spectroscopy in the temperature range of 50 °C to 420 °C where a structural phase transition was observed for all the samples.
1. Introduction
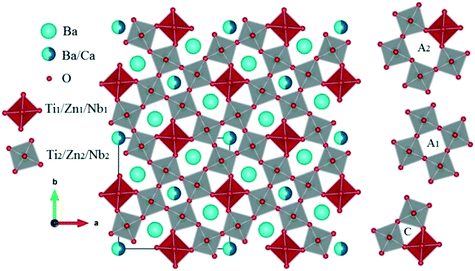
Lead-free materials have an important place in electronics due to technological progress, the toxicity of lead and the desire to protect the environment.1–3 Tetragonal tungsten bronzes (TTBs) are materials derived from perovskite structures which, due to their polyvalent structure, can have very important and advantageous electrical, magnetic, catalytic, optical or photocatalytic properties, with diverse applications in the electronics, chemical and energy conversion sectors.4–8 Recently, tungsten bronze compounds had been considered as one of the candidates for replacing lead compounds.9,10 The TTB structure can be described as a complex chain of distorted BO6 octahedra linked by their corners, and forms three types of sites, which are square A1, pentagonal A2 and triangular C. This structure can therefore be represented by the formula [(A1)2(A2)4(C)4][(B1)2(B2)8]O30.11,12 The sites A1, A2 and C or the center of the oxygen octahedron can be occupied by different cations.13–17 In our study, the smallest site C is vacant and its general formula thus becomes [(A1)2(A2)4][(B1)2(B2)8]O30. The variety of cationic sites (A1, A2, C, B1, and B2) gives rise to a great variety of structures, allowing the improvement of the characteristics of TTBs, by substitutions in A1 and A2 sites or in B1 and B2 octahedra.From the dielectric point of view, ferroelectric compounds are divided into two groups: conventional ferroelectrics and relaxors.18 In recent years, research on TTB ceramics has concentrated on the influence of A-site substitution on their phase structure and dielectric properties. Concerning the effects of doping ions, most papers focused on the effect of substitution of A sites by rare earth, alkali and alkaline earth metals. Yang et al. have suggested that alkali metal ions can increase the Curie temperature.19 Ba4−xSrxSmFe0.5Nb9.5O30 compounds have been considered as relaxors, and it is the disorder of the Ba/Sr cations in the A sites that results in the creation of strong dielectric relaxation.20 Zhu et al.21–23 reported that for ferroelectric M4R2Ti3Nb7O30 (M = Ba, Sr; R = rare earth) of tungsten bronze, the difference in the radius between the cations at the A1 and A2 sites could significantly affect the dielectric properties. Research on Ba4−xSrxDy0.67Nb10O30 (x = 0, 0.25, 0.5, 1, 2, 3) ceramics found that the compounds are normal ferroelectric for x = 1, while they are relaxor ferroelectrics when x = 2, and TC decreases with the increase in the amount of Sr.24 Stennett et al. reported an increase in the Curie temperature with the decrease in ion radius M at site A1 in the filled TTB, Ba2MTi2Nb3O15 (M = Bi, La, Pr, Nd, Sm, Eu, Gd and Dy), with a transition from normal ferroelectric behaviors (M = Pr, Nd, Sm, Eu, Gd and Dy) to relaxor ferroelectric (M = Bi and La) behaviors.25,26 Meanwhile, in most perovskite structures, B-site substitution can lead to a relaxor transition27 and improve dielectric permittivity,28 suggesting that B-site substitution is an excellent method for enhancing dielectric properties of tetragonal tungsten bronze.
The present work is focused on titanium–zinc substitution for compounds with general composition Ba5CaTi2−xZnxNb8O30 (x = 0, 0.04, and 0.08) synthesized by a standard solid-state reaction. The aims of the present work are: (i) to study the structural modifications resulting from Zn substitution and (ii) to investigate the dielectric properties of the ceramic samples (relative permittivity and dielectric losses) as a function of Zn content in order to understand the relationships between the structure and dielectric properties of the Ba5CaTi2−xZnxNb8O30 ceramics.
2. Materials and methods
The Ba5CaTi2−xZnxNb8O30 ceramics (x = 0, 0.04, and 0.08) were prepared by the conventional solid-state reaction method. The raw materials used were BaCO3 (Sigma-Aldrich, 99%), CaCO3 (Aldrich, 99.9%), Nb2O5 (Aldrich, 99.9%), ZnO (HiMedia, 99.9%) and TiO2 (Sigma-Aldrich, 99%). The raw materials were weighed in stoichiometric quantities according to the reaction below and mixed by ball-milling in ethanol for 4 hours using zirconia balls. The mixed powders were dried at 80 °C, homogenized in an agate mortar for 30 minutes and calcined at 1300 °C for 6 hours.| 5BaCO3 + CaCO3 + (2 − x)TiO2 + xZnO + 4Nb2O5 → Ba5CaTi2−xZnxNb8O30 + 6CO2 |
The identification of the crystalline structure of the powders was performed by X-ray diffraction (XRD) using CuKα radiation (λ = 1.5406 Å) at room temperature (293 K, 0.015° per step, 10–120° 2θ range, scanning speed of 1° min−1). The lattice parameters, atomic positions, occupation rates, and thermal agitation factors were refined by the Rietveld method using the Jana 2006 software.29 The average crystallite size “D” was estimated for the strongest diffraction peak using the Scherrer equation.30 The sintered pellet was polished with a fine emery paper to make both surfaces flat and parallel and then annealed at 1300 °C for 30 min. The microstructure of the Ba5CaTi2−xZnxNb8O30 ceramics was checked by scanning electron microscopy (SEM) (TESCAN VEGA III LM), with an accelerating voltage of 10 kV. The average grain size of the ceramic samples was estimated using ImageJ software. Before electrical measurements, the sintered ceramic was painted with a silver paste and annealed for 30 minutes at 300 °C to adhere the silver paste on the sample and then cooled to room temperature before taking any measurement. The disc shaped silver coated pellet behaves like a parallel plate capacitor which is used for dielectric measurements. The relative permittivity and dielectric losses (tan![[thin space (1/6-em)]](https://www.rsc.org/images/entities/char_2009.gif) δ) were determined using a BioLogic impedance analyzer (MTZ-35) over the frequency range of 1 kHz to 1 M Hz, and the furnace and the sample temperatures were controlled using MT-lab software with a heating rate of 5 °C min−1.
δ) were determined using a BioLogic impedance analyzer (MTZ-35) over the frequency range of 1 kHz to 1 M Hz, and the furnace and the sample temperatures were controlled using MT-lab software with a heating rate of 5 °C min−1.
3. Results and discussion
3.1. Structural study
The X-ray diffraction (XRD) patterns of the Ba5CaTi2−xZnxNb8O30 ceramics (x = 0, 0.04, and 0.08) recorded at room temperature in the 2θ range varying between 10 and 80° with different x values are shown in Fig. 1 All the samples have a tetragonal tungsten bronze (TTB) structure and no second phase can be detected, indicating that Zn2+ has diffused into the bronze structure to form a solid solution in which Zn2+ occupies the sites (B1 and B2) of the TTB structure.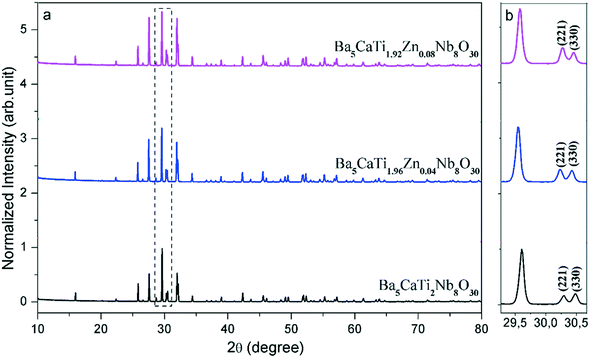 | ||
| Fig. 1 XRD diffraction diagrams of the Ba5CaTi2−xZnxNb8O30 powders calcined at 1300 °C as a function of x (a); (b) the magnification of (a) in the range of 20° to 35°. | ||
To confirm the effect of zinc on the crystal structure, magnified XRD spectra are shown in Fig. 1(b). According to Fig. 1(b), two peaks divided at about 30.4° are the (221) and (330) peaks, respectively. As the Zn2+ concentration increases, the intensity of the (221) peak gradually increases to become identical to that of the (330) peak at x = 0.04 and then the intensity of the (221) peak increases with increasing Zn content, suggesting that some distortion of the crystal structure appears when Zn2+ is introduced into (B1 and B2) sites.
We refined the X-ray diffraction spectra and found that all the samples were single-phase with the non-centrosymmetric P4bm space group (Fig. 2), where Ba2+ is in the A2 site (the pentagonal site), the residue of Ba2+ with Ca2+ occupies the A1 site (the square site) simultaneously with a ratio of 1![[thin space (1/6-em)]](https://www.rsc.org/images/entities/char_2009.gif) :
:![[thin space (1/6-em)]](https://www.rsc.org/images/entities/char_2009.gif) 1, and Ti4+, Zn2+ and Nb5+ occupy the B site with a ratio of 2 − x
1, and Ti4+, Zn2+ and Nb5+ occupy the B site with a ratio of 2 − x![[thin space (1/6-em)]](https://www.rsc.org/images/entities/char_2009.gif) :
:![[thin space (1/6-em)]](https://www.rsc.org/images/entities/char_2009.gif) x
x![[thin space (1/6-em)]](https://www.rsc.org/images/entities/char_2009.gif) :
:![[thin space (1/6-em)]](https://www.rsc.org/images/entities/char_2009.gif) 8.
8.
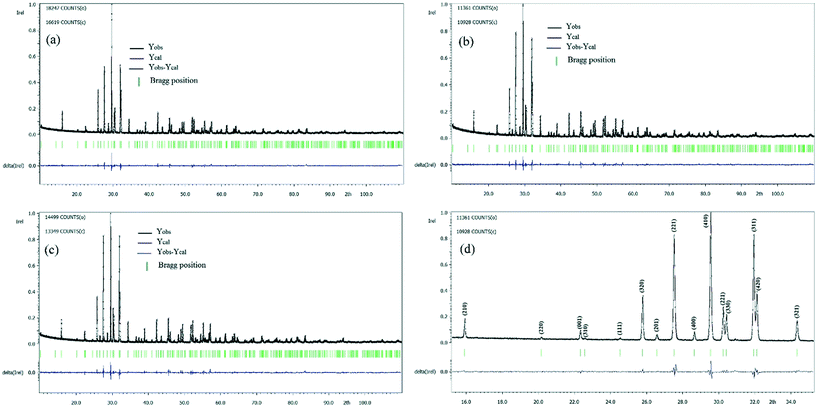 | ||
| Fig. 2 X-ray diffraction refinements for powder Ba5CaTi2−xZnxNb8O30: (a) x = 0, (b) x = 0.04, and (c) x = 0.08 and (d) the magnification of (b) in the range of 20° to 35°. | ||
Fig. 2(d) shows the magnification of Fig. 2(b) in the range of 15° to 35° to illustrate the quality of refinement in the P4bm space group. All the diffraction peaks (hkl) are indexed, with their intensity and shape being satisfactorily reproduced using the refined parameters. The adjustment between the experimental and calculated models is relatively good, and the reliability factors are comparatively high (see Table 1), but the quality of the refinements is sufficient to discuss the proposed structural model and investigate the structural parameters in more detail.
| Chemical formula | Ba5CaTi2Nb8O30 | Ba5CaTi1.96Zn0.04Nb8O30 | Ba5CaTi1.92Zn0.08Nb8O30 |
|---|---|---|---|
| a (Å) | 12.4614(6) | 12.4667(5) | 12.4672(6) |
| b (Å) | 12.4614(6) | 12.4667(5) | 12.4672(6) |
| c (Å) | 3.98366(19) | 3.98510(16) | 3.98406(19) |
| V (Å3) | 618.61(5) | 619.36(4) | 619.24(5) |
| D (μm) | 0.894 | 0.818 | 0.812 |
| Space group | P4bm | P4bm | P4bm |
| Symmetry | Tetragonal | Tetragonal | Tetragonal |
| Rp (%) | 6.04 | 5.77 | 6.33 |
| Rwp (%) | 8.10 | 7.65 | 8.55 |
| GOF | 1.58 | 1.39 | 1.67 |
The refined cell parameters and the reliability factors are presented in Table 1. The refined structural parameters (atomic positions, thermal agitation factors, and occupation rates) are given in Table 2. Tables 3 and 5 provide the selected bond distances and bond angles, respectively. Fig. 3 shows the crystallographic structure along the c-axis for the composition Ba5CaTi1.92Zn0.08Nb8O30. In the tungsten bronze structure, two types of octahedra with different environments are labelled B1 and B2 (see Fig. 3); the interstices A1 (tetragonal) are surrounded by four B2 octahedra, and the interstices A2 (pentagonal) are surrounded by four B2 octahedra and one B1 octahedron.
| Compound | Atom | Wyckoff position | x | y | c | B iso (Å2) | Occupancy |
|---|---|---|---|---|---|---|---|
| x = 0 | Ca1/Ba1 | 2a | 0 | 0 | 0 | 3.00(0) | 0.501/0.499 |
| Ba2 | 4c | 0.17142(7) | 0.67142(7) | 0 | 2.94(7) | 0.993 | |
| Ti1/Nb1 | 2b | 0 | 0.50 | 0.505(2) | 2.42(10) | 0.2/0.8 | |
| Ti2/Nb2 | 8d | 0.07357(9) | 0.21321(8) | 0.503(2) | 1.70(7) | 0.2/0.8 | |
| O1 | 2b | 0 | 0.50 | −0.045(10) | 1.97(21) | 0.9968 | |
| O2 | 4c | 0.2848(5) | 0.7848(5) | 0.460(8) | 2.52(16) | 0.9833 | |
| O3 | 8d | 0.0707(5) | 0.2071(5) | −0.046(5) | 2.52(16) | 1.079 | |
| O4 | 8d | 0.3475(6) | 0.0053(5) | 0.435(4) | 2.52(16) | 0.996 | |
| O5 | 8d | 0.1383(6) | 0.0682(6) | 0.436(5) | 2.52(16) | 0.927 | |
| x = 0.04 | Ca1/Ba1 | 2a | 0 | 0 | 0 | 1.06(11) | 0.549/0.451 |
| Ba2 | 4c | 0.17139(7) | 0.67139(7) | 0 | 2.18(7) | 1.001 | |
| Ti1/Zn1/Nb1 | 2b | 0 | 0.50 | 0.494(2) | 1.66(10) | 0.196/0.004/0.8 | |
| Ti2/Zn2/Nb2 | 8d | 0.07423(10) | 0.21351(9) | 0.498(2) | 1.02(7) | 0.196/0.004/0.8 | |
| O1 | 2b | 0 | 0.50 | 0.070(7) | 1.44(19) | 0.9982 | |
| O2 | 4c | 0.2887(5) | 0.7887(5) | 0.543(8) | 1.44(19) | 0.99 | |
| O3 | 8d | 0.0728(6) | 0.2055(5) | 0.043(5) | 1.44(19) | 1.030 | |
| O4 | 8d | 0.3424(7) | 0.0075(5) | 0.550(5) | 1.44(19) | 0.993 | |
| O5 | 8d | 0.1372(6) | 0.0695(6) | 0.566(4) | 1.44(19) | 0.973 | |
| x = 0.08 | Ca1/Ba1 | 2a | 0 | 0 | 0 | 1.54(11) | 0.529/0.471 |
| Ba2 | 4c | 0.17117(8) | 0.67117(8) | 0 | 2.63(8) | 1.004 | |
| Ti1/Zn1/Nb1 | 2b | 0 | 0.50 | 0.499(3) | 2.15(11) | 0.192/0.008/0.8 | |
| Ti2/Zn2/Nb2 | 8d | 0.07412(11) | 0.2139(10) | 0.498(2) | 1.47(8) | 0.192/0.008/0.8 | |
| O1 | 2b | 0 | 0.50 | 0.044(11) | 1.47(19) | 0.9655 | |
| O2 | 4c | 0.2866(6) | 0.7866(6) | 0.538(9) | 1.47(19) | 0.9888 | |
| O3 | 8d | 0.0734(6) | 0.2047(6) | 0.036(7) | 1.47(19) | 0.979 | |
| O4 | 8d | 0.3421(7) | 0.0054(5) | 0.551(5) | 1.47(19) | 1.022 | |
| O5 | 8d | 0.1363(6) | 0.0699(6) | 0.565(4) | 1.47(19) | 1.000 |
| Bond distances (Å) | x = 0 | x = 0.04 | x = 0.08 |
|---|---|---|---|
| Ca(1)/Ba(1)–O(3) | 2.733(6) × 4 | 2.723(7) × 4 | 2.714(7) × 4 |
| Ca(1)/Ba(1)–O(5) | 2.591(14) × 4 | 2.581(12) × 4 | 2.579(13) × 4 |
| 2.955(15) × 4 | 2.961(13) × 4 | 2.952(14) × 4 | |
| <Ca(1)/Ba(1)–O> | 2.759 | 2.755 | 2.748 |
| Ba(2)–O(2) | 2.71(2) × 1 | 2.76(2) × 1 | 2.75(3) × 1 |
| 2.94(2) × 1 | 2.99(2) × 1 | 2.96(3) × 1 | |
| Ba(2)–O(4) | 2.710(11) × 2 | 2.724(13) × 2 | 2.737(13) × 2 |
| 3.068(12) × 2 | 3.003(14) × 2 | 3.020(14) × 2 | |
| Ti(1)/Zn(1)/Nb(1)–O(1) | 1.79(4) × 1 | 1.69(3) × 1 | 1.81(4) × 1 |
| 2.19(4) × 1 | 2.29(3) × 1 | 2.17(4) × 1 | |
| Ti(1)/Zn(1)/Nb(1)–O(4) | 1.922(8) × 4 | 1.980(9) × 4 | 1.981(9) × 4 |
| <Ti(1)/Zn(1)/Nb(1)–O> | 1.944 | 1.983 | 1.984 |
| Ti(2)/Zn(2)/Nb(2)–O(2) | 1.985(7) × 1 | 1.957(7) × 1 | 1.965(8) × 1 |
| Ti(2)/Zn(2)/Nb(2)–O(3) | 1.80(2) × 1 | 1.81(2) × 1 | 1.84(3) × 1 |
| 2.19(2) × 1 | 2.18(2) × 1 | 2.15(3) × 1 | |
| Ti(2)/Zn(2)/Nb(2)–O(4) | 1.960(8) × 1 | 1.914(8) × 1 | 1.893(8) × 1 |
| Ti(2)/Zn(2)/Nb(2)–O(5) | 1.996(8) × 1 | 1.979(8) × 1 | 1.974(8) × 1 |
| 2.016(8) × 1 | 2.047(8) × 1 | 2.057(8) × 1 | |
| <Ti(2)/Zn(2)/Nb(2)–O> | 1.991 | 1.981 | 1.979 |
The final chemical formula of Ba5CaTi2−xZnxNb8O30 (x = 0, 0.04, and 0.08) after the structural refinement step was Ba4.975Ca0.997Ti2Nb8O29.943, Ba4.906Ca1.099Ti1.96Zn0.04Nb8O29.933, and Ba4.96Ca1.057Ti1.92Zn0.08Nb8O29.891, respectively, evidencing oxygen vacancies; this is attributed to the increase in the number of positive charges lost during the substitution of titanium with zinc and due to high sintering temperature (1450 °C).
From Table 3, we can see that the Ca(1)/Ba(1)–O and Ti/Zn/Nb(2)–O distances decrease with increasing zinc content, but the substitution of titanium with zinc in the B1 octahedral sites causes an increase in the average Ti/Zn/Nb(1)–O distances. This observation suggests that the distribution of metal cations between the B1 and B2 octahedral sites is capable of changing the binding distances in solid solution Ba5CaTi2−xZnxNb8O30.
For all the compositions, the cations Ti, Zn and Nb show clearly off-center displacements along the c-axis in both Ti/Zn/Nb(1)O6 and Ti/Zn/Nb(2)O6 octahedra (Fig. 4). The Ti/Zn/Nb(1)O6 octahedra in all the compositions have a 180° O(1)–Ti/Zn/Nb(1)–O(1) bond angle (see Table 5) and four equal Ti/Zn/Nb(1)–O(4) bond lengths (see Table 3). In addition, the unequal Ti/Zn/Nb(2)–O bond lengths of Ti/Zn/Nb(2)O6 shows the displacement of the cations Ti/Zn/Nb(2) in the ab plane, and no displacement of the cations Ti/Zn/Nb(1) occurs in the ab plane, indicating higher distortion in the octahedron Ti/Zn/Nb(2)O6 than in Ti/Zn/Nb(1)O6, which is demonstrated in the polyhedral representations in Fig. 6.
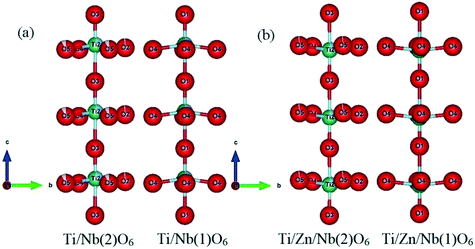 | ||
| Fig. 4 Representations describing the distortions of the two kinds of octahedra in Ba5CaTi2−xZnxNb8O30; (a) x = 0 and (b) x = 0.04 along the a axis. | ||
From Table 4, the off-center displacement of the Ti/Zn/Nb(2) cations in the ab plane increases with increasing zinc content in Ba5CaTi2−xZnxNb8O30, suggesting that octahedral distortions also vary with increasing zinc content.
| x = 0 | x = 0.04 | x = 0.08 | |
|---|---|---|---|
| Ti/Zn/Nb(1) (c-axis) | 0.41 | 0.62 | 0.36 |
| Ti/Zn/Nb(2) (a-axis) | 0.031 | 0.09 | 0.092 |
| Ti/Zn/Nb(2) (b-axis) | 0.036 | 0.065 | 0.081 |
| Ti/Zn/Nb(2) (c-axis) | 0.39 | 0.37 | 0.31 |
| Bond angles (°) | x = 0 | x = 0.04 | x = 0.08 |
|---|---|---|---|
| O(1)–Ti(1)/Zn(1)/Nb(1)–O(1) | 180.0(5) | 180.0(5) | 180.0(5) |
| O(1)–Ti(1)/Zn(1)/Nb(1)–O(4) | 81.6(5) × 4 | 83.5(6) × 4 | 83.9(6) × 4 |
| 98.4(5) × 4 | 96.5(6) × 4 | 96.1(6) × 4 | |
| O(4)–Ti(1)/Zn(1)/Nb(1)–O(4) | 84.9(3) × 2 | 83.9(3) × 2 | 85.5(3) × 2 |
| 92.6(3) × 2 | 94.6(3) × 2 | 93.2(3) × 2 | |
| 163.2(9) × 2 | 166.9(9) × 2 | 167.9(10) × 2 | |
| O(2)–Ti(2)/Zn(2)/Nb(2)–O(3) | 86.8(10) | 86.4(10) | 87.0(11) |
| 97.1(10) | 97.3(10) | 96.5(11) | |
| O(2)–Ti(2)/Zn(2)/Nb(2)–O(4) | 92.8(3) | 93.0(3) | 93.7(3) |
| O(2)–Ti(2)/Zn(2)/Nb(2)–O(5) | 92.1(3) | 94.3(3) | 93.5(4) |
| 167.4(12) | 167.0(11) | 167.8(13) | |
| O(3)–Ti(2)/Zn(2)/Nb(2)–O(3) | 175.1(3) | 174.1(3) | 173.3(3) |
| O(3)–Ti(2)/Zn(2)/Nb(2)–O(4) | 83.3(5) | 85.7(6) | 86.0(7) |
| 99.5(6) | 98.7(6) | 99.4(7) | |
| O(3)–Ti(2)/Zn(2)/Nb(2)–O(5) | 80.7(6) | 79.8(6) | 79.5(6) |
| 80.9(6) | 80.7(5) | 80.9(6) | |
| 95.4(6) | 95.3(6) | 94.7(6) | |
| 95.9(6) | 95.7(6) | 95.5(6) | |
| O(4)–Ti(2)/Zn(2)/Nb(2)–O(5) | 86.5(3) | 84.8(3) | 85.7(3) |
| 163.2(8) | 163.3(8) | 163.4(8) | |
| O(5)–Ti(2)/Zn(2)/Nb(2)–O(5) | 85.3(3) | 84.6(3) | 84.1(3) |
The compression or dilation effects of the different octahedral cation–oxygen bonds can be described by the normalized bond length (the ratio of the actual bond length to the ideal bond length). The ideal bond length is calculated as the sum of the ionic radii of each cation–anion bond. The ionic radii of the cations Ti, Nb and Zn in a coordination number of 6 are 0.605 Å, 0.64 Å and 0.74 Å, respectively. Any bond with a normalized value of >1 is elongated, otherwise it is compressed.
From Fig. 5, in all the compositions, one of the Ti/Zn/Nb(1)–O(1) bonds in the Ti/Zn/Nb(1)O6 octahedra is elongated and the others are compressed, indicating the off-center displacement of Ti/Zn/Nb(1) along the c-axis (see Fig. 4), while the Ti/Zn/Nb(1)–O(4) bonds in the ab plane are compressed, which corresponds to the compression of the octahedra of Ti/Zn/Nb(1)O6 along the c axis, where the displacement of the Ti/Zn/Nb(1) cations along the c axis is more important in compositions with x = 0.04 (see Table 4). For the Ti/Zn/Nb(2)O6 octahedron, in the ab plane, all four bonds are compressed, while along the c axis, one of the Ti/Zn/Nb(2)–O(3) bonds is elongated and the others are compressed. The displacement of the Ti/Zn/Nb(2) cations along the c-axis decreases with increasing zinc content (see Table 4).
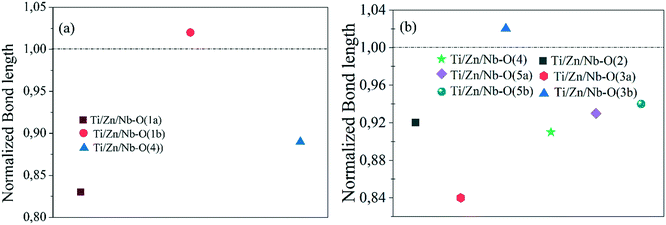 | ||
| Fig. 5 Compression and dilation effects of the corresponding selected bonds: normalized bond lengths of (a) Ti/Zn/Nb(1)–O and (b) Ti/Zn/Nb(2)–O for the Ba5CaTi1.96Zn0.04Nb8O30 ceramic. | ||
Depending on the polyhedral representations, the four oxygen ions of the octahedra Ti/Zn/Nb(2)O6 in the ab plane are gradually directed to different planes with increasing Zn content, which causes the tilting of the octahedra Ti/Zn/Nb(2)O6.
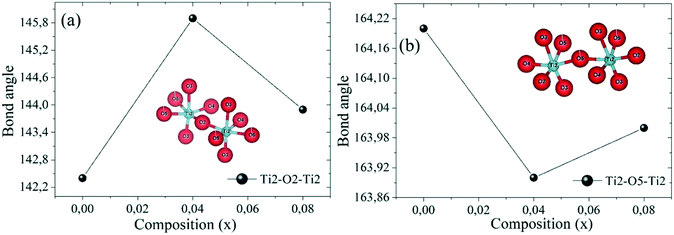
The arrows in Fig. 6 indicate the tilting direction of the octahedra Ti/Zn/Nb(2)O6. Fig. 7 shows the angle of tilting of the octahedra Ti/Zn/Nb(2)O6 as a function of the content of Zn incorporated in Ba5CaTi2−xZnxNb8O30.
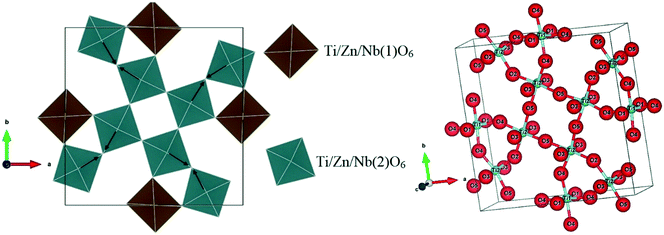 | ||
| Fig. 6 Polyhedral representation of the tetragonal tungsten bronze Ba5CaTi1.96Zn0.04Nb8O30 ceramics. | ||
3.2. Density and microstructure of the Ba5CaTi2−xZnxNb8O30 ceramics
The relative density (ρr) of the Ba5CaTi2−xZnxNb8O30 ceramics was obtained with the help of the following equation:20,30| ρr = ρm/ρt |
The densities of the Ba5CaTi2−xZnxNb8O30 ceramics are presented in Table 6. The relative densities of the Ba5CaTi2−xZnxNb8O30 ceramics are 95.8%, 97.2%, and 97.0%, respectively, suggesting that all the samples are highly densified.
| Composition (x) | ρ m (g cm−3) | ρ t (g cm−3) | ρ r (%) |
|---|---|---|---|
| 0.0 | 5.262 | 5.490 | 95.8 |
| 0.04 | 5.330 | 5.484 | 97.2 |
| 0.08 | 5.326 | 5.489 | 97.0 |
SEM pictures of the surface of the Ba5CaTi2−xZnxNb8O30 pellets sintered at 1450 °C for 6 hours are shown in Fig. 8, with the results of grain size analysis. The microstructural characteristics depend on the transport mechanism of matter between grains via grain boundaries during the sintering process. The absence of voids indicates that the samples have a high density and low porosity, in agreement with the measured relative densities. Grains of unequal size seem to be homogeneously distributed in all the samples. It was seen that the large grains with an asymmetrical distribution of sizes could be due to the different movement kinetics across the boundaries.31 After the sintering process was finished, the gain enhancement process was intensified, resulting in a reduction of pores and the disappearance of the smaller grains.32
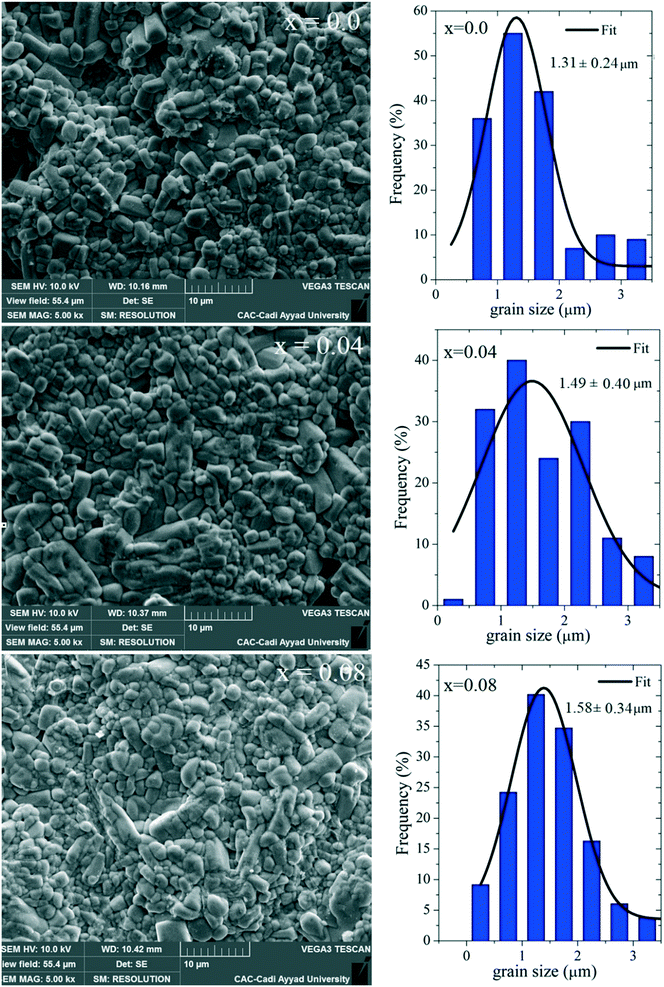 | ||
| Fig. 8 Scanning electron microscopy images of the Ba5CaTi2−xZnxNb8O30 ceramics (x = 0, 0.04 and 0.08) and associated grain size distributions. | ||
The histograms in Fig. 8 suggest that the average grain sizes of Ba5CaTi2−xZnxNb8O30 (x = 0, 0.04 and 0.08) are 1.31, 1.49 and 1.58 μm, respectively. These average values are slightly higher than the “D” values calculated by the Scherrer method. As a matter of fact, on the one hand, this method gives only rough values. On the other hand, the calculated values correspond to the size of the coherently diffracting domains, which is different from the true grain size.
3.3. Study of dielectric properties
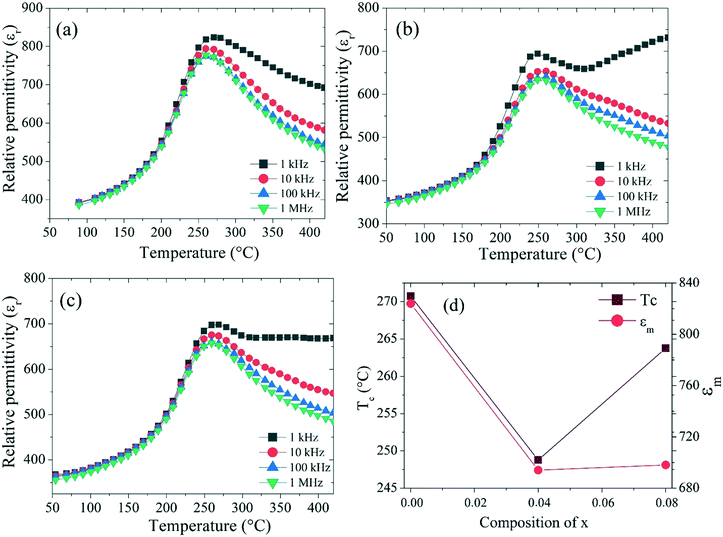
The temperature-dependent dielectric constant (εr) for Ba5CaTi2−xZnxNb8O30 (x = 0, 0.04, and 0.08) at different frequencies (1 kHz–1 MHz) in the temperature range between 50 and 420 °C is shown in Fig. 9.Fig. 9 shows the temperature dependence of the dielectric constant for the Ba5CaTi2−xZnxNb8O30 ceramics doped with different amounts of ZnO. It can be seen that for all the obtained ceramics, obvious dielectric peaks were detected. The peaks of ε are associated with the ferroelectric tetragonal phase (P4bm) to paraelectric phase (P4/mbm) transition. It is also observed that the three compounds have the same Curie temperature (TC) for all the frequencies (1 kHz–1 MHz), indicating that the compounds do not exhibit any relaxor behavior.33 The dielectric peak is found to be broadened, indicating the existence of a diffuse phase transition. Fig. 9(d) shows the evolution of the dielectric constant and Curie temperature (TC) for the Ba5CaTi2−xZnxNb8O30 ceramics measured at 1 kHz as a function of the rate of zinc incorporated in the Ba5CaTi2−xZnxNb8O30 structure. With the increase of x, TC tends to decrease to a value of the order of 248.77 °C, which corresponds to x = 0.04, while the value of the dielectric constant for the compound Ba5CaTi2Nb8O30 is higher than those of the zinc doped compounds.
This minimum value of TC for the compound with x = 0.04 may be due to the tilting of the oxygen octahedron Ti/Zn/Nb(2)O6 as shown in Fig. 7, which reaches the minimum value for Ti(2)–O(5)–Ti(2) and the maximum value for Ti(2)–O(2)–Ti(2) in the compound Ba5CaTi1.96Zn0.04Nb8O30, or may be due to the high displacement of the cations Ti/Zn/Nb(1) along the c-axis in the compound Ba5CaTi1.96Zn0.04Nb8O30 in comparison with the other substitutions (Table 4).
The diffuse phase transition behavior of the dielectric constant can be evaluated using the modified Curie–Weiss equation.34,35
ln(1/εr − 1/εrmax) = γ![[thin space (1/6-em)]](https://www.rsc.org/images/entities/char_2009.gif) ln(T − Tmax) + C1 ln(T − Tmax) + C1 | (1) |
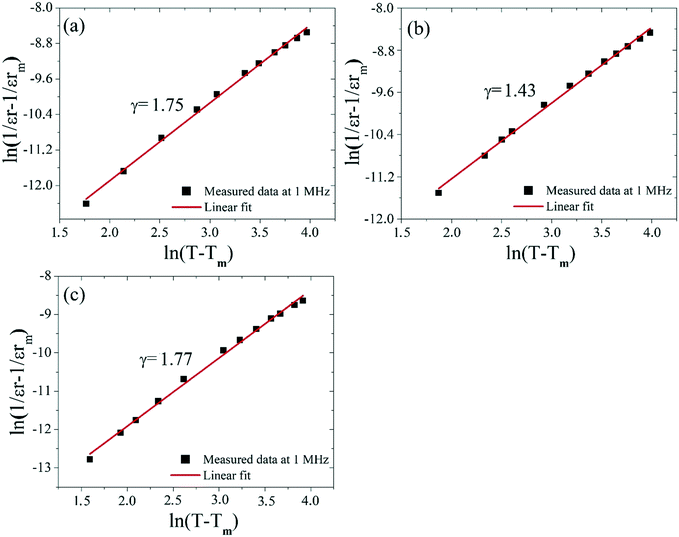 | ||
| Fig. 10 Plots of ln(1/εr − 1/εrmax) as a function of ln(T − Tmax) at 1 MHz for the Ba5CaTi2−xZnxNb8O30 ceramics: (a) x = 0, (b) x = 0.04, and (c) x = 0.08. | ||
The γ value decreases with increasing Zn content, reaches the minimum for x = 0.04 and then increases, indicating a decrease in the degree of diffusion of the Ba5CaTi1.96Zn0.04Nb8O30 ceramics. The diffuse ferroelectric phase transition with a decreasing transition temperature for the Ba5CaTi1.96Zn0.04Nb8O30 ceramics can be seen as a result of the tilting of the oxygen octahedra.36
We have demonstrated from the results of the structural refinement (Table 2) that the formation of oxygen vacancies occurs. Oxygen vacancies (OVs) can easily be formed in oxide materials by the loss of oxygen from the crystal lattice during heating at elevated temperatures (typically at >1300 °C),37 or in our case, by the Ti4+/Zn2+ substitution17 using the Kröger–Vink notation that can be represented as:
 denotes oxygen vacancies. The defects such as oxygen vacancies give rise to disorders in the system, which lead to a diffuse ferroelectric to paraelectric phase transition.38
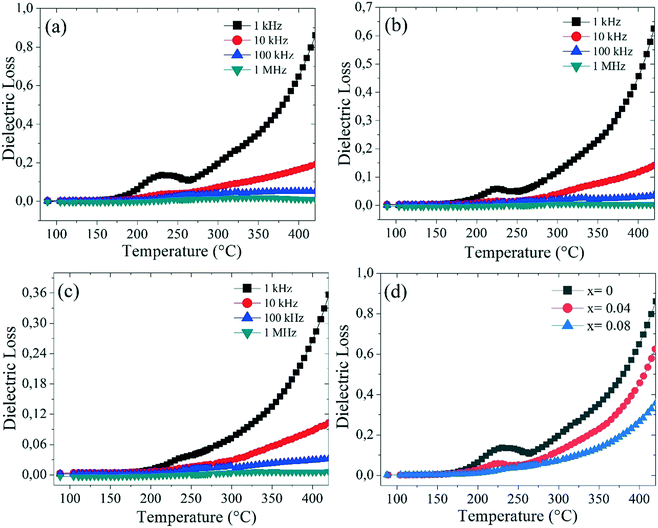
Fig. 11(a–d) show the variation in the dielectric loss (tan![[thin space (1/6-em)]](https://www.rsc.org/images/entities/char_2009.gif) δ) for Ba5CaTi2−xZnxNb8O30 (x = 0, 0.04, and 0.08) at different frequencies. Fig. 11(a–c) show a large peak in a temperature range from 200 °C to 270 °C for the Ba5CaTi2−xZnxNb8O30 ceramics. Such a wide maximum tan
δ) for Ba5CaTi2−xZnxNb8O30 (x = 0, 0.04, and 0.08) at different frequencies. Fig. 11(a–c) show a large peak in a temperature range from 200 °C to 270 °C for the Ba5CaTi2−xZnxNb8O30 ceramics. Such a wide maximum tan![[thin space (1/6-em)]](https://www.rsc.org/images/entities/char_2009.gif) δ value is caused by the ferroelectric-to-paraelectric phase transition. The dielectric loss peak of the ceramics, which appears at a temperature below the dielectric constant, also exhibits a strong frequency dispersion. Fig. 11(d) shows the evolution of the dielectric loss (tan
δ value is caused by the ferroelectric-to-paraelectric phase transition. The dielectric loss peak of the ceramics, which appears at a temperature below the dielectric constant, also exhibits a strong frequency dispersion. Fig. 11(d) shows the evolution of the dielectric loss (tan![[thin space (1/6-em)]](https://www.rsc.org/images/entities/char_2009.gif) δ) for Ba5CaTi2−xZnxNb8O30 measured at 1 kHz as a function of temperature. It is obviously observed that the dielectric loss (tan
δ) for Ba5CaTi2−xZnxNb8O30 measured at 1 kHz as a function of temperature. It is obviously observed that the dielectric loss (tan![[thin space (1/6-em)]](https://www.rsc.org/images/entities/char_2009.gif) δ) of the Ba5CaTi2−xZnxNb8O30 ceramics decreases with the increasing Zn2+ content, which is 0.1165, 0.0734, and 0.048 at 1 kHz, respectively. The incorporation of Zn2+ into the Ti4+ site reduces the tan
δ) of the Ba5CaTi2−xZnxNb8O30 ceramics decreases with the increasing Zn2+ content, which is 0.1165, 0.0734, and 0.048 at 1 kHz, respectively. The incorporation of Zn2+ into the Ti4+ site reduces the tan![[thin space (1/6-em)]](https://www.rsc.org/images/entities/char_2009.gif) δ value.
δ value.
4. Conclusion
Ba5CaTi2−xZnxNb8O30 ceramics (x = 0, 0.04, and 0.08) were successfully synthesized by the conventional solid-state reaction route. Their structural and dielectric properties were systematically studied. Analysis of the XRD data by the Rietveld method showed a tetragonal bronze structure with the space group P4bm and confirmed the formation of oxygen vacancies for all the samples. The octahedral distortion changes considerably according to the composition. The off-center displacement of the Ti/Nb/Zn cations along the c-axis is present in both octahedra Ti/Zn/Nb(1)O6 and Ti/Zn/Nb(2)O6. The octahedra Ti/Zn/Nb(1)O6 and Ti/Zn/Nb(2)O6 of the Ba5CaTi2−xZnxNb8O30 structure are sensitive to Ti4+/Zn2+ substitution, which could contribute to the evolution of the dielectric response within the Ba5CaTi2−xZnxNb8O30 solid solution. The SEM images show a homogeneous microstructure consisting of unevenly sized grains and minimal porosity. The average grain size is in the range of 1.3 to 1.6 μm. All the samples exhibit a diffuse type ferroelectric–paraelectric phase transition and it shows a non-relaxor behaviour. The value of the dielectric constant for the compound Ba5CaTi2Nb8O30 is significantly higher than those of the zinc doped compounds, and the phase change temperature TC decreases for Zn-doped compounds as compared to undoped compounds and reaches a value of the order of 249 °C, which corresponds to x = 0.04. The variation of the dielectric loss (tan![[thin space (1/6-em)]](https://www.rsc.org/images/entities/char_2009.gif) δ) with temperature shows that tan
δ) with temperature shows that tan![[thin space (1/6-em)]](https://www.rsc.org/images/entities/char_2009.gif) δ decreases with increasing Zn content.
δ decreases with increasing Zn content.
Conflicts of interest
There are no conflicts to declare.Acknowledgements
The Department of Chemistry – Multidisciplinary Faculty (FPN) is acknowledged for practical assistance with the spectral analysis.References
- J. Wu, D. Xiao and J. Zhu, Chem. Rev., 2015, 115, 2559–2595 CrossRef.
- Q. Li, M.-H. Zhang, Z.-X. Zhu, K. Wang, J.-S. Zhou, F.-Z. Yao and J.-F. Li, J. Mater. Chem. C, 2017, 5, 549–556 RSC.
- J. F. Li, K. Wang, F. Y. Zhu, L. Q. Cheng and F. Z. Yao, J. Am. Ceram. Soc., 2013, 96, 3677–3696 CrossRef CAS.
- S. Jindal, A. Vasishth, S. Devi and G. Anand, Integr. Ferroelectr., 2018, 186, 1–9 CrossRef CAS.
- B. Yang, S. Hao, P. Yang, L. Wei and Z. Yang, Ceram. Int., 2018, 44, 8832–8841 CrossRef CAS.
- K. Thummavichai, Y. Xia and Y. Zhu, Prog. Mater. Sci., 2017, 88, 281–324 CrossRef CAS.
- K. Shimizu, H. Kato, M. Kobayashi and M. Kakihana, Appl. Catal., B, 2017, 206, 444–448 CrossRef CAS.
- P. Botella, B. Solsona, E. García-González, J. M. González-Calbet and J. M. L. Nieto, Chem. Commun., 2007, 5040–5042 RSC.
- M. Prades, H. Beltrán, N. Masó, E. Cordoncillo and A. R. West, J. Appl. Phys., 2008, 104, 104118 CrossRef.
- I. Levin, M. C. Stennett, G. C. Miles, D. I. Woodward, A. R. West and I. M. Reaney, Appl. Phys. Lett., 2006, 89, 122908 CrossRef.
- T. Velayutham, N. Salim, W. Gan and W. A. Majid, J. Alloys Compd., 2016, 666, 334–340 CrossRef.
- K. Lin, Y. Rong, H. Wu, Q. Huang, L. You, Y. Ren, L. Fan, J. Chen and X. Xing, Inorg. Chem., 2014, 53, 9174–9180 CrossRef.
- Z. J. Yang, W. B. Feng, X. Q. Liu, X. L. Zhu and X. M. Chen, J. Am. Ceram. Soc., 2019, 102, 4721–4729 CrossRef.
- C. Li, Y. H. Huang, J. S. Hong, X. Q. Liu, J. Li and Y. J. Wu, J. Alloys Compd., 2019, 786, 126–133 CrossRef CAS.
- S. Kshirsagar, S. Jigajeni, A. Tarale, D. Salunkhe and P. Joshi, J. Adv. Dielectr., 2015, 5, 1550001 CrossRef CAS.
- S. Abrahams, P. Jamieson and J. Bernstein, J. Chem. Phys., 1971, 54, 2355–2364 CrossRef CAS.
- A. Bendahhou, K. Chourti, R. El Bouayadi, S. El Barkany and M. Abou-Salama, RSC Adv., 2020, 10, 28007–28018 RSC.
- E. Garcia-Gonzalez, A. Torres-Pardo, R. Jimenez and J. Gonzalez-Calbet, Chem. Mater., 2007, 19, 3575–3580 CrossRef CAS.
- P. Yang, B. Yang, S. Hao, L. Wei and Z. Yang, J. Alloys Compd., 2016, 685, 175–185 CrossRef CAS.
- S. Wu, C. Sun, X. Yang, C. Hu, L. Liu and L. Fang, Ceram. Int., 2020, 46, 9240–9248 CrossRef CAS.
- K. Li, X. L. Zhu, X. Q. Liu and X. M. Chen, Appl. Phys. Lett., 2012, 101, 042906 CrossRef.
- K. Li, X. Li Zhu, X. Qiang Liu and X. Ming Chen, Appl. Phys. Lett., 2013, 102, 112912 CrossRef.
- X. L. Zhu and X. M. Chen, J. Am. Ceram. Soc., 2012, 95, 3185–3191 CrossRef CAS.
- J. Gardner and F. D. Morrison, Appl. Phys. Lett., 2016, 109, 072901 CrossRef.
- M. Stennett, I. Reaney, G. Miles, D. Woodward, A. West, C. Kirk and I. Levin, J. Appl. Phys., 2007, 101, 104114 CrossRef.
- M. Stennett, G. Miles, J. Sharman, I. Reaney and A. West, J. Eur. Ceram. Soc., 2005, 25, 2471–2475 CrossRef CAS.
- N. Karan, R. Katiyar, T. Maiti, R. Guo and A. Bhalla, J. Raman Spectrosc., 2009, 40, 370–375 CrossRef CAS.
- Y. Yao, C. Zhou, D. Lv, D. Wang, H. Wu, Y. Yang and X. Ren, Europhys. Lett., 2012, 98, 27008 CrossRef.
- V. Petříček, M. Dušek and L. Palatinus, Z. Kristallogr. - Cryst. Mater., 2014, 229, 345–352 Search PubMed.
- M. Arshad, H. Du, M. S. Javed, A. Maqsood, I. Ashraf, S. Hussain, W. Ma and H. Ran, Ceram. Int., 2020, 46, 2238–2246 CrossRef.
- P. Fang, H. Fan, Z. Xi, W. Chen, S. Chen, W. Long and X. Li, J. Alloys Compd., 2013, 550, 335–338 CrossRef.
- T. Badapanda, V. Senthil, S. Rout, L. Cavalcante, A. Z. Simões, T. Sinha, S. Panigrahi, M. De Jesus, E. Longo and J. A. Varela, Curr. Appl. Phys., 2011, 11, 1282–1293 CrossRef.
- P. R. Das, R. Choudhary and B. Samantray, J. Alloys Compd., 2008, 448, 32–37 CrossRef.
- S. M. Pilgrim, A. E. Sutherland and S. R. Winzer, J. Am. Ceram. Soc., 1990, 73, 3122–3125 CrossRef.
- I. W. Kim, C. W. Ahn, J. S. Kim, T. K. Song, J.-S. Bae, B. C. Choi, J.-H. Jeong and J. S. Lee, Appl. Phys. Lett., 2002, 80, 4006–4008 CrossRef CAS.
- X. Li Zhu, Y. Bai, X. Q. Liu and X. Ming Chen, J. Appl. Phys., 2011, 110, 114101 CrossRef.
- U. Balachandran, B. Odekirk and N. Eror, J. Mater. Sci., 1982, 17, 1656–1662 CrossRef CAS.
- P. Ganguly and A. Jha, Phys. B, 2010, 405, 3154–3158 CrossRef CAS.
| This journal is © The Royal Society of Chemistry 2021 |

