Doxorubicin-loaded nanoscale metal–organic framework for tumor-targeting combined chemotherapy and chemodynamic therapy†
Ting
Xue‡
a,
Caina
Xu‡
b,
Yu
Wang
c,
Yanbing
Wang
b,
Huayu
Tian
 b and
Yingchao
Zhang
 *a
*a
aDepartment of Breast Surgery, Second Hospital of Jilin University, Changchun 130041, China. E-mail: zhang_yc@jlu.edu.cn
bKey Laboratory of Polymer Ecomaterials, Changchun Institute of Applied Chemistry, Chinese Academy of Sciences, Changchun 130022, China
cDepartment of Hepatobiliary and Pancreatic Surgery, Second Hospital of Jilin University, Changchun 130041, China
First published on 13th August 2019
Abstract
Doxorubicin (DOX) as a traditional chemotherapy drug is restricted in clinical applications due to its poor therapeutic activity and severe side effects. Herein, we prepared a metal–organic framework (MOF) MIL-100 by a microwave-assisted synthesis and DOX was loaded in MIL-100 and then, hyaluronic acid (HA) was modified on the surface of MIL-100 to give DMH NPs. The DMH NPs possessed the following advantages: (1) MIL-100 could serve as a drug carrier with a high DOX loading efficiency; MIL-100 could also generate a hydroxyl radical (˙OH) in the presence of H2O2 for chemodynamic therapy (CDT) via a Fenton-like reaction. (2) To improve the dispersibility of MIL-100, HA was modified on the surface of MIL-100, which could endow MIL-100 with a targeting ability towards tumor tissues. (3) DMH NPs could enhance antitumor efficacy and reduce drug-related toxicity though the combination of chemotherapy and chemodynamic therapy. DMH NPs have enormous potential as a candidate for reducing the systemic toxicity and improving the treatment effect for breast cancer.
1. Introduction
Breast cancer is the most frequently diagnosed carcinoma and affects a million females each year.1–3 At present, breast cancer is the second leading cause of death among women. Beyond operation and radiotherapy, chemotherapy is an important treatment method for mammary carcinoma.4–8 Chemotherapy could eliminate remnant nidus that were failed to be removed by surgery and thus prolong the survival of patients.9–11 Doxorubicin (DOX), which is commonly used to treat solid tumors, has been widely accepted in a clinical setting.12–14 However, its clinical application is hindered by its poor bioavailability, systematic toxicity and multi-drug resistance.15,16 Furthermore, DOX could damage normal tissue and cause a series of side effects during treatment, such as nephrotoxicity, cardiotoxicity, and hepatotoxicity.17–19 Therefore, it is necessary to develop an effective method to improve the bioavailability of DOX, reduce its systematic toxicity, and promote its therapeutic effect on breast cancer.Metal–organic frameworks (MOFs) have attracted much attention in recent years, and various types of MOFs have emerged with diverse applications, such as magnetic resonance imaging (MRI), fluorescence imaging, computed tomography (CT) imaging, chemotherapy, photodynamic therapy, and photothermal therapy.20–23 Among the MOFs, MIL-100 is widely used as a drug carrier because of its high capacity for drug loading.24 However, the application of MIL-100 is hindered by its poor aqueous stability.25,26 One solution to overcome this is to modify the surface of MIL-100 using agents such as hyaluronic acid (HA). On the one hand, HA can improve the dispersibility of MIL-100; on the other hand, HA as a natural ligand of the CD44 molecule could endow MIL-100 with a targeting ability towards tumor tissues.27–30 Moreover, MIL-100 could transform H2O2 into hydroxyl radicals (˙OH) via a Fenton-like reaction in the presence of iron in a tumor microenvironment (TME), which could kill cancer cells through chemodynamic therapy.31–34
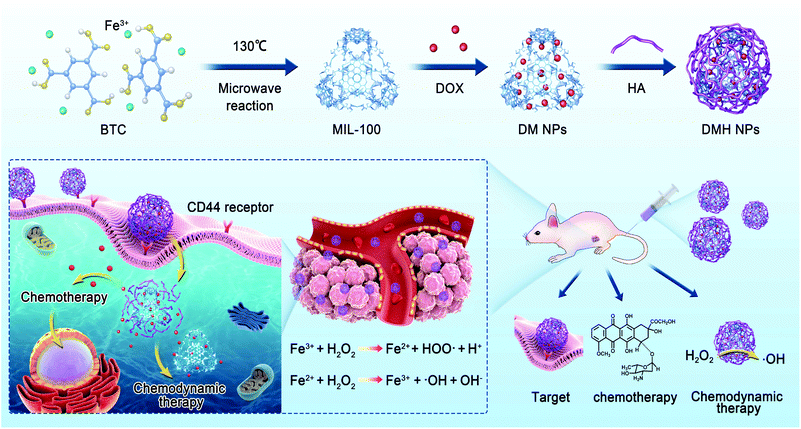
In this study, we prepared MIL-100 by a microwave-assisted synthesis and then used MIL-100 as a nanocarrier to load DOX (represented as DM nanoparticles, DMNPs) against breast cancer, and then used HA to modify the surface of the DM NPs to give DMH NPs (Scheme 1). The physical and chemical properties of the DMH NPs were well characterized. The DMH NPs showed high cellular uptake due to the HA on the surface. Moreover, the DMH NPs exhibited high cytotoxicity to cancer cells, which was attributed to the DOX and ˙OH generated from the Fenton-like reaction of MIL-100. Furthermore, the in vivo experiments demonstrated that the DMH NPs had excellent antitumor effect, combining chemotherapy and chemodynamic tumor therapy with negligible side effects. This strategy might be a promising approach in tumor therapy.
2. Materials and methods
2.1 Materials
1,3,5-Benzenetricarboxylic acid (BTC) and sodium periodate were obtained from Aladdin (Shanghai, China). FeCl3·6H2O was purchased from Aladdin (Shanghai, China). HA was obtained from Freda (Shandong, China). Doxorubicin was obtained from Aladdin (Shanghai, China). Dulbecco's modified Eagle's medium (DMEM) and fetal bovine serum (FBS) were purchased from Gibco (Grand Island, USA).2.2 Preparation of MIL-100
FeCl3·6H2O (8.4 g) and BTC (2.7 g) were dissolved in N,N-dimethylformamide (DMF) and stirred for 10 min. Then, the mixture was placed into a special tube and reacted at 130 °C for 5 min in a microwave reactor. After naturally cooling, the mixture was centrifuged under 10![[thin space (1/6-em)]](https://www.rsc.org/images/entities/char_2009.gif) 000 rpm for 30 min, and the precipitate was collected. After washing with DMF and deionized water three times, the obtained sediment was redispersed in deionized water for further experiments.
000 rpm for 30 min, and the precipitate was collected. After washing with DMF and deionized water three times, the obtained sediment was redispersed in deionized water for further experiments.
2.3 DOX loading
DOX was added into the MIL-100 solution and stirred for 24 h at room temperature in the dark. The mixture was collected and washed with deionized water three times to remove free DOX. The MIL-100 loaded DOX (DM NPs) was obtained after ultrasonic dispersion.To optimize the preparation process, we employed different weight ratios of MIL-100/DOX and compared the drug loading capacity (DLC %) and drug loading efficiency (DLE %). The DOX in different DM NPs was quantified using a UV-Vis spectrophotometer (Shimadzu UV-2401PC). The DLC % and DLE % were calculated according to the following equations: Drug loading capacity (DLC) % = (weight of DOX in DM NPs/weight of DM NPs) × 100%; Drug loading efficiency (DLE) % = (weight of DOX in DM NPs/weight of DOX in the feed) × 100%.
2.4 Preparation of DMH NPs
HA was used for modifying the surface of the DM NPs to prepare the DMH NPs. HA aqueous solutions with different concentrations were added into DM NPs solutions, and stirred for 30 min at room temperature in the dark. Then, the precipitate was collected and washed with deionized water to remove free HA. After water dispersion, the DMH NPs were obtained for the further experiments.2.5 Drug release behavior
To investigate the influence of different pH values on drug release, DM NPs and DMH NPs were diluted in phosphate buffer (PB) (pH 7.4, 6.8, and 5.5) through ultrasonic dispersion and placed in an incubator at 37 °C. The supernatant was collected by centrifuging at different time points, and then replaced with an equal volume of fresh PB. All the collected solutions were measured using a UV-Vis spectrophotometer to calculate the drug release rate based on the standard curve.2.6 Cytotoxicity assay
MCF-7 cells were obtained from Shanghai Cell Bank of the Chinese Academy of Sciences. MCF-7 cells were seeded in a 96-well plate at a density of 5 × 10³ cells per well with 200 μL DMEM medium at 37 °C under 5% CO2. After 24 h cultivation, the cells were treated with MIL-100, DOX, DM NPs, and DMH NPs at various concentrations, respectively. After cultivation for different times, the media were refreshed and added with 20 μL MTT (5 mg mL−1 in PBS) for another 4 h. The solutions in the wells were replaced with DMSO to dissolve the formazan crystals. Eventually, the absorbance at 490 nm was detected using a microplate reader (Bio-Rad, Hercules, CA, USA). The cell viability was calculated as per the following formula: Cell viability (%) = Asample/Acontrol × 100%. Asample and Acontrol denoted the absorbance of a sample well and control well at 490 nm, respectively.2.7 Cellular uptake
MCF-7 cells were incubated at a density of 1 × 10⁵ cells per well into a 12-well plate and incubated at 37 °C under 5% CO2 for 24 h. MIL100, DOX, DM NPs, and DMH NPs were co-cultured with MCF-7 cells pretreated with or without HA for 4 h (DOX final concentration was 5 μg mL−1), respectively. Then, the cells were washed with PBS, trypsinized, collected by centrifugation and resuspended in PBS for flow cytometry analysis.MCF-7 cells were seeded at a density of 1 × 10⁵ cells per well into a 6-well plate and incubated at 37 °C under 5% CO2 for 24 h. MIL-100, DOX, DM NPs, and DMH NPs were co-cultured with MCF-7 cells pretreated with or without HA for 2 and 4 h (DOX final concentration was 10 μg mL−1), respectively. Then, the cells were washed with PBS, immobilized with 4% paraformaldehyde, washed with PBS and stained with DAPI (1 mg mL−1, 1 μL per well) for 10 min. After washing with PBS for another five times, the CLSM specimens were obtained and observed using CLSM (ZEISS LSM780, Germany).
2.8 Detection of ˙OH
H2O2 could be catalyzed by MIL-100 to generate ˙OH. The ˙OH radical has strong oxidizability. 3,3′,5,5′-Tetramethylbenzidine (TMB) as an indicator could be oxidized into ox. TMB by ˙OH, producing an obvious absorption peak at 650 nm. TMB was added in DMH NP solutions with or without H2O2 to colorize. All the samples were tested using a UV-Vis spectrophotometer after the reaction for 30 min.Moreover, ˙OH as a member of ROS could also be detected by 2′,7′-dichlorodihydrofluorescein diacetate (DCFDA). DCFDA could be oxidized to green fluorescent-dichlorofluorescein by intracellular ROS.35,36 Thus, the fluorescence intensity could reflect the levels of ˙OH in the cells. MCF-7 cells were seeded at a density of 2 × 10⁵ cells per well into a 6-well plate and incubated at 37 °C under 5% CO2 for 24 h. Then, DMH NPs with or without H2O2 were added into each well. After cultivation for 4 h, the cells were washed with PBS and cultivated with 2 mL serum-free medium containing 1 mL DCFDA (10 μM) for 30 min. After washing with PBS, a fluorescence microscope was used to monitor the generation of ˙OH.
2.9 In vivo pharmacokinetics and biodistribution study
All animal procedures were performed in accordance with the Guidelines for the Care and Use of Laboratory Animals of Jilin University and approved by the Animal Ethics Committee of Jilin University. Balb/c mice were randomly divided into two groups: DM group and DMH group. The two groups were administered different DOX formulations at a dose of 5 mg kg−1via the rat tail vein. Blood samples were collected and centrifuged at 8000 rpm for 15 min to separate plasma at each predetermined time point (6, 12, 24, 48, and 72 h). The fluorescence intensity of the plasma supernatant was measured for DOX concentration by a microplate reader at the excitation wavelength of 475 nm and the emission wavelength of 485 nm. Subsequently, the tissue distributions of DM NPs and DMH NPs were investigated in Balb/c mice. These mice were injected with DM NPs and DMH NPs via the tail vein. At each time point (6, 12, 24, and 48 h), the mice were sacrificed and the tumor, liver, kidney, lung, spleen and heart were collected for further ex vivo fluorescence imaging.2.10 In vivo antitumor efficacy
Female Balb/c nude mice were used to evaluate the antitumor efficacy of different nanoparticles. MCF-7 cells were subcutaneously injected in Balb/c nude mice (5 × 10⁶ cells per mouse). When the tumor volumes reached approximately 100 mm3, the mice were randomly divided into 5 groups (6 mice per group) and treated with PBS, MIL-100, DOX, DM NPs, and DMH NPs (5 mg kg−1 DOX equivalency) every three days, respectively. The length (L) and width (W) of the tumors were measured with a digital caliper every three days and the tumor volumes (V) were calculated as V = L × W2/2. The mice were also weighed every three days.2.11 Histological analysis
At the end of the treatment, the tumors and major organs (heart, liver, spleen, lung, and kidney) in the different groups were collected to make paraffin sections, which were then stained with haematoxylin and eosin (H&E) to assess histological alterations. To observe cell apoptosis and proliferation in the tumor tissues, Ki67 and caspase-3 analyses were performed using commercial detection kits according to the manufacturers’ instructions.2.12 Toxicity studies
Blood samples of the mice were collected via the ophthalmic vein and centrifuged (8000 rpm, 15 min, 4 °C) to obtain the serum. The concentrations of hepatic function indices (alanine aminotransferase (ALT) and aspartate aminotransferase (AST)), renal function indices (urea nitrogen (BUN) and creatinine (CRE)) and cardiac function index (lactic dehydrogenase (LDH)) in the serum were measured using commercial detection kits.2.13 Statistical analysis
All the experimental data in this study are expressed as the mean ± standard deviation (SD). Statistical comparisons were calculated using the Student's t-test, and ***p < 0.001 was considered to be of extreme significance.3. Results and discussion
3.1 Synthesis and characterization
The preparation process of DMH NPs is shown in Scheme 1. MIL-100 was prepared by a microwave-assisted synthesis, as previously reported.37–39 We employed different weight ratios of MIL-100/DOX varying from 1![[thin space (1/6-em)]](https://www.rsc.org/images/entities/char_2009.gif) :
:![[thin space (1/6-em)]](https://www.rsc.org/images/entities/char_2009.gif) 0.25 to 1
0.25 to 1![[thin space (1/6-em)]](https://www.rsc.org/images/entities/char_2009.gif) :
:![[thin space (1/6-em)]](https://www.rsc.org/images/entities/char_2009.gif) 2. The quantitative analysis of DOX was carried out using a UV-vis spectrophotometer according to the standard curve (Fig. S1†). Moreover, the drug loading capacity (DLC %) and drug loading efficiency (DLE %) were calculated and listed in the Table S1.† When the weight ratio of MIL-100/DOX was 1
2. The quantitative analysis of DOX was carried out using a UV-vis spectrophotometer according to the standard curve (Fig. S1†). Moreover, the drug loading capacity (DLC %) and drug loading efficiency (DLE %) were calculated and listed in the Table S1.† When the weight ratio of MIL-100/DOX was 1![[thin space (1/6-em)]](https://www.rsc.org/images/entities/char_2009.gif) :
:![[thin space (1/6-em)]](https://www.rsc.org/images/entities/char_2009.gif) 0.5, the highest DLE % (80%) was acquired, and the DLC % was 28%. The elemental analysis results showed that the DLC % was approximately 28.9%, as shown in Table S2,† which was similar to the results obtained from the UV–vis spectra. To improve the physiological stability and dispersity of DM NPs, HA was used to modify the surface of the DM NPs. The particle sizes of nanoparticles with different HA amounts are shown in Table S3,† and the suitable size was obtained when the ratio of HA and DM NPs was 0.5
0.5, the highest DLE % (80%) was acquired, and the DLC % was 28%. The elemental analysis results showed that the DLC % was approximately 28.9%, as shown in Table S2,† which was similar to the results obtained from the UV–vis spectra. To improve the physiological stability and dispersity of DM NPs, HA was used to modify the surface of the DM NPs. The particle sizes of nanoparticles with different HA amounts are shown in Table S3,† and the suitable size was obtained when the ratio of HA and DM NPs was 0.5![[thin space (1/6-em)]](https://www.rsc.org/images/entities/char_2009.gif) :
:![[thin space (1/6-em)]](https://www.rsc.org/images/entities/char_2009.gif) 1.
1.
Nitrogen absorption isotherms results showed that MIL-100 possessed a high Brunauer–Emmett–Teller (BET) surface area of approximately 1143 m2 g−1 and a DFT cumulative pore volume of about 1.2 cm3 g−1 (Fig. S3†). These results indicated that MIL-100 had great potential for high drug loading. Compared to MIL-100, the DM NPs had a lower BET surface area and decreased pore volume, suggesting the successful encapsulation of DOX. Moreover, the DMH NPs had the lowest surface area and pore volume compared with MIL-100 and the DM NPs, manifesting the high drug loading and modification with HA. The X-ray diffraction (XRD) pattern of the DM NPs and DMH NPs showed a high similarity to that of MIL-100, as shown in Fig. S4,† illustrating that DOX loading and HA shielding did not alter the structural integrity of MIL-100.
The hydrodynamic sizes of the nanoparticles were measured by a zeta potential/BI-90Plus particle size analyzer. As shown in Fig. 1A–C, particle sizes of MIL-100, DM NPs, and DMH NPs were about 102.8 nm, 108.9 nm, and 132.7 nm, respectively. The scanning electron microscopy (SEM) and transmission electron microscopy (TEM) images showed that the particle sizes of MIL-100, DM NPs and DMH NPs were approximately 87.5 nm, 96.7 nm and 103.4 nm (Fig. 1D–F and Fig. S2A–C†). Moreover, the SEM images also showed that DOX encapsulation and HA modification did not change the morphology of MIL-100. As expected, after coating with HA, the dispersion of DMH NPs became better than that for MIL-100 and DM NPs. Moreover, MIL-100, DM NPs and DMH NPs all had negatively charged surfaces. The zeta potential of the DMH NPs significantly decreased from −5.1 mV to −18.3 mV compared with that of the DM NPs, confirming that HA was successfully decorated on the surface of the DM NPs (Fig. S5†). The DMH NPs had a suitable particle size and adequate surface potential, which shows the great potential for their further in vivo application against cancer. All the above results indicated that the DMH NPs were successfully prepared and could be used for further evaluations.
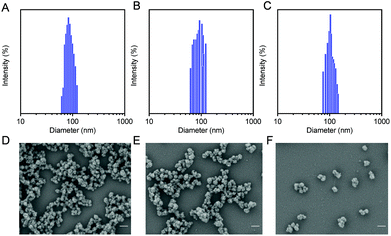 | ||
| Fig. 1 Particle sizes of (A) MIL-100, (B) DM NPs and (C) DMH NPs. SEM images of (D) MIL-100, (E) DM NPs, and (F) DMH NPs (scale bar: 200 nm). | ||
3.2 Drug release behavior
We studied the drug release of the DM NPs and DMH NPs at different pH values. The release of DOX in DM NPs and DMH NPs both showed time- and pH-dependent behaviors. With the extension of time, DOX was gradually released from the DM NPs and DMH NPs (Fig. 2). The DM NPs had the highest drug release percentage of approximately 66% at pH 5.5 after 60 h, while only 37% and 30% DOX were released at pH 6.8 and 7.4 after 60 h, respectively (Fig. 2A). This indicated that the release behavior of DOX from the DM NPs was pH sensitive. This phenomenon was attributed to the cleavage of hydrogen bonds caused by carboxyl protonation in the DOX structure in an acidic environment.40,41 Compared to the DM NPs, the DMH NPs had a lower release percentage of DOX under the same condition (Fig. 2B), which was beneficial to reduce the DOX release at normal tissues and lessen the side effects of the chemotherapeutic agents due to the presence of HA as a protector.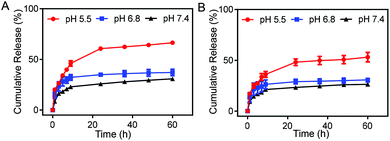 | ||
| Fig. 2 Drug release profiles of (A) DM NPs and (B) DMH NPs at different pH values (5.5, 6.8, and 7.4). | ||
3.3 Cellular uptake and targeting
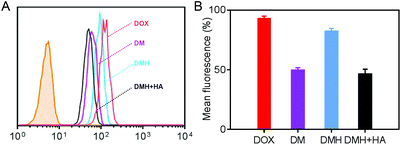
Flow cytometry was carried out to evaluate the cellular uptake of free DOX, DM NPs, and DMH NPs. The fluorescence intensities of intracellular DOX could reflect the cellular uptake ability of free DOX, DM NPs, and DMH NPs (Fig. 3A). MCF-7 cells treated with the DMH NPs showed a higher fluorescence intensity than those treated with the DM NPs. The quantitative fluorescence intensities are shown in Fig. 3B, where it can be seen that free DOX showed a higher fluorescence intensity in the MCF-7 cells than the DM NPs and DMH NPs, and the reason for this was that DOX is small molecule drug and could permeate into cells by free diffusion.42–44 Moreover, the mean fluorescence intensity of MCF-7 cells treated with the DMH NPs was 82.2%, which is higher than that of the DM NPs (49.5%), attributed to the surface modification with HA and the interaction between HA and CD44 receptors. Moreover, the interaction between HA and CD44 receptors overexpressed on the surface of MCF-7 cells was verified by flow cytometry (Fig. S6†). After the competitive inhibition of HA, the DMH NPs had lower fluorescence intensity in the presence of HA than the DMH NPs, which was attributed to the HA-mediated targeting specificity being weakened in the DMH NPs, thus influencing the endocytosis in cells. All the above results illustrated that the cellular uptake of the DMH NPs could be improved with the modification with HA through CD44 receptor-mediated uptake.Furthermore, confocal laser scanning microscopy (CLSM) was performed to verify the cellular uptake and DOX release. The cell nuclei were stained with DAPI (blue), and the released DOX emitted red fluorescence. Red fluorescence was observed in the cells after different treatments (Fig. 4), indicating that the DOX, DM NPs and DMH NPs could enter MCF-7 cells after co-incubation with MCF-7 cells, and DOX was then released from the DM NPs and DMH NPs in the cells. As time passed, the fluorescence intensities in MCF-7 cells increased; for example, the fluorescence intensities were higher at 4 h compared to those at 2 h (Fig. 4A and B), which suggested that the DOX release behaviour in the MCF-7 cells was time-dependent. Moreover, compared with the DM NPs, the free DOX treated cells exhibited higher fluorescence intensities due to the free DOX entering into cells by a passive diffusion mechanism.44 Moreover, the DOX fluorescence intensity in the DMH NP-treated cells was higher in comparison with that in the DM NPs due to the presence of HA and CD44 receptor-mediated uptake. Based on the above results, the DMH NPs possessed excellent cellular uptake due to HA-mediated targeting specificity.
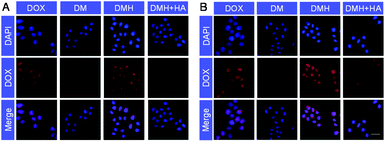 | ||
| Fig. 4 CLSM images of MCF-7 cells treated with DOX, DM NPs, DMH NPs and DMH NPs + HA for (A) 2 h and (B) 4 h, respectively (scale bar: 50 μm). | ||
3.4 Detection of ˙OH
˙OH as a member of reactive oxygen species (ROS) plays an important role in oncotherapy by damaging the cell structure and destroying the cell function.36 Considering that H2O2 could be catalyzed by MIL-100 to generate ˙OH via a Fenton-like reaction, we detected the generation of ˙OH. As shown in Fig. S7,† an absorption peak was observed at 650 nm ascribed to the generation of ˙OH in the DMH NPs + H2O2 solutions with TMB as an indicator. Moreover, the fluorescence images were obtained to observe the generation of ˙OH using DCFDA (Fig. 5). No green fluorescence signal was observed in the MCF-7 cells after PBS, H2O2, and DMH NP treatment. However, an evident green fluorescence was observed in MCF-7 cells treated with DMH NPs and H2O2, indicating that the intracellular H2O2 was catalyzed by DMH NPs and ˙OH was generated via a Fenton-like reaction. | ||
| Fig. 5 Fluorescence images of ROS in MCF-7 cells treated with (A) PBS, (B) H2O2, (C) DMH NPs and (D) DMH NPs + H2O2, respectively (scale bar: 100 μm). | ||
3.5 In vitro cytotoxicity
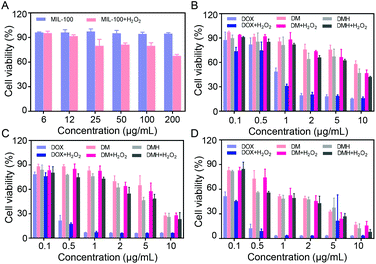
MCF-7 cells co-incubated with MIL-100 at different concentrations still retained a high cell viability of about 90% even with a MIL-100 concentration up to 200 μg mL−1 (Fig. 6A), which demonstrated that MIL-100 had negligible toxicity. Furthermore, considering that intracellular H2O2 could be catalyzed by MIL-100 to generate ˙OH, we assessed the antitumor effect of ˙OH. H2O2 at a concentration of 100 μM was added into MCF-7 cells containing MIL-100 at various concentrations (Fig. 6A), and it was found that the cell viability decreased after the introduction of H2O2, verifying that ˙OH generated by a Fenton-like reaction could damage cells.The in vitro anticancer effects of free DOX, DM NPs, and DMH NPs on MCF-7 cells were evaluated. MCF-7 cells were incubated with DOX, DM NPs and DMH NPs with various concentrations for 24 h, 48 h, and 72 h, respectively. As shown in Fig. 6B–D, the cell viability of MCF-7 cells treated with free DOX, DM NPs, and DMH NPs was dose- and time-dependent. At the equivalent drug concentration, free DOX showed a stronger cell killing efficiency than the DM NPs and DMH NPs. Moreover, the DMH NPs exhibited stronger cytotoxicity than the DM NPs within the experimental concentration range (DOX concentration from 0.1 μg mL−1 to 10 μg mL−1), which was attributed to the presence of HA on the surface of the DMH NPs. These results suggested that the HA-modified DMH NPs facilitated CD44 receptor-mediated endocytosis, resulting in a better cell killing ability. Furthermore, MCF-7 cells incubated with DMH NPs in the presence of H2O2 showed a lower cell viability than the DMH NPs alone, which was due to enhanced effect of ˙OH generated via a Fenton-like reaction. All the aforementioned results showed that the combined chemotherapy and chemodynamic therapy exhibited a great antitumor effect and had great potential for cancer treatment.
3.6 Biodistribution and in vivo pharmacokinetics
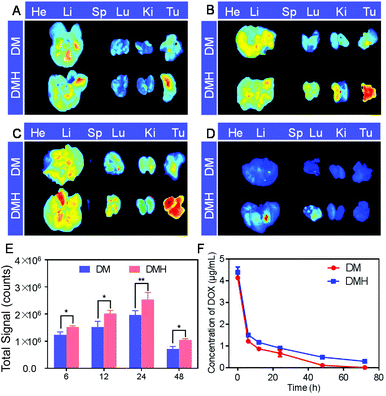
The biodistribution behavior of the DM NPs and DMH NPs was monitored using ex vivo fluorescence. The major organs and tumors were collected and observed at 6, 12, 24, and 48 h post-injection for ex vivo imaging (Fig. 7). The fluorescence intensity at the tumor site increased and reached a peak level at 24 h post-injection and then slightly receded at 48 h post-injection, indicating that the DM NPs and DMH NPs gradually accumulated at the tumor site via the enhanced permeability and retention (EPR) effect. Furthermore, the tumors of the DMH NP-injected mice exhibited higher fluorescence intensity than those of the mice treated with DM NP injection, which was ascribed to CD44 receptor-mediated targeting. All the above-mentioned results showed that the DMH NPs had a strong tumor-targeting capacity based on the EPR effect and CD44 receptor-mediated targeting. ROI analysis of the tumor region demonstrated the advantages of the DMH NPs in in vivo biodistribution (Fig. 7E).The pharmacokinetics of the DM NPs and DMH NPs showed that the DOX concentration from the DM NPs decreased more quickly than that from the DMH NPs (Fig. 7F), which indicated that the DMH NPs could significantly prolong the DOX systemic circulation time, maintain the drug concentration in the blood and improve the biocompatibility.
3.7 Anticancer efficacy in vivo
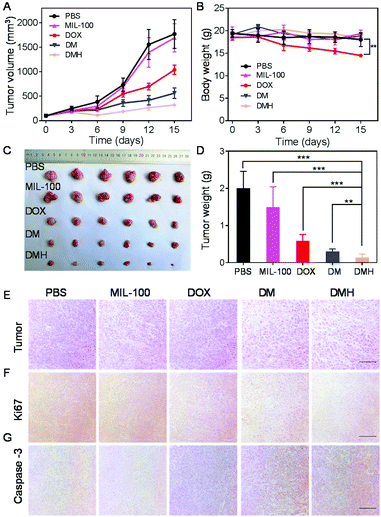
Encouraged by the excellent antitumor effect in vitro and accumulation at the tumor site, the antitumor effect in vivo of the DMH NPs was investigated on MCF-7 tumor-bearing mice. When the tumor volumes reached about 100 mm3, the mice were randomly divided into five groups: PBS, MIL-100, DOX, DM NPs, and DMH NPs. The mice were injected with PBS, MIL-100, DOX, DM NPs, and DMH NPs every three days, respectively. Moreover, the tumor volume and bodyweight were recorded every three days. As shown in Fig. 8A, the tumors of the mice injected with PBS exhibited rapid growth, while the tumor volumes of the mice treated with MIL-100 were slightly lower compared with the PBS group due to ˙OH generated from the Fenton-like reaction. ˙OH could damage the tumor cells and make them more fragile to chemotherapeutic treatment.45 Furthermore, the tumor inhibition in the DM NP group was better than that in the DOX group. Furthermore, the DMH NP group exhibited more preferable tumor suppression compared to the others because of CD44 receptor-mediated targeting and combined chemotherapy and chemodynamic therapy. It is worth noting that no significant bodyweight change was detected in the other groups, except in the DOX group (Fig. 8B), suggesting that DOX encapsulated in nanoparticles could be conducive to reduce the systemic side effects of free DOX. Moreover, the photographs of the tumor and tumor weight were consistent with the tumor growth curves, further confirming the reduction of the tumor size after the different treatments (Fig. 8C and D). For further confirmation, the H&E staining of the tumors showed that the area of necrosis in the tumor tissues in the DMH NPs group was larger than that of the other groups (Fig. 8E). To reveal the underlying mechanism of tumor growth inhibition by the different treatments, the proliferation and apoptosis levels in the tumor sections were further analyzed with Ki67 and caspase-3 assays.46–48 As shown in Fig. 8F and G, the DMH NPs inhibited cell proliferation and induced apoptosis in tumor tissues. All the above results confirmed that the DMH NPs exhibited excellent an antitumor effect, and had potential for further applications.3.8 Systemic toxicity evaluation
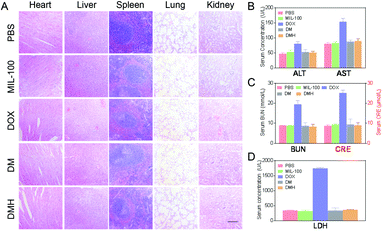
For further safety analysis, the major organs were tested with H&E staining. The organ tissue sections revealed no obvious pathological abnormalities, except for the free DOX group (Fig. 9A). The H&E images in the DOX groups showed that some damage occurred in the hearts and livers after treatment, which might lead to extensive hepatocellular vesicular steatosis and focal inflammation in the liver.49 In contrast, in the DMH NPs group, minimal liver damage and no damage in the other organs were observed because of the biosafety and good biocompatibility.The primary causes limiting the clinical application of DOX are the several serious side effects, including liver and kidney damage and cardiotoxicity.49–51 Thus, a series of key clinical biomarker levels in serum were detected to estimate the effects of the nanoparticles. Clearly, a drastic increase in AST, ALT, BUN, CRE, and LDH levels was observed in the DOX-treated mice (Fig. 9B), indicating that DOX could damage the normal tissue without specificity. Moreover, the CRE and BUN levels induced by the DMH NPs were also significantly lower than those of mice treated with free DOX and close to those for the PBS group (Fig. 9C). As a biochemical criterion of myocardial damage, the level of LDH could reflect the cardiotoxicity. As shown in Fig. 9D, as expected, the level of LDH in the free DOX group significantly increased, which indicated DOX-induced cardiotoxicity. All these results suggested that the DMH NPs have a superior advantage in reducing the systemic toxicity of free DOX.
4. Conclusions
In this study, MIL-100 was synthesized by a microwave-assisted synthesis to load DOX and then, HA was coated on the surface of the DM NPs to prepare DMH NPs. The DMH NPs released DOX in a pH-dependent manner. Moreover, the DMH NPs possessed great advantages in cellular uptake due to HA decoration on the surface of the DMH NPs. Moreover, the combination of chemotherapy and chemodynamic therapy of the DMH NPs could effectively induce MCF-7 cell death. The DMH NP group exhibited more preferable tumor suppression compared to the others because of CD44 receptor-mediated targeting and the combined chemotherapy and chemodynamic therapy. Altogether, engineering DMH NPs has a great promise for cancer treatment.Conflicts of interest
There are no conflicts to declare.Acknowledgements
The authors are thankful to the National Natural Science Foundation of China (31701084, 51873208, and 51520105004), National program for support of Top-notch young professionals, Jilin province science and technology development program (20180414027GH) for financial support of this study.References
- R. L. Siegel, K. D. Miller and A. Jemal, CA Cancer J. Clin., 2018, 68, 7–30 CrossRef PubMed.
- F. Bray, J. Ferlay, I. Soerjomataram, R. L. Siegel, L. A. Torre and A. Jemal, CA Cancer J. Clin., 2018, 68, 394–424 CrossRef PubMed.
- T. Li, C. Mello-Thoms and P. C. Brennan, Breast Cancer Res. Treat., 2016, 159, 395–406 CrossRef CAS PubMed.
- I. J. Boero, A. J. Paravati, J. Hou, E. F. Gillespie, A. Schoenbrunner, J. Unkart, A. M. Wallace, J. P. Einck, L. K. Mell and J. D. Murphy, Ann. Surg., 2019, 269, 951–958 CrossRef PubMed.
- T. B. Bevers, M. Helvie, E. Bonaccio, K. E. Calhoun, M. B. Daly, W. B. Farrar, J. E. Garber, R. Gray, C. C. Greenberg, R. Greenup, N. M. Hansen, R. E. Harris, A. S. Heerdt, T. Helsten, L. Hodgkiss, T. L. Hoyt, J. G. Huff, L. Jacobs, C. D. Lehman, B. Monsees, B. L. Niell, C. C. Parker, M. Pearlman, L. Philpotts, L. B. Shepardson, M. L. Smith, M. Stein, L. Tumyan, C. Williams, M. A. Bergman and R. Kumar, J. Natl. Compr. Cancer Network, 2018, 16, 1362–1389 CrossRef PubMed.
- S. J. Katz, P. M. Lantz, N. K. Janz, A. Fagerlin, K. Schwartz, L. Liu, D. Deapen, B. Salem, I. Lakhani and M. Morrow, Cancer, 2005, 104, 1854–1861 CrossRef PubMed.
- Y. Yao, L. Sun, Y. Meng, Y. Zhuang, L. Zhao, Q. Yu and C. Si, J. Surg. Res., 2019, 241, 178–187 CrossRef PubMed.
- A. Santiago-Gómez, T. Kedward, B. M. Simões, I. Dragoni, R. NicAmhlaoibh, E. Trivier, V. Sabin, J. M. Gee, A. H. Sims, S. J. Howell and R. B. Clarke, Cancer Lett., 2019, 458, 66–75 CrossRef PubMed.
- D. Y. Kim, J. C. Youn, M. S. Park, S. Lee, S. W. Choi, K. H. Ryu, L. S. Kim, M. S. Shim, J. J. Lee and S. Han, J. Cardiol., 2019, 74, 175–181 CrossRef PubMed.
- S. P. Ackland, V. Gebski, N. Zdenkowski, A. Wilson, M. Green, S. Tees, H. Dhillon, G. Van Hazel, J. Levi, R. J. Simes, J. F. Forbes, A. S. Coates and L. for Breast Cancer Trials, Breast Cancer Res. Treat., 2019, 176, 357–365 CrossRef CAS PubMed.
- I. E. G. van Hellemond, I. J. H. Vriens, P. G. M. Peer, A. C. P. Swinkels, C. H. Smorenburg, C. M. Seynaeve, M. J. C. van der Sangen, J. R. Kroep, H. de Graaf, A. H. Honkoop, F. L. G. Erdkamp, F. van den Berkmortel, M. de Boer, W. K. de Roos, S. C. Linn, A. L. T. Imholz, V. C. G. Tjan-Heijnen and G. Dutch Breast Cancer Research, Int. J. Cancer, 2019, 145, 274–283 CrossRef CAS PubMed.
- S. R. Jean, D. V. Tulumello, C. Riganti, S. U. Liyanage, A. D. Schimmer and S. O. Kelley, ACS Chem. Biol., 2015, 10, 2007–2015 CrossRef CAS PubMed.
- H. Cui, M. L. Huan, W. L. Ye, D. Z. Liu, Z. H. Teng, Q. B. Mei and S. Y. Zhou, Mol. Pharm., 2017, 14, 746–756 CrossRef CAS PubMed.
- S. Sangomla, M. A. Saifi, A. Khurana and C. Godugu, J. Trace Elem. Med. Biol., 2018, 47, 53–62 CrossRef CAS PubMed.
- J. Yu, C. Wang, Q. Kong, X. Wu, J. J. Lu and X. Chen, Phytomedicine, 2018, 40, 125–139 CrossRef CAS PubMed.
- E. K. G. Moreno, L. F. Garcia, G. S. Lobon, L. B. Brito, G. A. R. Oliveira, R. Luque and E. de Souza Gil, Ecotoxicol. Environ. Saf., 2019, 179, 143–150 CrossRef CAS PubMed.
- S. Hajra, A. R. Patra, A. Basu and S. Bhattacharya, Biomed. Pharmacother., 2018, 101, 228–243 CrossRef CAS PubMed.
- R. Sahu, T. K. Dua, S. Das, V. De Feo and S. Dewanjee, Food Chem. Toxicol., 2019, 125, 503–519 CrossRef CAS PubMed.
- D. Luo, K. A. Carter, E. A. G. Molins, N. L. Straubinger, J. Geng, S. Shao, W. J. Jusko, R. M. Straubinger and J. F. Lovell, J. Controlled Release, 2019, 297, 39–47 CrossRef CAS PubMed.
- P. Horcajada, T. Chalati, C. Serre, B. Gillet, C. Sebrie, T. Baati, J. F. Eubank, D. Heurtaux, P. Clayette, C. Kreuz, J. S. Chang, Y. K. Hwang, V. Marsaud, P. N. Bories, L. Cynober, S. Gil, G. Ferey, P. Couvreur and R. Gref, Nat. Mater., 2010, 9, 172–178 CrossRef CAS PubMed.
- J. Yao, Y. Liu, J. Wang, Q. Jiang, D. She, H. Guo, N. Sun, Z. Pang, C. Deng, W. Yang and S. Shen, Biomaterials, 2019, 195, 51–62 CrossRef CAS PubMed.
- M. X. Wu, J. Gao, F. Wang, J. Yang, N. Song, X. Jin, P. Mi, J. Tian, J. Luo, F. Liang and Y. W. Yang, Small, 2018, 14, e1704440 CrossRef PubMed.
- C. Guo, S. Xu, A. Arshad and L. Wang, Chem. Commun., 2018, 54, 9853–9856 RSC.
- V. Gupta, S. Tyagi and A. K. Paul, J. Nanosci. Nanotechnol., 2019, 19, 646–654 CrossRef CAS PubMed.
- M. Al Haydar, H. R. Abid, B. Sunderland and S. Wang, Drug Des., Dev. Ther., 2019, 13, 23–35 CrossRef PubMed.
- L. Han, H. Qi, D. Zhang, G. Ye, W. Zhou, C. Hou, W. Xu and Y. Sun, New J. Chem., 2017, 41, 13504–13509 RSC.
- J. Cai, J. Fu, R. Li, F. Zhang, G. Ling and P. Zhang, Carbohydr. Polym., 2019, 208, 356–364 CrossRef CAS PubMed.
- K. Dong, Y. Zhang, L. Zhang, Z. Wang, J. Ren and X. Qu, Talanta, 2019, 194, 703–708 CrossRef CAS PubMed.
- D. Liu, F. Jin, G. Shu, X. Xu, J. Qi, X. Kang, H. Yu, K. Lu, S. Jiang, F. Han, J. You, Y. Du and J. Ji, Biomaterials, 2019, 211, 57–67 CrossRef CAS PubMed.
- H. Kim, J. Cha, M. Jang and P. Kim, Biomater. Sci., 2019, 7, 2264–2271 RSC.
- J. He, Y. Zhang, X. Zhang and Y. Huang, Sci. Rep., 2018, 8, 5159 CrossRef PubMed.
- M. Songbo, H. Lang, C. Xinyong, X. Bin, Z. Ping and S. Liang, Toxicol. Lett., 2019, 307, 41–48 CrossRef CAS PubMed.
- N. Koleini, B. E. Nickel, A. L. Edel, R. R. Fandrich, A. Ravandi and E. Kardami, Chem.-Biol. Interact., 2019, 303, 35–39 CrossRef CAS PubMed.
- K. Sun, Z. Gao, Y. Zhang, H. Wu, C. You, S. Wang, P. An, C. Sun and B. Sun, J. Mater. Chem. B, 2018, 6, 5876–5887 RSC.
- S. Gao, P. Zheng, Z. Li, X. Feng, W. Yan, S. Chen, W. Guo, D. Liu, X. Yang, S. Wang, X. J. Liang and J. Zhang, Biomaterials, 2018, 178, 83–94 CrossRef CAS PubMed.
- K. Zibara, A. Zeidan, H. Bjeije, N. Kassem, B. Badran and N. El-Zein, J. Cell Commun. Signal., 2017, 11, 57–67 CrossRef PubMed.
- Y. Zhang, L. Wang, L. Liu, L. Lin, F. Liu, Z. Xie, H. Tian and X. Chen, ACS Appl. Mater. Interfaces, 2018, 10, 41035–41045 CrossRef CAS PubMed.
- T. Simon-Yarza, M. Gimenez-Marques, R. Mrimi, A. Mielcarek, R. Gref, P. Horcajada, C. Serre and P. Couvreur, Angew. Chem., Int. Ed., 2017, 56, 15565–15569 CrossRef CAS PubMed.
- A. Zimpel, T. Preiß, R. Röder, H. Engelke, M. Ingrisch, M. Peller, J. O. Rädler, E. Wagner, T. Bein, U. Lächelt and S. Wuttke, Chem. Mater., 2016, 28, 3318–3326 CrossRef CAS.
- J. Chen, J. Ding, Y. Zhang, C. Xiao, X. Zhuang and X. Chen, Polym. Chem., 2015, 6, 397–405 RSC.
- J. Ding, C. Xiao, Y. Li, Y. Cheng, N. Wang, C. He, X. Zhuang, X. Zhu and X. Chen, J. Controlled Release, 2013, 169, 193–203 CrossRef CAS PubMed.
- G. Sahay, E. V. Batrakova and A. V. Kabanov, Bioconjugate Chem., 2008, 19, 2023–2029 CrossRef CAS PubMed.
- C. Xu, Y. Wang, Z. Guo, J. Chen, L. Lin, J. Wu, H. Tian and X. Chen, J. Controlled Release, 2019, 295, 153–163 CrossRef CAS PubMed.
- X. Guo, C. Shi, J. Wang, S. Di and S. Zhou, Biomaterials, 2013, 34, 4544–4554 CrossRef CAS PubMed.
- U. S. Srinivas, B. W. Q. Tan, B. A. Vellayappan and A. D. Jeyasekharan, Redox Biol., 2018, 101084 CrossRef PubMed.
- Y. Hu, R. Gu, J. Zhao, Y. Yang, F. Liu, L. Jin, K. Chen, H. Jia, H. Wang, Q. Liu, F. Su and W. Jia, BMC Cancer, 2017, 17, 28 CrossRef PubMed.
- W. Gao, J. Wu, X. Chen, L. Lin, X. Fei, K. Shen and O. Huang, J. Cancer, 2019, 10, 1110–1116 CrossRef PubMed.
- D. Liu, M. Liu, W. Wang, L. Pang, Z. Wang, C. Yuan and K. Liu, Biochem. Biophys. Res. Commun., 2018, 498, 453–457 CrossRef CAS PubMed.
- S. Niu, G. R. Williams, J. Wu, J. Wu, X. Zhang, H. Zheng, S. Li and L.-M. Zhu, Chem. Eng. J., 2019, 369, 134–149 CrossRef CAS.
- M. Gou, H. Shi, G. Guo, K. Men, J. Zhang, L. Zheng, Z. Li, F. Luo, Z. Qian, X. Zhao and Y. Wei, Nanotechnology, 2011, 22, 095102 CrossRef PubMed.
- G. Takemura and H. Fujiwara, Prog. Cardiovasc. Dis., 2007, 49, 330–352 CrossRef CAS PubMed.
Footnotes |
| † Electronic supplementary information (ESI) available: Detailed description of XRD spectra, zeta potential, and additional experimental results. See DOI: 10.1039/c9bm01044k |
| ‡ These authors contributed equally to this work. |
| This journal is © The Royal Society of Chemistry 2019 |

