 Open Access Article
Creative Commons Attribution 3.0 Unported Licence
Shell isolated nanoparticles for enhanced Raman spectroscopy studies in lithium–oxygen cells
Thomas A.
Galloway
,
Laura
Cabo-Fernandez
,
Iain M.
Aldous
,
Filipe
Braga
and
Laurence J.
Hardwick
 *
*
Stephenson Institute for Renewable Energy, Department of Chemistry, University of Liverpool, L69 7ZF, UK. E-mail: hardwick@liverpool.ac.uk
First published on 17th May 2017
Abstract
A critical and detailed assessment of using Shell Isolated Nanoparticles for Enhanced Raman Spectroscopy (SHINERS) on different electrode substrates was carried out, providing relative enhancement factors, as well as an evaluation of the distribution of shell-isolated nanoparticles upon the electrode surfaces. The chemical makeup of surface layers formed upon lithium metal electrodes and the mechanism of the oxygen reduction reaction on carbon substrates relevant to lithium–oxygen cells are studied with the employment of the SHINERS technique. SHINERS enhanced the Raman signal at these surfaces showing a predominant Li2O based layer on lithium metal in a variety of electrolytes. The formation of LiO2 and Li2O2, as well as degradation reactions forming Li2CO3, upon planar carbon electrode interfaces and upon composite carbon black electrodes were followed under potential control during the reduction of oxygen in a non-aqueous electrolyte based on dimethyl sulfoxide.
1. Introduction
Improvements in the lifespans and safety of lithium metal anodes and the development of stable cathodes within lithium–air batteries requires an understanding and control of electrode interfaces. Surface layers form at electrode interfaces either through spontaneous chemical reactions or during electrochemical cycling. This can be advantageous, providing stabilisation, but it can also hinder activity by inhibiting the kinetics and hence the rate of charge/discharge. The solid electrolyte interphase (SEI) is a passivation layer formed on the lithium metal negative electrode in non-aqueous electrolytes that allows the diffusion of lithium cations, but is an electron insulator. It influences not only the stability and conductivity, but also the irreversible charge loss, power capability, cycle life and safety.1,2 Surface layer formation is also important in lithium–air batteries since the formation of the reduction products can cause degradation or passivation of the electrode surface, limiting their performance and cyclability.3Raman spectroscopy is an attractive spectroscopic technique for the in situ investigation of lithium battery materials,4–7 and surface reactions in metal–air batteries.8–11 Raman spectroscopy is based on scattering processes that are intrinsically weak when compared to optical processes like absorption and fluorescence;12 therefore, it requires amplification of the signal.12 Over the past couple of decades promising developments have been achieved in surface enhanced Raman spectroscopy (SERS).13,14 However, the need for a surface plasmon that would be excited by the laser means that SERS is limited by the structure and morphology of the surface (i.e. only roughened coinage metals).12,15,16 In 2010 Li et al.17,18 developed shell isolated nanoparticles for enhanced Raman spectroscopy (SHINERS). This technique employs gold nanoparticles as portable plasmons to enhance the local vibrational modes of nearby molecules when deposited on the electrode surface.19 The gold nanoparticles are coated with a thin (2–3 nm), uniform silicon dioxide shell to inhibit any catalytic effect from the gold surface.20 The main benefit of this technique is that it permits the user to take advantage of the SERS phenomenon, via the utilisation of localised plasmon enhancement,21 upon a broader range of substrates and interrogate electrode–electrolyte interfaces under potential control. Significantly, this opens up the possibility of using SHINERS to study practical battery electrodes that consist of a porous matrix of complex interfaces such as conductive carbons, semiconducting transition metal oxides and ‘inert’ polymeric binders.
SHINERS has been applied in multiple fields.22 It has been used to study an array of electrode surfaces, predominantly flat in nature, i.e. single crystals.23,24 However, it is known that the roughness of the surface has a direct impact on the enhancement factor of the SHINs, since a change in magnitude can be observed between single crystal facets of the same metal.25 There are only a few studies on surfaces with more porous morphologies.26 It is therefore important to understand the variation in the enhancement between different surfaces in order to optimise the Raman technique for battery investigations.
The present work shows enhancement factor studies on several electrode substrates and how the enhancement varies from spot to spot due to the nanoparticle distribution upon the electrode. The application of the SHINERS technique is shown within the lithium–oxygen system, to study surface layer formation on lithium metal after exposure to electrolyte and the oxygen reduction reaction (ORR) reaction mechanism on carbon electrodes.
2. Experimental
2.1 Synthesis of Au–SiO2 core–shell nanoparticles (SHINs)
The preparation of gold nanoparticles coated with an ultrathin silica shell involved two main steps.17,18 First, gold nanoparticles with an average size of 55 nm in diameter were synthesised by the standard sodium citrate reduction method.27 An aqueous solution of HAuCl4·3H2O (0.29 mM, 200 ml) was refluxed in an oil bath with vigorous stirring. Trisodium citrate solution (34 mM, 1.4 ml) was added to the boiling gold solution and the mixture was left under reflux for 40 minutes. The resulting citrate-capped gold nanoparticles were coated with silica following the procedure described in the literature.10 Briefly, 30 ml of Au nanoparticle solution was stirred with a freshly prepared solution of (3-aminopropyl)trimethoxysilane, APTMS (1.51 mM, 400 μl), for 20 minutes at room temperature. Afterwards, a sodium silicate solution (0.54% wt, pH 10.2, 3.2 ml) was added and stirred for another 6 minutes at room temperature prior to transferring the flask to a water bath at 95 °C. Several aliquots were collected after heating for 20 to 60 minutes and centrifuged at 5500 rpm for 15 minutes. After removing the supernatant the nanoparticles were washed with Milli-Q® water three times, repeating the centrifugation steps in between. The final particles were collected as a concentrated solution and stored under cool, dark conditions.All the glassware was thoroughly washed with Piranha solution (H2SO4![[thin space (1/6-em)]](https://www.rsc.org/images/entities/char_2009.gif) :
:![[thin space (1/6-em)]](https://www.rsc.org/images/entities/char_2009.gif) H2O2 5
H2O2 5![[thin space (1/6-em)]](https://www.rsc.org/images/entities/char_2009.gif) :
:![[thin space (1/6-em)]](https://www.rsc.org/images/entities/char_2009.gif) 1) and Aqua Regia (HCl
1) and Aqua Regia (HCl![[thin space (1/6-em)]](https://www.rsc.org/images/entities/char_2009.gif) :
:![[thin space (1/6-em)]](https://www.rsc.org/images/entities/char_2009.gif) HNO3 3
HNO3 3![[thin space (1/6-em)]](https://www.rsc.org/images/entities/char_2009.gif) :
:![[thin space (1/6-em)]](https://www.rsc.org/images/entities/char_2009.gif) 1) before any synthetic step.
1) before any synthetic step.
2.2 Characterisation of synthesised Au–SiO2 nanoparticles
Size distributions and shell thicknesses were determined by transmission electron microscopy (TEM) using a JEOL 2100F transmission electron microscope with 200 keV acceleration voltages. The samples were prepared by drop casting nanoparticle solutions onto lacey carbon films on 300 mesh copper grids (Agar Scientific) and dried under vacuum or in air. The images were collected and analysed with Digital Micrograph (Gatan Software).UV-Vis analysis of diluted nanoparticle solutions was carried out with a Shimadzu 2600 spectrometer using 1 cm quartz cuvettes.
2.3 Pinhole detection tests
The presence of any pinholes in the SHINs’ silica shells was investigated by running electrochemical and Raman tests. Cyclic voltammetry in 0.1 M H2SO4 was performed on a glassy carbon electrode with SHINs drop casted on the surface, sweeping the potentials between −0.2 V and 1.5 V (vs. Ag/AgCl) using a Biologic potentiostat.10For the Raman pinhole test, the nanoparticle solution was deposited on a silicon wafer (Si (100), Agar Scientific) using 10 mM pyridine solution (Sigma Aldrich) as a probe molecule.17,18 The spectra were collected with a Renishaw inVia microscope using a laser with a 632.8 nm wavelength.
2.4 Determination of enhancement factors
The enhancement factor of the SHINs was initially determined by depositing the nanoparticles on a gold wafer (Au (111), Platypus Technologies) using pyridine as a probe molecule,17,18 similarly to the pinhole test described above.The effect of the substrate on the enhancement factor was investigated on several planar electrodes and battery composite electrodes. Rhodamine-6G (99%, Sigma Aldrich), crystal violet (for microscopy, Sigma Aldrich) and malachite green (for microscopy, Sigma Aldrich) dyes were used as alternative probe molecules to pyridine, since they adsorb onto carbon-based materials.
The Raman spectra were collected using a 632.8 nm wavelength laser and a power of ca. 0.45 mW on the sample.
The enhancement factor has a dependence on the surface roughness.10 Therefore, the roughness factor of each material was determined electrochemically by running cyclic voltammetry of 1 mM ferrocene in 0.1 M tetraethylammonium perchlorate (TEAClO4, Sigma Aldrich) in acetonitrile (AN).
2.5 Investigation of nanoparticle distribution on gold substrates
The distribution of nanoparticles drop casted on a gold substrate was studied by atomic force microscopy (AFM) (Bruker, Multimode 8) and by scanning electron microscopy (SEM) (JEOL, JSM 7001F).2.6 Ex situ and in situ electrochemical SHINERS studies
Raman measurements were performed with a Renishaw inVia microscope with 632.8 nm or 785 nm wavelength lasers. The samples were brought into focus with a microscope, through a 50× objective (Leica). The laser power was minimised by using suitable filters to avoid local heating and degradation of the samples. Raman spectra were baseline corrected for clarity.
Ex situ SHINERS studies of lithium metal (Sigma Aldrich) were carried out in a hermetically sealed Raman cell (EL-CELL®). Lithium electrodes were cycled against graphite in an electrolyte of 1 M LiPF6 in ethylene carbonate![[thin space (1/6-em)]](https://www.rsc.org/images/entities/char_2009.gif) :
:![[thin space (1/6-em)]](https://www.rsc.org/images/entities/char_2009.gif) dimethyl carbonate, 1
dimethyl carbonate, 1![[thin space (1/6-em)]](https://www.rsc.org/images/entities/char_2009.gif) :
:![[thin space (1/6-em)]](https://www.rsc.org/images/entities/char_2009.gif) 1 w/w (LP30, BASF), or in an oxygen saturated 0.25 M lithium perchlorate (LiClO4, Sigma Aldrich) solution in bis(2-methoxyethyl)ether (Diglyme, ROMIL). After cycling, the electrode was washed with the solvent to remove the remaining electrolyte salt and dried under vacuum prior to assembly into the sealed Raman cell.
1 w/w (LP30, BASF), or in an oxygen saturated 0.25 M lithium perchlorate (LiClO4, Sigma Aldrich) solution in bis(2-methoxyethyl)ether (Diglyme, ROMIL). After cycling, the electrode was washed with the solvent to remove the remaining electrolyte salt and dried under vacuum prior to assembly into the sealed Raman cell.
In situ electrochemical SHINERS experiments were carried out in a sealed three-electrode cell configuration, with a sapphire window at the bottom.10 The cell was assembled inside an argon-filled glovebox with different carbon working electrodes, with SHINs drop casted on the electrode surface. The carbon electrodes investigated were edge plane pyrolytic graphite (EPPG) and basal plane pyrolytic graphite (BPPG) with a 3 mm diameter purchased from IJ Cambria Ltd. A Pt coil and Ag wire were used as counter and reference electrodes, respectively. In situ SHINERS measurements of a carbon black composite electrode were carried out in an electrochemical Raman cell (EL-CELL®) assembled inside of an argon containing glovebox (H2O and O2 below 1 ppm).7 The working electrode consisted of a free-standing film of carbon black (Super C65, IMERYS) prepared by mixing the powder with PTFE binder (poly(tetrafluoroethylene), Sigma Aldrich) in a 70![[thin space (1/6-em)]](https://www.rsc.org/images/entities/char_2009.gif) :
:![[thin space (1/6-em)]](https://www.rsc.org/images/entities/char_2009.gif) 30 weight ratio in ethanol. The resulting ‘putty’ mixture after ethanol evaporation was passed through a calendaring machine to obtain a thin free-standing film and then cut in 8 mm diameter electrodes. The electrodes were then dried at 120 °C under vacuum, before transference into the glovebox. An electrolyte of 0.5 M lithium perchlorate (LiClO4, Sigma Aldrich) in dimethyl sulfoxide (DMSO, Sigma Aldrich) was purged with oxygen prior to the measurements. The cell was connected to a potentiostat (Biologic) to run the electrochemical measurements, once positioned on the microscope stage. All potentials (unless otherwise stated) are referenced against Li/Li+.
30 weight ratio in ethanol. The resulting ‘putty’ mixture after ethanol evaporation was passed through a calendaring machine to obtain a thin free-standing film and then cut in 8 mm diameter electrodes. The electrodes were then dried at 120 °C under vacuum, before transference into the glovebox. An electrolyte of 0.5 M lithium perchlorate (LiClO4, Sigma Aldrich) in dimethyl sulfoxide (DMSO, Sigma Aldrich) was purged with oxygen prior to the measurements. The cell was connected to a potentiostat (Biologic) to run the electrochemical measurements, once positioned on the microscope stage. All potentials (unless otherwise stated) are referenced against Li/Li+.
3. Results and discussion
3.1 Characterisation and evaluation of SHINERS particles
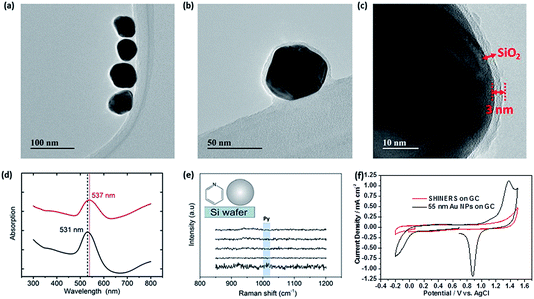
The TEM images in Fig. 1a–c demonstrate that the synthesised Au–SiO2 core–shell nanoparticles (SHINs) are pinhole free with an average shell thickness of 3 nm. The addition of a uniform SiO2 shell is also established by the shift in the absorption maximum of the surface plasmon band (SPB) as shown in Fig. 1d. The shift is not only due to the increase in the nanoparticle size, but also to the change in the dielectric constant induced by the silica coating. The absence of pyridine ring bending modes in the Raman spectra at 1010 and 1036 cm−1 indicates that the particles are pinhole free. This was also confirmed electrochemically by the absence of redox peaks for SHINs deposited on a GC electrode in an acidic medium (Fig. 1e–f).103.2 Enhancement factor (EF) studies on battery electrode materials
SHINERS has been used as a successful method to enhance a variety of different substrates.10,17 Understanding the enhancement across different substrates is of particular importance in determining whether SHINs can be utilised in different environments or whether some surfaces are SHINERS inactive. However, a quantifiable enhancement factor has only been determined on gold surfaces.18,25,28 Li et al.25 noted that even between different gold single crystal facets a notable change in enhancement can be observed. Such a variance in enhancement from facet to facet indicates that the enhancement may change drastically from substrate to substrate.The enhancement on gold has been determined by measuring the adsorption of pyridine on the surface. Pyridine is used as it adsorbs strongly onto the gold surface (Fig. 2), and exhibits two bands at 1010 cm−1 and 1036 cm−1 that can be assigned to the ring bending modes of the pyridine skeleton.25 Measuring the intensities of these bands allows the determination of the enhancement factor. However, the adsorption of pyridine is limited to gold and platinum surfaces, as pyridine does not adsorb on non-metallic substrates29 such as carbon or more practical battery materials (i.e., carbon black, graphitic carbon or lithium titanate (Li4Ti5O12) particles)). An alternative probe molecule is required in order to determine the enhancement of these electrode surfaces, in order to demonstrate whether SHINERS is a viable technique for studying battery mechanisms.
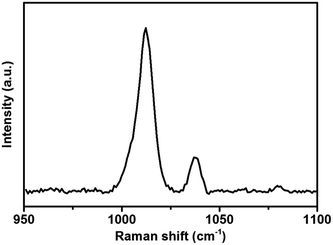 | ||
| Fig. 2 Raman spectrum of 10 mM pyridine adsorbed on a gold wafer with drop casted SHINs (55 nm Au NP, 2 nm shell). | ||
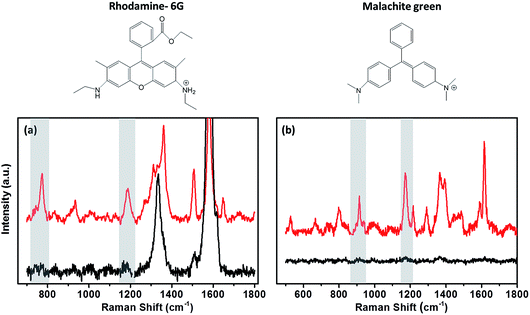
A range of dyes have been investigated as possible candidates for studying the variation in the enhancement between substrate surfaces. Malachite green (MG), rhodamine-6G (R-6G) and crystal violet (CryV) have all been observed to adsorb on both metallic and non-metallic substrates. Chen et al.30 used R-6G and CryV organic dyes to investigate the SERS enhancement on substrates containing graphene oxide shell-isolated silver particles. These dyes have also been used by Zhang et al.31 to determine the EF for SHINs synthesised by an atomic layer deposition (ALD) method. MG is another organic dye with a characteristic Raman signal, used in EF studies of starch-coated Ag nanoparticles,32 and as a standard in tip-enhancement Raman spectroscopy (TERS) measurements.33 Raman spectra for all the dyes show pronounced bands due to adsorption on the different surfaces, which can be clearly enhanced by the SHINs (Fig. 3). The rhodamine 6G (Fig. 3a) Raman spectrum has multiple absorption bands; the band at 774 cm−1 due to the C–H out of plane bending vibration of the xanthene skeleton was used to analyse the enhancements across different surfaces. A second band at 1180 cm−1 resulting from the ring deformation was also analysed to verify that the enhancement was not band specific.30,34 Likewise, the 938 cm−1 and 1177 cm−1 peaks for MG and the 911 cm−1 and 1175 cm−1 for CryV were analysed. These bands were chosen to minimise any contribution to the peak intensity from the carbon D (ca. 1330 cm−1) and G (ca. 1590 cm−1) bands.
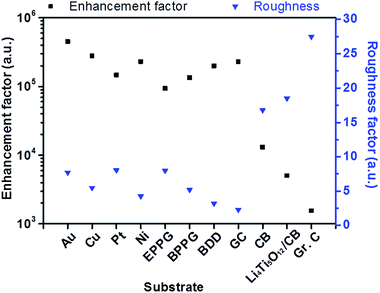
The intensities of the bands change from one surface to another following the trend Au > Cu > Pt > Si > GC > carbon black, indicating that the enhancement from the SHINs is directly affected by the surface’s nature and morphology. The enhancement is also dependent on the surface coverage of nanoparticles, as seen by the changes in the peak intensity from spot to spot. Au displays the strongest enhancement across all of the substrates tested, with other precious metals also displaying strong enhancement (e.g. Cu and Pt). Au has been proven to be a highly SERS active surface, due to the conductive nature of the surface and the dampening of the imaginary part of the dielectric function (ε) when roughened (eqn (1)).29
 | (1) |
The surface can contribute to the localised surface plasmons of the SHINs on the surface. The surface contribution is maximised on Au, then decreases through the less SERS active materials such as Pt and Cu, followed by other transition metals which make little surface contribution.13
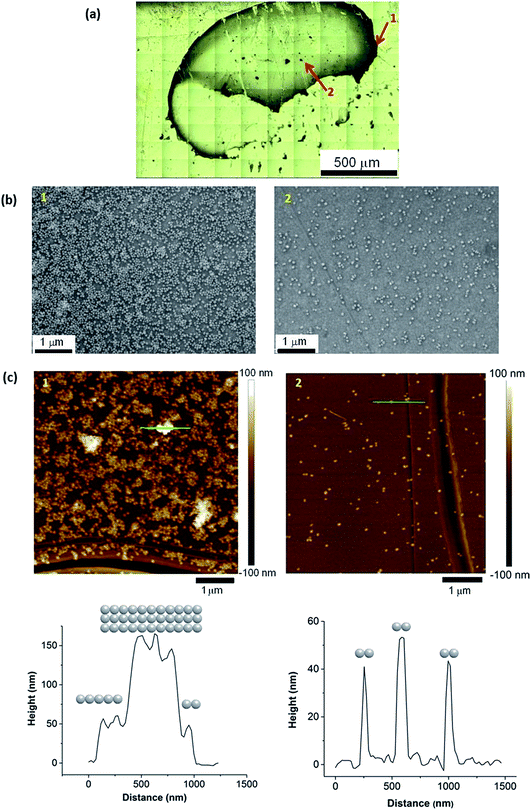
Alternative non-metallic surfaces, such as carbon, rely solely on the surface plasmon resonance (SPR) from the SHINs generating hot spots on the substrate.13 The morphology of the surface has a direct impact on the enhancement, where optimal enhancement from the SHINs occurs on a flat surface, as a uniform monolayer of SHINs can be achieved. This uniform layer is difficult to achieve, as air or vacuum drying of the drop cast nanoparticle solution leads to the formation of a thick ring at the edge of the drop, due to the cohesive nature of water (Fig. 4a). Clearly more advanced coating methods need to be employed in the future to obtain consistent and evenly spread monolayers of SHIN particles. Towards the centre of the drop more dispersion of the nanoparticles is shown in the optical, AFM and SEM images of the gold substrate. SEM images in Fig. 4b show a greater concentration of particles at the drop edge with much better coverage than in the centre of the drop, where the particles are more dispersed, although in certain regions particles tend to group in islands. This is in agreement with the AFM images in Fig. 4c. Height profiles from the AFM images suggest that the nanoparticles are grouped as a single layer with 2 clusters per island in the centre of the drop in agreement with previous results from Li et al.28 At the edge of the drop, larger islands with typical clusters ranging from 2 up to 11 nanoparticles are observed, and up to three layers of particles on top of each other can be found, reducing or completely blocking the amplification of the signal; however, monolayers are still observed in some areas. The effect on the variation in the enhancement of the Raman signal due to the distribution of nanoparticles has been observed through the Raman mapping of the pyridine peak intensity on the gold surface shown in Fig. 5. Here Raman mapping of the intensity of the pyridine peak at 1010 cm−1 is shown to correlate with the nanoparticle distribution observed in the optical microscope image, where some areas display significant enhancements (shown in red).
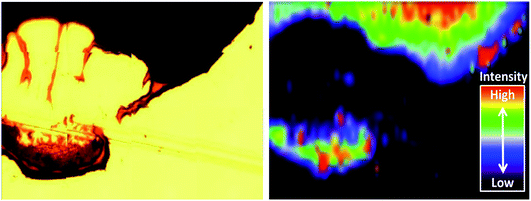 | ||
| Fig. 5 (Left) Optical image of a SHIN drop on a gold electrode; (right) Raman map of the intensity of the pyridine peak at 1010 cm−1 in relation to the nanoparticle distribution. | ||
Polycrystalline Au is relatively flat in nature compared with graphitic carbons, which have varying degrees of roughness and porosity, and thus spaces exist in-between deposited particles. Therefore, rough surfaces make it more challenging to form a consistent uniform layer of nanoparticles, in turn affecting the SPR intensity. This acts as a limiting factor in the calculation of an enhancement factor. In order to determine a quantifiable value for the enhancement factor, it is necessary to include a value for the roughness factor (R) (eqn (2)).
 | (2) |
The roughness factor can be calculated from the relationship between the electrode’s real and geometrical areas (eqn (3)). The actual electrode area (A) was estimated using the Randles–Sevčik equation by plotting ipvs. ν1/2 (eqn (4)), from the values obtained from cyclic voltammetry of the Fc/Fc+ redox couple in a TEAClO4-in-acetonitrile electrolyte.
 | (3) |
 | (4) |
![[thin space (1/6-em)]](https://www.rsc.org/images/entities/char_2009.gif) 485 C mol−1), A the electrode area (cm2), C the concentration of the redox species, ν the scan rate (V s−1), D the diffusion coefficient (D = 2.11 × 10⁻⁵ cm2 s−1, calculated from the Stokes–Einstein equation),36R the gas constant (8.31 J K−1 mol−1), and T the temperature (298 K).
485 C mol−1), A the electrode area (cm2), C the concentration of the redox species, ν the scan rate (V s−1), D the diffusion coefficient (D = 2.11 × 10⁻⁵ cm2 s−1, calculated from the Stokes–Einstein equation),36R the gas constant (8.31 J K−1 mol−1), and T the temperature (298 K).
Fig. 6 demonstrates the relationship between the surface roughness and enhancement factor (calculated from eqn (2)) across a range of different electrode surfaces. The metallic surfaces have similar experimentally calculated roughness values; therefore, enhancement factor variation is likely a result of differing amounts of surface contribution. Carbon black and Li4Ti5O12/C electrodes have considerably larger roughness factors, and these account for the loss of enhancement, due to poor distribution of the particles on the surfaces as explained above. SHINERS has been shown to produce substantial enhancements on metallic substrates, with enhancement factors in excess of 4 × 10⁵ for polycrystalline gold. From this evaluation, SHINERS can lead to enhancement factors of 2 × 10³ on more practical electrode materials, such as carbon black, thus showing that SHINERS provides sufficient signal enhancement to investigate more complex composite electrode surfaces.
3.3 Ex situ SHINERS studies on lithium metal
Lithium metal is an ideal battery electrode due to its low molecular weight (6.9 g mol−1), leading to a high theoretical capacity (3860 mA h g−1).37 However, there are several problems with its application in rechargeable batteries. The main issues are related to stability and also safety, since dendrites grow on the metal surface during cycling that lead to short circuiting of the battery.37 Metallic lithium is reactive when put into contact with organic electrolytes and gases,38,39 forming multicomponent surface layers containing species with low oxidation states in close proximity to the lithium surface and constituents with higher oxidation states within the outer layer.40 The growth of dendrites and the performance of the electrode are strongly influenced by the surface layers and impurities,41 therefore it is important to have better knowledge of the surface film composition at the metallic lithium surface in different electrolytes. Several spectroscopic techniques have been used such as infrared (FTIR), X-ray photoelectron (XPS) and Raman spectroscopy.40One of the major challenges of using Raman for investigation of the lithium SEI is the sensitivity of this metal to local laser heating decomposition.41–43 Due to the Raman signal enhancement, SHINERS allows the measurement of the lithium surface layer with an improved signal-to-noise ratio at short exposure times and low laser powers (10 s, ca. 0.1 mW). Since the synthesised SHINs are in an aqueous medium, a solvent incompatible with lithium metal, a method to carry out SHINERS on lithium was developed. Instead of depositing the nanoparticles on the metal, they were first drop casted onto a quartz window (that is used within a sealed Raman cell) and dried under vacuum overnight prior to cell assembly. Fig. 7 shows that pyridine bands are present in spectra collected with the nanoparticles on the window, while they are absent in spectra collected with a clean window. The results from this test show that the signal can still be amplified even if the particles were not initially directly deposited onto the substrate.
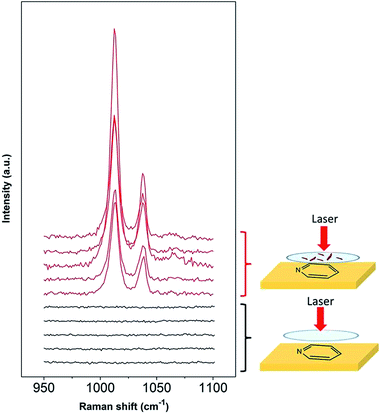 | ||
| Fig. 7 SHINERS experiments for pyridine on a gold substrate with SHINs drop casted on the Raman window. | ||
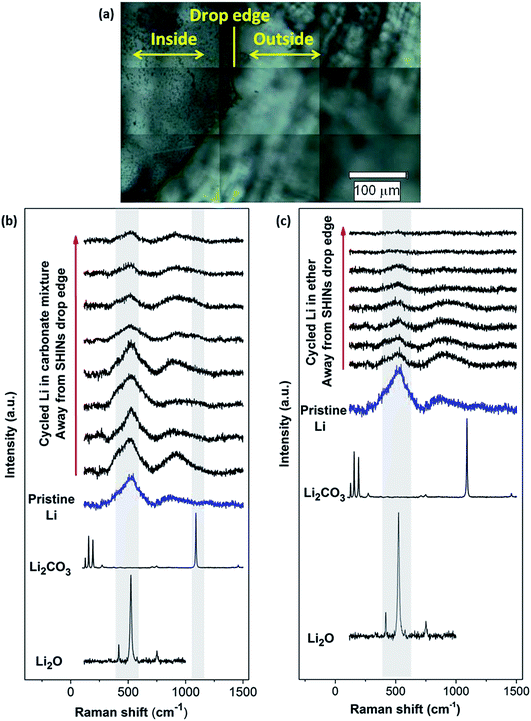
Similarly, SHINERS measurements were run for both pristine lithium metal and after cycling in carbonate-based and ether-based electrolytes against a graphite electrode. The spectrum of pristine lithium presents three main peaks as seen in Fig. 8, with two broad bands centred at 510 and 910 cm−1 and a sharper peak at 1846 cm−1 (not shown for clarity). The first band at 510 cm−1 has been reported to be Li2O,42 and the second one at 910 cm−1 can be assigned to R–O–C and C–C bond stretching vibrations in semicarbonates.43 The peak at 1846 cm−1 (band not displayed in Fig. 8, see later in Fig. 9) is assigned to C![[triple bond, length as m-dash]](https://www.rsc.org/images/entities/char_e002.gif) C stretching of the acetylene group of Li2C2 species.41–44 Naudin et al.42 reported that the presence of this compound on the metallic lithium surface is due to decomposition of Li2CO3 induced by local laser heating. Therefore, even with SHINERS, the complete avoidance of laser decomposition seems unachievable. A shoulder at 410 cm−1 is also observed in certain spectra, the origin of which is still not clear, but it has also been reported by Naudin et al.42 This peak could also be related to Li2O, since the spectrum of the powder has a less intense peak at 417 cm−1, as seen in Fig. 8.
C stretching of the acetylene group of Li2C2 species.41–44 Naudin et al.42 reported that the presence of this compound on the metallic lithium surface is due to decomposition of Li2CO3 induced by local laser heating. Therefore, even with SHINERS, the complete avoidance of laser decomposition seems unachievable. A shoulder at 410 cm−1 is also observed in certain spectra, the origin of which is still not clear, but it has also been reported by Naudin et al.42 This peak could also be related to Li2O, since the spectrum of the powder has a less intense peak at 417 cm−1, as seen in Fig. 8.
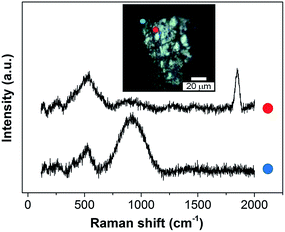 | ||
| Fig. 9 Ex situ SHINERS spectra collected on lithium metal after cycling in an O2 saturated 0.25 M LiClO4-in-diglyme electrolyte showing the non-homogeneous film formed during discharge. | ||
LiF and LiOH·H2O are other SEI components frequently observed on lithium metal. Bulk LiF has no characteristic first-order peaks,45 but several multi-order peaks have been reported for LiF cluster nanofilms at 120, 300, 408, 614 and 966 cm−1.45,46 The absence of the bands at lower frequency and at 614 cm−1 in the spectra collected for metallic lithium suggests that LiF is not present, at least not in the outer SEI, as expected since LiF is generally thought to be formed within the inner SEI.45 LiOH·H2O can be formed due to water impurities in the electrolyte, but the absence of the O–H stretching band at approximately 3500 cm−1 (not shown) indicates that LiOH·H2O is not present and thereby validates the careful environmental controls used within the experimental protocol.45
Raman spectra collected during ex situ SHINERS measurements after cycling lithium in the lithium battery electrolyte 1 M LiPF6 in EC/DMC show similar features to those for pristine lithium (Fig. 8b). The main difference is the appearance of a shoulder at 1098 cm−1 associated with the carbonate anion of Li2CO3.45,47 Compared to the Raman spectrum of Li2CO3, the peaks at lower frequencies (100 to 400 cm−1) and 1459 cm−1 are not present. It has been previously reported that the absence of these bands associated with asymmetric and bending modes in the spectrum could be due to weak intensities and/or the formation of an amorphous Li2CO3 film.47Fig. 8b also shows a trend in the peak intensity in relation to the distance from the SHIN deposits. The intensities of the main bands at 510 and 910 cm−1 are stronger in the proximity of the drop edge, decreasing upon going further from the nanoparticles. In a similar way, the intensity of the shoulder observed at 410 cm−1 decreases in the positions away from SHINs. In the case of the band associated with Li2CO3 at 1098 cm−1, there is no clear trend but a lower intensity is also observed in the spectra collected in positions away from SHINs. These results indicate that there is enhancement due to the presence of SHINs with the possibility of using an even lower laser intensity during Raman measurements to decrease the decomposition produced by local laser heating.
Carbonate-based electrolytes are not optimal for Li–O2 batteries, since they decompose in the presence of the reduced oxygen species formed during discharge, leading to the formation of Li2CO3 and other organic compounds, rather than the desired lithium peroxide (Li2O2).3,48,49
Ether-based electrolytes have shown better performance in Li–O2 cells, since they are more stable in the presence of superoxide species and there is a measure of reversible formation and removal of Li2O2.3,48 The SEI composition on lithium metal was investigated by SHINERS after cycling in this more appropriate Li–O2 electrolyte. Fig. 8c presents the SHINERS spectra collected for metallic lithium after cycling in an oxygen saturated 0.25 M LiClO4-in-diglyme electrolyte. Li2O and semicarbonate bands appear at 520 and 905 cm−1, respectively, similarly to the spectrum for pristine lithium metal. The main difference when compared to the spectra collected in the carbonate-based electrolyte is the absence of the band associated with Li2CO3 species at 1090 cm−1. It should be highlighted that a black film was observed on the surface of lithium cycled in the ether-based electrolyte. The Raman spectrum in this region has a strong contribution from the broad band centred at 900 cm−1 and the Li2O band at 520 cm−1 has a lower intensity. It can also be noticed that the peak at 1845 cm−1 assigned to decomposition product Li2C2 species formed due to laser decomposition is absent (Fig. 9). These results show the inhomogeneity of the surface film formed on lithium, in agreement with previous reports.40,42,43,50
3.4 In situ electrochemical SHINERS studies of oxygen reduction on graphitic carbons
Most in situ spectro-electrochemical studies have been conducted using gold electrodes.51 However, few studies have utilised in operando spectroscopic techniques to probe more practical Li–O2 cell cathode materials, such as various carbon interfaces and structures. Cyclic voltammograms on basal plane pyrolytic graphite (BPPG) and edge plane pyrolytic graphite (EPPG), in a 0.5 M LiClO4/DMSO electrolyte, display different activities in both the reduction and oxidation sweeps (Fig. 10).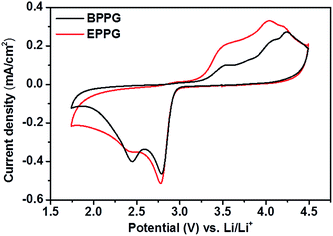 | ||
| Fig. 10 Cyclic voltammograms of 0.5 M LiClO4/DMSO on basal plane pyrolytic graphite (black) and edge plane pyrolytic graphite (red). The sweep rate was 100 mV s−1. | ||
Concentrating on oxygen reduction, BPPG has two distinct peaks in the CV cathodic sweep, the first one at 2.68 V, followed by a second peak at 2.35 V. Comparatively, EPPG has a similar peak with greater intensity relative to the basal plane at 2.67 V. A broad shoulder at 2.32 V accompanies the peak at 2.67 V for EPPG. The reduction peaks at ca. 2.7 V and ca. 2.3 V have been previously associated with the initial electrochemical reduction of dissolved oxygen to superoxide (O2−) which then leads to the formation of lithium peroxide via chemical or electrochemical means via surface or solution processes (eqn (5)–(8)).51–53
The difference in peak intensities between the two graphites could be due to the increased activity associated with the edge plane surface (from the surface oxygen groups), compared to the basal plane.54 Belova et al. reported that the electrochemical formation of Li2O2 occurs on a nearly ideal basal plane.55
| O2 + e− → O2(ads)− | (5) |
| Li+ + O2(ads)− ⇆ LiO2(ads) ⇆ [Li+–O2−](sol) | (6) |
| [Li+–O2−](sol) + [Li+–O2−](sol) → Li2O2(s) + O2 | (7) |
| LiO2(ads) + e− + Li+ → Li2O2(s) | (8) |
In the anodic scan three peaks were observed for both graphitic electrodes at 3.43, 3.90 and 4.14 V. These peaks are associated with the partial oxidation of Li2O2 at 3.43 V, with the surface being completely oxidised at 4.14 V as observed by Liu and Ye.53 The peak at 3.9 V could be associated with the oxidation of superoxide formed in solution as the peroxide is oxidised from the electrode surface.52
The intensities of these peaks are noticeably larger for the edge plane surface; this could again be linked with the increased activity of the EPPG surface due to the larger active surface area as demonstrated by the roughness calculations conducted above (Fig. 6).
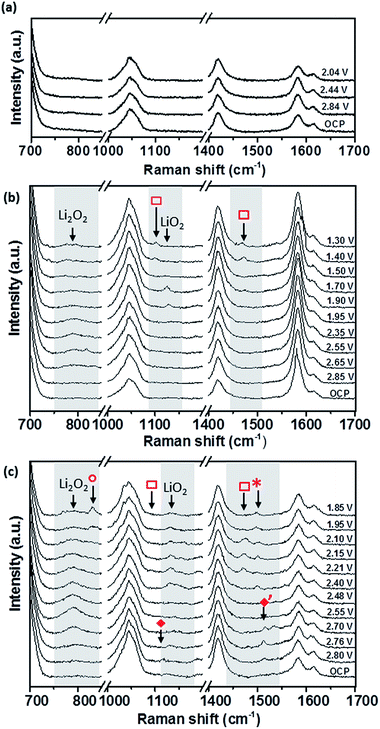
SHINERS can be used to ascertain the species involved during the oxygen reduction processes taking place on the different graphitic surfaces within a non-aqueous electrolyte in the presence of Li+. Initial studies without SHINERS of 0.5 M LiClO4/DMSO on EPPG demonstrated that without any surface enhancement only solvent and carbon peaks can be observed in the Raman spectra, and little change can be observed upon changing the potential (Fig. 11a).
SHINERS measurements were conducted on both the edge and basal plane graphite electrodes in a 0.5 M LiClO4/DMSO electrolyte (Fig. 11). The Raman spectrum at the OCV (3.04 V) on BPPG (Fig. 11b) shows only peaks associated with the electrolyte and graphitic D and G bands.56 As the potential is reduced below 2.85 V, the formation of Li2O2 (band at 787 cm−1) is observed on the electrode surface. This is the main reduction product which agrees with previous data in the literature on porous carbons.57 At lower reduction potentials a band at 1130 cm−1 is observed; this has been assigned as LiO2. The observation of LiO2 at reduction potentials below 2 V has not been previously reported and its detection is counterintuitive considering the detected formation of Li2O2 at higher potentials. The observation of LiO2 at potentials below 2 V may result from the saturation of [Li+–O2−](sol) at the electrode interface, and so a surface mechanism is favoured, whereby [Li+–O2−](ads) remains adsorbed at the carbon surface rather than going into solution.
Reducing the potential below 1.70 V, the LiO2 band is no longer present, demonstrating its kinetic and thermodynamic instability with its conversion to Li2O2 either via a solution disproportionation or via a second electron reduction (eqn (7) and (8)).
At reduction potentials below 1.5 V, Raman bands at 1101 and 1470 cm−1 ( ) are observed. These have been tentatively assigned to the formation of Li2CO3. The appearance of the bands coincides with a decrease in intensity for lithium peroxide on the electrode surface, as well as a colour change from colourless to cloudy black in the electrolyte. Li2CO3 is not readily reported as a side product in DMSO based electrolytes and so it is likely to arise from reaction of the carbon surface with reduced oxygen species.58 The degradation of the carbon electrode surface via reaction with reduced oxygen species leads to its breakup and fragmentation, as well as Li2CO3 formation. These findings highlight the significant challenges for the use of carbon based electrodes as cathodes within Li–O2 cells due to the carbon surface’s instability with reduced oxygen species.
Similarly to BPPG, EPPG has Li2O2 as the main reduction product (Fig. 11c) with a strong broad band at 787 cm−1, with a FWHM of 21.5 cm−1, appearing below 2.76 V. The band intensity grows until ca. 2.5 V, while at lower potentials it is observed to decrease in intensity. This could be due to some of the Li2O2 precipitate (SEM data from the literature typically show particle sizes of 50–100 nm)59 moving away from the electrode (the electrode configuration could mean that Li2O2 could move away due to gravity). Alternatively, the growth of Li2O2 has inhibited the SHINERS effect due to blocking or forced separation of the SHIN particles on the surface, thus decreasing the average enhancement from the overall laser spot.
Formation of Li2O2 is expected due to the highly solvating nature of the electrolyte solvent DMSO due to its high donor number of 29.8, leading to a solution based mechanism. However, on EPPG, superoxide (O2−) is detected at 2.80 V. The O2− band at 1108 cm−1 ( ) is accompanied by a band at 1530 cm−1 (
 ), which has previously been assigned to the deformation of the carbon ring stretching mode, due to its interaction with the superoxide.10 When the potential is decreased below 2.4 V a band at 1130 cm−1 begins to grow due to the presence of LiO2. This band remains visible down to 1.85 V. At lower reduction potentials a band at 1505 cm−1 (
 ) appears which could be linked to the ring stretching mode associated with absorbed LiO2 interacting with the carbon surface.60 At a lower potential of 2.4 V, the Li2CO3 band at 1476 cm−1 (
 ) is observed, representing the beginning of the degradation of the EPPG electrode interface. The accompanying band at 1101 cm−1 is not as clearly visible above the signal noise for all the spectra, but can just be seen for the spectrum at 2.21 V. Compared to BPPG, the onset of degradation for EPPG occurs at a more positive potential (2.4 V vs. 1.5 V); this appears to be related to the potential at which LiO2 is observed on the electrode surface. The variance in the potential of LiO2 formation is likely a result of the increased surface area of the edge plane surface, thus increasing the reactivity at the surface, due to the edge groups.57 At potentials below 2.0 V a band at 835 cm−1 is formed (
 ); this has been tentatively assigned to LiOOH,61 which may form as a result of reactions with R–OH functional groups on the carbon surface.
Overall, for the two graphitic carbons it can be suggested that a partial surface/solution mechanism is taking place, with both having Li2O2 as the dominant reduction product, but with LiO2 forming as an intermediate (eqn (6)). This interaction occurs predominantly on the edge plane surface, which stabilises the superoxide before chemical reaction to LiO2, which is then solvated by DMSO and undergoes a disproportionation reaction to form Li2O2. At low reduction potentials it is also apparent that the formation of LiO2 on the electrode surface starts to cause electrode degradation as confirmed by the peaks at 1101 cm−1 and 1476 cm−1, which are pronounced on the edge plane surface, due to the presence of surface groups at the carbon edge.
3.5 In situ electrochemical SHINERS studies of oxygen reduction on a composite carbon black electrode
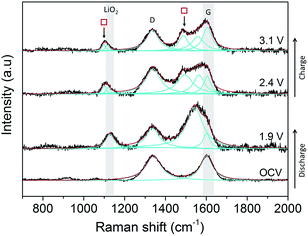
Initial studies on a composite carbon black electrode (SuperC (IMERYS)/PTFE) in a 0.5 M LiClO4/DMSO electrolyte demonstrated that SHINERS can be used to track reaction intermediates and products at the carbon surface (Fig. 12) of more practical electrodes. After discharge from the OCV (3.3 V) down to 1.9 V a peak at 1130 cm−1 is observed, which has been assigned as LiO2.60 A significant broad peak centred at 1543 cm−1 appears adjacent to the G band (1600 cm−1). This broad band is tentatively assigned as resulting from the collective contributions of the interactions of the LiO2 and oxygen reduction intermediate species formed during discharge with the carbon surface.55,62As the potential is raised to 2.4 and 3.1 V, the intensity of the band at 1130 cm−1 decreases, indicating the disappearance of LiO2, and it shifts to lower wavenumbers (1110 cm−1), which could be related to more dissociated “O2−” surface species. This is accompanied by the appearance of two peaks ( ) at 1098 cm−1 and 1490 cm−1, which are both associated with Li2CO3, and were also observed on the BPPG and EPPG electrodes during discharge, resulting from the reaction of the carbon electrode surface with LiO2.55,62 These results indicate that even at 2.4 V, carbon surface oxidation is occurring in the presence of LiO2, resulting in the growth of a Li2CO3 layer upon the carbon surface. This result highlights, as others have done previously, the drawbacks of the use of carbon materials as the cathodes in Li–O2 cells due to their innate reactivity with reduced oxygen species.55,63
In contrast to the data from BPPG and EPPG, no band from Li2O2 at 787 cm−1 is observed. This may be due to the stability of LiO2 species on carbon surfaces containing larger numbers of defects, as Li2O2 is formed by the disproportionation of LiO2 in solution.55
This initial study on a composite carbon electrode highlights how SHINERS can be effectively used to probe the importance electrode/electrolyte interfaces in battery related studies. Undoubtedly further work needs to be carried out in order to fully characterise the complex oxygen surface chemistry and side reactions upon carbon and other substrates, and this will be subject to further ongoing work.
4. Summary and conclusions
Au–SiO2 core–shell nanoparticles have been synthesised for SHINERS studies on the lithium metal anode and carbon cathode of a Li–O2 cell. The enhancement factor of the nanoparticles has been investigated with a range of metallic, carbon based and semiconducting electrode materials using the organic dyes rhodamine 6G, crystal violet and malachite green. A maximum signal enhancement of 4 × 10⁵ was observed on gold. Planar carbon electrodes, such as EPPG and BPPG, also presented good enhancements of 9 × 10⁴ and 1 × 10⁵, respectively, and more practical carbon black electrodes still displayed useful, though lower, enhancements of 2 × 103.A new approach for performing SHINERS studies on lithium metal has been described. It is possible to still get enhancement from SHIN particles deposited on the Raman cell’s quartz window, which is then in close contact with the substrate, instead of drop casting the particles directly onto the substrate. This method has been used to identify SEI components on metallic lithium cycled in typical Li-ion and Li–O2 battery electrolytes. SHINERS results have shown the ability to track the reduction reaction mechanisms at carbon electrodes. EPPG and BPPG were both observed to produce Li2O2 as the main reduction product. Initial studies on a carbon black composite electrode tracked the oxidation of the electrode surface, with both LiO2 and O2− detected. The degradation of the electrode surface, principally forming Li2CO3, has also been observed on both graphitic and composite carbon substrates.
To summarise, this work has shown that Au–SiO2 core–shell nanoparticles can be used to enhance the Raman signal not only on metallic planar electrodes, but also on non-metallic ones, within certain porosity and roughness ranges. This has been demonstrated in initial SHINERS measurements of both the anode and cathode of the Li–O2 battery, which will lead to the continued investigation of more practical electrodes for other battery systems.
Acknowledgements
Dr Sarah Ball and Dr Mark Copley at Johnson Matthey, and the Engineering and Physical Sciences Research Council (EPSRC) CASE award, are acknowledged. Support from the EPSRC grants EP/J020265/1 and EP/K016954/1 and the European Commission under the Project ‘Stable Interfaces for Rechargeable Batteries’ (SIRBATT) (FP7-ENERGY-2013, grant agreement no. 608502) are gratefully acknowledged. TG and LJH acknowledge Professor Jian-Feng Li and Mr Jin-Chao Dong (Xiamen University) for initial training in the synthesis of SHIN particles. FB acknowledges funding from the Science without Borders Program, Ministério da Educação, Coordenação de Aperfeiçoamento de Pessoal de Nível Superior (CAPES) Brazil and the Nanoinvestigation Centre at Liverpool (NiCaL) for TEM and SEM access.References
- E. Peled, J. Electrochem. Soc., 1979, 126, 2047–2051 CrossRef CAS.
- P. Verma, P. Maire and P. Novák, Electrochim. Acta, 2010, 55, 6332–6341 CrossRef CAS.
- Z. Peng, S. A. Freunberger, Y. Chen and P. G. Bruce, Science, 2012, 337, 563–566 CrossRef CAS PubMed.
- R. Baddour-Hadjean and J.-P. Pereira-Ramos, Chem. Rev., 2010, 110, 1278–1319 CrossRef CAS PubMed.
- L. Cabo-Fernandez, F. Mueller, S. Passerini and L. J. Hardwick, Chem. Commun., 2016, 52, 3970–3973 RSC.
- L. J. Hardwick, M. Holzapfel, P. Novák, L. Dupont and E. Baudrin, Electrochim. Acta, 2007, 52, 5357–5367 CrossRef CAS.
- C. Sole, N. E. Drewett and L. J. Hardwick, Faraday Discuss., 2014, 172, 223–237 RSC.
- I. M. Aldous and L. J. Hardwick, J. Phys. Chem. Lett., 2014, 5, 3924–3930 CrossRef CAS PubMed.
- I. M. Aldous and L. J. Hardwick, Angew. Chem., Int. Ed., 2016, 55, 8254–8257 CrossRef CAS PubMed.
- T. A. Galloway and L. J. Hardwick, J. Phys. Chem. Lett., 2016, 7, 2119–2124 CrossRef CAS PubMed.
- F. S. Gittleson, K. P. C. Yao, D. G. Kwabi, S. Y. Sayed, W.-H. Ryu, Y. Shao-Horn and A. D. Taylor, ChemElectroChem, 2015, 2, 1446–1457 CrossRef CAS.
- E. C. Le Ru and P. G. Etchegoin, Principles of Surface Enhanced Raman Spectroscopy and Related Plasmonic Effects, Elsevier, 2009 Search PubMed.
- S.-Y. Ding, J. Yi, J.-F. Li, B. Ren, D.-Y. Wu, R. Panneerselvam and Z.-Q. Tian, Nat. Rev. Mater., 2016, 1, 1–16 Search PubMed.
- A. Otto, I. Mrozek, H. Grabhorn and W. Akemann, J. Phys.: Condens. Matter, 1992, 4, 1143–1212 CrossRef CAS.
- W. E. Smith, Chem. Soc. Rev., 2008, 37, 955–964 RSC.
- D. Y. Wu, J. F. Li, B. Ren and Z. Q. Tian, Chem. Soc. Rev., 2008, 37, 1025–1041 RSC.
- J.-F. Li, X. D. Tian, S. B. Li, J. R. Anema, Z. L. Yang, Y. Ding, Y. F. Wu, Y. M. Zeng, Q. Z. Chen, B. Ren, Z. L. Wang and Z. Q. Tian, Nat. Protoc., 2013, 8, 52–65 CrossRef CAS PubMed.
- J.-F. Li, Y.-F. Huang, Y. Ding, Z.-L. Yang, S.-B. Li, X. S. Zhou, F. R. Fan, W. Zhang, Z. Y. Zhou, D.-Y. Wu, B. Ren, Z. L. Wang and Z. Q. Tian, Nature, 2010, 464, 392–395 CrossRef CAS PubMed.
- X. D. Tian, B. J. Liu, J. F. Li, Z. L. Yang, B. Ren and Z. Q. Tian, J. Raman Spectrosc., 2013, 44, 994–998 CrossRef CAS.
- C. Y. Li, J. C. Dong, X. Jin, S. Chen, R. Panneerselvam, A. V. Rudnev, Z. L. Yang, J. F. Li, T. Wandlowski and Z. Q. Tian, J. Am. Chem. Soc., 2015, 137, 7648–7651 CrossRef CAS PubMed.
- S. L. Guan, O. Donovan-Sheppard, C. Reece, D. J. Willock, A. J. Wain and G. A. Attard, ACS Catal., 2016, 6, 1822–1832 CrossRef CAS.
- J.-F. Li, Y.-J. Zhang, S.-Y. Ding, R. Panneerselvam and Z.-Q. Tian, Chem. Rev., 2017, 117, 5002–5069 CAS.
- S. Y. Ding, J. Yi, J. F. Li and Z. Q. Tian, Surf. Sci., 2015, 631, 73–80 CrossRef CAS.
- J.-F. Li, Y. J. Zhang, A. V. Rudnev, J. R. Anema, S. B. Li, W. J. Hong, P. Rajapandiyan, J. Lipkowski, T. Wandlowski and Z. Q. Tian, J. Am. Chem. Soc., 2015, 137, 2400–2408 CrossRef CAS PubMed.
- J.-F. Li, S. Y. Ding, Z. L. Yang, M. L. Bai, J. R. Anema, X. Wang, A. Wang, D. Y. Wu, B. Ren, S. M. Hou, T. Wandlowski and Z. Q. Tian, J. Am. Chem. Soc., 2011, 133, 15922–15925 CrossRef CAS PubMed.
- S. Hy, F. Felix, J. Rick, W.-N. Su and B.-J. Hwang, J. Am. Chem. Soc., 2014, 136, 999–1007 CrossRef CAS PubMed.
- G. Frens, Nature (London), Phys. Sci., 1973, 241, 20–22 CrossRef CAS.
- J.-F. Li, A. Rudnev, Y. Fu, N. Bodappa and T. Wandlowski, ACS Nano, 2013, 7, 8940–8952 CrossRef CAS PubMed.
- S. Schlücker, Surface Enhanced Raman Spectroscopy: Analytical, Biophysical and Life Science Applications, Wiley, 2011 Search PubMed.
- S. Chen, X. Li, Y. Zhao, L. Chang and J. Qi, Carbon, 2015, 81, 767–772 CrossRef CAS.
- W. Zhang, J.-C. Dong, C.-Y. Li, S. Chen, C. Zhan, R. Panneerselvam, Z.-L. Yang, J.-F. Li and Y.-L. Zhou, J. Raman Spectrosc., 2015, 46, 1200–1204 CrossRef CAS.
- Y. Zhao, Y. Tian, P. Ma, A. Yu, H. Zhang and Y. Chen, Anal. Methods, 2015, 7, 8116–8122 RSC.
- B. Pettinger, B. Ren, G. Picardi, R. Schuster and G. Ertl, J. Raman Spectrosc., 2005, 36, 541–550 CrossRef CAS.
- L. Jensen and G. C. Schatz, J. Phys. Chem. A Lett., 2006, 110, 5973–5977 CAS.
- C. H. Giles and R. B. McKay, J. Bacteriol., 1965, 89, 390–397 CAS.
- C. O. Laoire, E. J. Plichta, M. A. Hendrickson, S. Mukerjee and K. M. Abraham, Electrochim. Acta, 2009, 54, 6560–6564 CrossRef CAS.
- X.-B. Cheng, R. Zhang, C.-Z. Zhao, F. Wei, J.-G. ZHang and Q. Zhang, Adv. Sci., 2015, 3, 1500213 CrossRef PubMed.
- M. Odziemkowski and D. E. Irish, J. Electrochem. Soc., 1992, 139, 3063–3074 CrossRef CAS.
- M. Odziemkowski and D. E. Irish, J. Electrochem. Soc., 1993, 140, 1546–1555 CrossRef CAS.
- D. Aurbach, J. Power Sources, 2000, 89, 206–218 CrossRef CAS.
- R. Schmitz, R. Müller, S. Krüger, R. W. Schmitz, S. Nowak, S. Passerini, M. Winter and C. Schreiner, J. Power Sources, 2012, 217, 98–101 CrossRef CAS.
- C. Naudin, J. L. Bruneel, M. Chami, B. Desbat, J. Grondin, J. C. Lassegues and L. Servant, J. Power Sources, 2003, 124, 518–525 CrossRef CAS.
- R. Schmitz, R. Ansgar Müller, R. Wilhelm Schmitz, C. Schreiner, M. Kunze, A. Lex-Balducci, S. Passerini and M. Winter, J. Power Sources, 2013, 233, 110–114 CrossRef CAS.
- S. Tang, Y. Gu, J. Yi, Z. Zeng, S. Y. Ding, J. W. Yan, D. Y. Wu, B. Ren, Z. Q. Tian and B. W. Mao, J. Raman Spectrosc., 2016, 47, 1017–1023 CrossRef CAS.
- G. Li, H. Li, Y. Mo, L. Chen and X. Huang, J. Power Sources, 2002, 104, 190–194 CrossRef CAS.
- F. Liu, G. Wang, G. Cheng, M. Han and J. Ma, Solid State Commun., 1996, 99, 369–373 CrossRef CAS.
- H. Li, Y. Mo, N. Pei, X. Xu, X. Huang and L. Chen, J. Phys. Chem. B, 2000, 104, 8477–8480 CrossRef CAS.
- P. G. Bruce, S. A. Freunberger, L. J. Hardwick and J. M. Tarascon, Nat. Mater., 2011, 11, 19–29 CrossRef PubMed.
- J. P. Vivek, N. Berry, G. Papageorgiou, R. J. Nichols and L. J. Hardwick, J. Am. Chem. Soc., 2016, 138, 3745–3751 CrossRef CAS PubMed.
- P. C. Howlett, D. R. MacFarlane and A. F. Hollenkamp, J. Power Sources, 2003, 114, 277–284 CrossRef CAS.
- L. Johnson, C. Li, Z. Liu, Y. Chen, S. A. Freunberger, P. C. Ashok, B. B. Praveen, K. Dholakia, J. M. Tarascon and P. G. Bruce, Nat. Chem., 2014, 6, 1091–1099 CrossRef CAS PubMed.
- Q. Yu and S. Ye, J. Phys. Chem. C, 2015, 119, 12236–12250 CAS.
- C. Liu and S. Ye, J. Phys. Chem. C, 2016, 120, 25246–25255 CAS.
- R. N. Goyal, S. Chatterjee and A. R. S. Rana, Talanta, 2010, 83, 149–155 CrossRef CAS PubMed.
- A. I. Belova, D. G. Kwabi, L. V. Yashina, Y. Shao-Horn and D. M. Itkis, J. Phys. Chem. C, 2017, 121, 1569–1577 CAS.
- L. Bokobza, J.-L. Bruneel and M. Couzi, C, 2015, 1, 77–94 Search PubMed.
- Y. Qiao and S. Ye, J. Phys. Chem. C, 2016, 120, 8033–8047 CAS.
- D. G. Kwabi, T. P. Batcho, C. V. Amanchukwu, N. Ortiz-Vitoriano, P. Hammond, C. V. Thompson and Y. Shao-Horn, J. Phys. Chem. Lett., 2014, 5, 2850–2856 CrossRef CAS PubMed.
- S. Lau and L. A. Archer, Nano Lett., 2015, 15, 5995–6002 CrossRef CAS PubMed.
- D. Zhai, H.-H. Wang, K. C. Lau, J. Gao, P. C. Redfern, F. Kang, B. Li, E. Indacochea, U. Das, H.-H. Sun, H.-J. Sun, K. Amine and L. A. Curtiss, J. Phys. Chem. Lett., 2014, 5, 2705–2710 CrossRef CAS PubMed.
- H. H. Eysel and S. Thym, Z. Anorg. Allg. Chem., 1975, 411, 97–102 CrossRef CAS.
- D. M. Itkis, D. A. Semenenko, E. Y. Kataev, A. I. Belova, V. S. Neudachina, A. P. Sirotina, M. Havecker, D. Teschner, A. Knop-Gericke, P. Dudin, A. Barinov, E. A. Goodilin, Y. Shao-Horn and L. V. Yashina, Nano Lett., 2013, 13, 4697–4701 CrossRef CAS PubMed.
- B. D. McCloskey, A. Speidel, R. Scheffler, D. C. Miller, V. Viswanathan, J. S. Hummelshøj, J. K. Nørskov and A. C. Luntz, J. Phys. Chem. Lett., 2012, 3, 997–1001 CrossRef CAS PubMed.
| This journal is © The Royal Society of Chemistry 2017 |

