 Open Access Article
Phase angle spectroscopy on transparent conducting polymer electrodes for real-time measurement of epithelial barrier integrity†
S.
Löffler
and
A.
Richter-Dahlfors
*
Swedish Medical Nanoscience Center, Department of Neuroscience, Karolinska Institutet, 17177, Stockholm, Sweden. E-mail: Agneta.Richter.Dahlfors@ki.se; Fax: +46 8 342651; Tel: +46 8 524 87425
First published on 27th April 2015
Abstract
To facilitate automated real-time monitoring of the formation or disruption of an epithelial monolayer, phase angle spectroscopy was performed in custom-designed cell culture dishes including a transparent conductive polymer-based 2-electrode device. A peak in φ amplitude at 103–105 Hz specifically correlated to increased capacitance by proliferating cells. Dynamic monitoring of cell density, and barrier integrity during monolayer formation and disruption were investigated in combination with live-cell microscopy.
Advancement of the tissue-engineering field has prompted the development of automated and quantitative cell culture technologies.1–3 Innovative culturing systems require multidimensional, continuous and highly sensitive readouts, while at the same time minimizing the need for human intervention.4 Monitoring cell density and morphology is vital for experimental consistency and for immediate detection of contamination, cell deterioration or cell dedifferentiation in cell cultures.
Automated microscopy and image analysis is a common method for monitoring cells in automated systems.4 Establishing cell density and morphology with high temporal resolution in these systems requires continuous storage of large amounts of data as well as advanced image processing strategies. Additional tools are needed to determine the barrier status and polarisation of a cell monolayer.
A polarized cell monolayer is characterized by the formation of tight junctions, allowing inter-cellular communication while prohibiting uncontrolled diffusion.5 Traditionally, para- and transcellular diffusion is analysed by measuring the transepithelial resistance (TER) using relevant tracer molecules. Yet, since electrodes are placed above the apical and basolateral side of the cell layer, simultaneous live-cell imaging is not possible.6
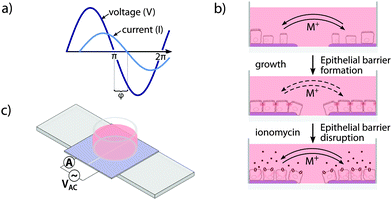
Electrochemical impedance spectroscopy (EIS) represents an advancement of TER. Instead of measuring the DC resistance or the resistance at a single AC frequency, a frequency spectrum of the impedance Z is recorded. The transient response of the system, which is represented by the phase delay Δt of the current response to an AC potential, is measured as phase angle φ (Fig. 1a). To obtain quantitative values for further analysis, EIS data are commonly fitted to equivalent circuit models describing the electrical properties of the underlying circuit. While Z and φ are equally important for characterization of the electrochemical properties of an electrode–electrolyte, electrode–cell, or electrode–tissue interface, most biomedical applications are based on recordings of the impedance Z only.7,8
Here, we introduce the phase angle φ as the primary parameter for monitoring epithelial density and polarity. In the transparent conductive polymer-based 2-electrode phase angel spectroscopy (PAS) device, epithelial monolayer formation and disruption are continuously recorded, allowing for real-time electrochemical sensing combined with optical microscopy of cells (Fig. 1b). The conductive polymer poly(3,4)-ethylenedithioxyphene doped with poly(styrenesulfonate) (PEDOT:PSS) was used as electrode material and cell culture substrate due to its good stability combined with high conductivity and transparency.9,10 Whereas PEDOT:PSS is a well-established material in flexible transparent conductive electrodes, in electroluminescent and novel display applications, and solar cell technology, it has more recently gained attention as excellent material for cell culture and biocompatible implants.9,11–15
Functionalized cell culture dishes (Fig. 1c) were produced by electrodeposition of PEDOT:PSS on indium tin oxide (ITO) coated polyethylene (Sigma-Aldrich). Electrochemical and optical characterization was performed on the ITO base layer and electrodeposited PEDOT:PSS (Fig. S1, ESI†). The PEDOT:PSS films were separated into two equally sized electrodes by introducing a central non-conducting break, then washed in deionized water and blow-dried. Silica glass rings (inner diameter 9 mm, height 9 mm) were centered on the PEDOT:PSS film electrodes, fixed using Sylgard 184 silicone elastomer (Dow Corning) and cured/sterilized at 70 °C over night. The whole device was mounted on a standard microscope slide for compatibility with standard microscope systems.
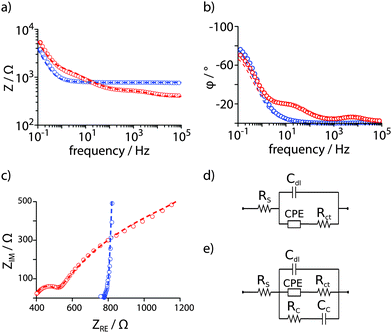
Epithelial Madin-Darby canine kidney (MDCK) cells were seeded (2.5 × 10⁵ cells well−1) into functionalized cell culture dishes, and the PEDOT:PSS electrodes were connected to a potentiostat (Gamry) using crocodile clips and shielded cables with counter = reference electrode. The dishes were placed in an incubator and the potentiostat remained in the room under ambient conditions. A sinusoidal AC potential with 5 mV (rms) was applied between the two electrodes while the current was measured. Z and φ were determined for frequencies between 10−1–103 Hz. The potentiostat was programmed to hourly record one full impedance spectrum for about 60 h. As control, fully supplemented cell culture medium was used and the same measurement regime was followed. EIS data were fitted to established equivalent circuit models (Fig. 2 and Table S1, ESI†).12 To model PEDOT:PSS coated ITO in supplemented cell culture medium, a solution resistance Rs accounts for the electrical resistivity of electrode material and electrolyte. The increased porosity of the PEDOT:PSS is described by a constant phase element (CPE) with a charge transfer resistance Rct. The electrode–electrolyte interface was best described by a double layer capacitance Cdl (Fig. 2d).16,17 To model increased, almost purely capacitive behaviour of the cell monolayer on the electrode surface, an additional RC element with a cell resistance Rc and a cell capacitance Cc was used (Fig. 2e).12 Fits with χ2 < 0.001 were obtained for both cases and a detailed evaluation of equivalent circuit elements is included in the ESI.†
 | ||
Fig. 2 EIS of electrodeposited PEDOT:PSS in the absence (blue) and presence (red) of a confluent layer of MDCK cells in supplemented cell culture medium. (a) Impedance Z and (b) phase angle φ presented in Bode plots. (c) A Nyquist plot shows ZRE and ZIM as polar coordinates, Z(ω) = ZIM![[thin space (1/6-em)]](https://www.rsc.org/images/entities/char_2009.gif) sin sin![[thin space (1/6-em)]](https://www.rsc.org/images/entities/char_2009.gif) φ−1 = ZRE cos φ−1, ω = 2πf. Data were fitted with an equivalent circuit model adapted from Richardson-Burns et al.12 Experimental data = open circles, fitted data = dashed lines. (d) The equivalent circuit used to fit EIS data in supplemented cell culture medium only. (e) The extended equivalent circuit model used to fit EIS data arising from a confluent monolayer of cells on the PEDOT:PSS PAS electrodes. φ−1 = ZRE cos φ−1, ω = 2πf. Data were fitted with an equivalent circuit model adapted from Richardson-Burns et al.12 Experimental data = open circles, fitted data = dashed lines. (d) The equivalent circuit used to fit EIS data in supplemented cell culture medium only. (e) The extended equivalent circuit model used to fit EIS data arising from a confluent monolayer of cells on the PEDOT:PSS PAS electrodes. | ||
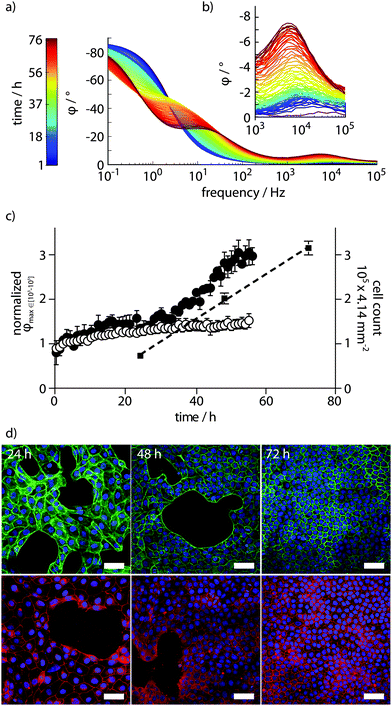
By recording every hour, full PAS spectra were obtained for MDCK cells proliferating on the functionalized cell culture dish during 60 h. Spectra with colour-coded time parameter are shown in Fig. 3a. The full PAS spectra consistently showed a peak in φ amplitude in the frequency range between 103–105 Hz (Fig. 3b). Based on the equivalent circuit model in Fig. 2, we conclude that this peak arises from the growing cell layer, which acts like a capacitive coating on the electrode. This results in increased phase values under high frequency regimes. The increasing cell capacitance arises by cells forming a direct seal at the electrode surface. In control experiments, with PAS performed in dishes with supplemented cell culture medium only, a small increase in φ amplitude was observed in the same frequency range (Fig. S2, ESI†). This was attributed to the swelling of the conducting polymer and adsorption of serum proteins contained in the supplemented cell culture medium to the conducting polymer surface.
Data extraction from spectra obtained from biological systems is difficult due to inherent variability. Here, a simple automated gradient method was sufficient to reliably extract the amplitude of the isolated φ peak at 103–105 Hz. Feeding data obtained from the potentiostat through a data analysis routine, on-line data extraction was performed using the scipy and numpy packages of the python programming language.18 Normalized φ peak amplitudes plotted against time showed increased cell density, allowing the use of this parameter in defining the proliferation of the MDCK cell monolayer (Fig. 3c). Correlation of the PAS read-out to the actual number of cells growing on the electrode surface was performed by end-point experiments at 24, 48, and 72 h. Automated cell counts obtained from microscopy images of cells growing on the electrode surface align very well with data obtained from the PAS sensing, and revealed nearly linear growth under the 72 h experiment (Fig. 3c). Coverage of cells on the electrode surface was analysed by confocal laser scanning microscopy. Staining the actin cytoskeleton of cells by FITC-phalloidin and a nuclear counterstain showed clearly how the epithelial monolayer is formed over time (Fig. 3d, upper panel). Additionally, staining of the tight junction protein ZO-1 demonstrated that indeed, the monolayer adopts a tight, polarized physiological state (Fig. 3d, lower panel).
To analyse whether PAS sensing can be applied for real-time detection of disrupted epithelial integrity, the membrane-permeable ionophore ionomycin was used (Fig. S3, ESI†). Full impedance spectra recorded for 30 min to establish a baseline ensured that the confluent monolayer indeed had formed a tight barrier. Upon addition of ionomycin, continued full spectrum PAS sensing revealed an immediate disruption of the monolayer's barrier function, reaching a low plateau within 10–15 min In contrast, barrier integrity remained intact for at least 60 min in cells exposed to DMSO.
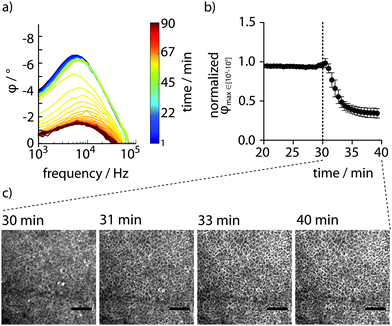
The fast kinetics of ionomycin prompted us to optimize the time resolution of the method. Selective recording of the partial spectra at 103–105 Hz enabled sampling as frequent as every 34 s. At this improved time resolution, the characteristic φ peaks observed in the full spectra were successfully reproduced (Fig. 4a). By applying the automated gradient method and data analysis routine described above, high-resolution data showing the decay of epithelial barrier integrity due to the action of ionomycin was obtained (Fig. 4b). A rapid effect of the ionophore was observed with 50% decreased barrier integrity after only 2.76 ± 0.62 min. Enabled by the integrated design of the PAS device, simultaneous electrochemical sensing and microscopy can be performed. With the device in an incubator positioned on the stage of an inverted phase contrast microscope, live-cell imaging was performed in parallel to PAS sensing. Careful inspection of a time series of images recorded every min after addition of ionomycin showed a barely visible expansion of the intercellular space after circa 10 min (Fig. 4c). Microscopic techniques are thus limited when determining the physiological status of the monolayer. Comparing the time series of images at selected time points with corresponding data achieved by PAS sensing clearly demonstrates the superiority of the transparent, conducting polymer based 2-electrode PAS sensor as it can easily produce highly resolved kinetic data of epithelial barrier function.
Conclusion
We have presented an organic electronic sensing technique, which utilizes the phase angel as the main parameter when determining cell monolayer integrity. This represents a novel advancement in planar sensing devices, which allow cells to be cultivated directly on the electrode surface. In electric cell-substrate impedance sensing devices, electrodes made of gold unfortunately prevent compatibility with light microscopy systems.19,20 Imaging can, however, be achieved using a PEDOT:PSS based organic electrochemical transistor with electronic sensing based on the time constant τ of the drain current transient.13,21–23 In contrast to these microfabrication-dependent technologies, the transparent conducting polymer-based 2-electrode PAS sensor is easy to fabricate, and its adaptability enables easy incorporation into commonly used cell culture equipment. The transparent, 2-electrode sensor determines epithelial integrity with high temporal resolution and precision, while offering straightforward integration with optical methods. The combination of automated electrical and optical sensing of cell density and the barrier function can readily be used as a novel tool in research laboratories, and will eventually aid in the establishment of personalized regenerative medicine on a large scale.Acknowledgements
The project was supported by the Strategic Research Center for Organic Bioelectronics (OBOE, http://www.oboecenter.se) and the Swedish Medical Nanoscience Center (http://www.medicalnanoscience.se) funded by Carl Bennet AB, VINNOVA and Karolinska Institutet.Notes and references
- D. Huh, G. A. Hamilton and D. E. Ingber, Trends Cell Biol., 2011, 21, 745–754 CrossRef CAS PubMed.
- Y. Haraguchi, T. Shimizu, M. Yamato and T. Okano, RSC Adv., 2012, 2, 2184 RSC.
- B. A. Justice, N. A. Badr and R. A. Felder, Drug Discovery Today, 2009, 14, 102–107 CrossRef CAS PubMed.
- M. Kempner, J. Assoc. Lab. Autom., 2002, 7, 56–62 CrossRef.
- J. M. Mullin, N. Agostino, E. Rendon-Huerta and J. J. Thornton, Drug Discovery Today, 2005, 10, 395–408 CrossRef CAS.
- N. Ferrell, R. R. Desai, A. J. Fleischman, S. Roy, H. D. Humes and W. H. Fissell, Biotechnol. Bioeng., 2010, 107, 707–716 CrossRef CAS PubMed.
- K. Benson, S. Cramer and H.-J. Galla, Fluids Barriers CNS, 2013, 10, 5 CrossRef PubMed.
- I. O. K'Owino and O. A. Sadik, Electroanalysis, 2005, 17, 2101–2113 CrossRef.
- F. Louwet, L. Groenendaal, J. Dhaen, J. Manca, J. Van Luppen, E. Verdonck and L. Leenders, Synth. Met., 2003, 135–136, 115–117 CrossRef CAS.
- X. Jia, L. Shen, M. Yao, Y. Liu, W. Yu, W. Guo and S. Ruan, ACS Appl. Mater. Interfaces, 2015, 7, 5367–5372 CAS.
- X. Jia, L. Shen, M. Yao, Y. Liu, W. Yu, W. Guo and S. Ruan, ACS Appl. Mater. Interfaces, 2015, 7, 5367–5372 CAS.
- S. M. Richardson-Burns, J. L. Hendricks, B. Foster, L. K. Povlich, D.-H. Kim and D. C. Martin, Biomaterials, 2007, 28, 1539–1552 CrossRef CAS PubMed.
- M. Ramuz, A. Hama, M. Huerta, J. Rivnay, P. Leleux and R. M. Owens, Adv. Mater., 2014, 26, 7083–7090 CrossRef CAS PubMed.
- K. Svennersten, M. H. Bolin, E. W. H. Jager, M. Berggren and A. Richter-Dahlfors, Biomaterials, 2009, 30, 6257–6264 CrossRef CAS PubMed.
- J. Isaksson, P. Kjäll, D. Nilsson, N. D. Robinson, M. Berggren and A. Richter-Dahlfors, Nat. Mater., 2007, 6, 673–679 CrossRef CAS PubMed.
- X. Jia, L. Shen, Y. Liu, W. Yu, X. Gao, Y. Song, W. Guo, S. Ruan and W. Chen, Synth. Met., 2014, 198, 1–5 CrossRef CAS.
- W. Yu, L. Shen, S. Ruan, F. Meng, J. Wang, E. Zhang and W. Chen, Sol. Energy Mater. Sol. Cells, 2012, 98, 212–215 CrossRef CAS.
- T. E. Oliphant, Comput. Sci. Eng., 2007, 9, 10–20 CrossRef CAS.
- C. M. Lo, C. R. Keese and I. Giaever, Biophys. J., 1995, 69, 2800–2807 CrossRef CAS.
- J. Wegener, C. R. Keese and I. Giaever, Exp. Cell Res., 2000, 259, 158–166 CrossRef CAS PubMed.
- L. H. Jimison, S. A. Tria, D. Khodagholy, M. Gurfinkel, E. Lanzarini, A. Hama, G. G. Malliaras and R. M. Owens, Adv. Mater., 2012, 24, 5919–5923 CrossRef CAS PubMed.
- S. Tria, L. H. Jimison, A. Hama, M. Bongo and R. M. Owens, Biosensors, 2013, 3, 44–57 CrossRef CAS PubMed.
- S. A. Tria, M. Ramuz, M. Huerta, P. Leleux, J. Rivnay, L. H. Jimison, A. Hama, G. G. Malliaras and R. M. Owens, Adv. Healthcare Mater., 2014, 3, 1053–1060 CrossRef CAS PubMed.
Footnote |
| † Electronic supplementary information (ESI) available: Materials and methods, Table S1, Fig. S1–S4. See DOI: 10.1039/c5tb00381d |
| This journal is © The Royal Society of Chemistry 2015 |


