Investigation of silver nanoparticles and plasma protein association using flow field-flow fractionation coupled with inductively coupled plasma mass spectrometry (FlFFF-ICP-MS)†
Panida
Wimuktiwan
,
Juwadee
Shiowatana
and
Atitaya
Siripinyanond
*
Department of Chemistry and Center for Innovation in Chemistry, Faculty of Science, Mahidol University, Rama VI Road, Bangkok 10400, Thailand. E-mail: atitaya.sir@mahidol.ac.th; Fax: +66-2-354-7151; Tel: +66-2-201-5195
First published on 16th October 2014
Abstract
Flow field-flow fractionation (FlFFF) with on-line inductively coupled plasma mass spectrometer (ICP-MS) was employed to investigate the association between protein and silver nanoparticles (AgNPs). In this work, bovine serum albumin (BSA), globulin, and fibrinogen were the model proteins studied. AgNPs were prepared by the reduction of silver nitrate using tannic acid as reducing and stabilizing agent. Various sizes (2.6, 10, and 26 nm) were obtained depending on the pH condition during particle preparation. The apparent association constants between BSA and AgNPs of various sizes were determined. Then, various concentrations of 2.6 nm AgNPs were incubated with plasma proteins, i.e., albumin (2.6 × 10⁻¹ M); globulin (3.1 × 10⁻² M); and fibrinogen (2.9 × 10⁻³ M) at 37 °C for investigation of protein–AgNPs association. Factors influencing protein–AgNPs association were investigated, including the effect of incubation time and effect of AgNPs concentration. Association between protein and AgNPs increased as the incubation time and concentration of AgNPs increased. Further, the binding stoichiometry between BSA and AgNPs was determined to be approximately 1![[thin space (1/6-em)]](https://www.rsc.org/images/entities/char_2009.gif) :
:![[thin space (1/6-em)]](https://www.rsc.org/images/entities/char_2009.gif) 5 × 10⁻⁷.
5 × 10⁻⁷.
Introduction
Many consumer products nowadays are claimed to contain engineered nanoparticles. Owing to its strong antimicrobial activity, silver nanoparticles (AgNPs) have been used in several applications, such as food packing materials, textiles, cosmetics, household items, and wound dressing. However, the wide usage of AgNPs increases the possibility for these nanomaterials to enter into the environment and human body. Human exposure to AgNPs can be from various routes, including ingestion, inhalation, dermal contact, and through therapeutic applications.1,2Researchers have reported different transdermal penetration rates of AgNPs through intact and damaged skin, which are controlled by intrinsic parameters of the skin.3 Upon entering the body, AgNPs rapidly come in contact with biological fluids such as saliva, mucus, lung lining fluid, and plasma protein.4,5 Therefore, the assessment of the interactions between AgNPs and plasma proteins is a very important issue. The majority of the plasma proteins are comprised by albumin (55%), followed by globulin (38%) and fibrinogen (7%). Various analytical techniques have been exploited to examine plasma protein–nanoparticles association in order to gain an insight into the binding between plasma proteins and AgNPs. Those techniques include ultraviolet-visible spectroscopy (UV-vis),6 fluorescence spectroscopy,7 dynamic light scattering (DLS),8 atomic force microscopy (AFM),9 and size exclusion chromatography (SEC).10 In this work, we propose the use of flow field-flow fractionation (FlFFF) on-line with inductively coupled plasma mass spectrometry (ICP-MS) as an alternative technique for investigation of AgNPs–plasma protein association. This hyphenated technique has been successfully applied to examine freshwater oligochaeta exposure to AgNPs,11 study the effects of particle size and the coating on the bioaccumulation and depuration of AgNPs within the gut cavities of aquatic invertebrates,12 investigate the effect of UV irradiation on the stability of AgNPs,13 analyze AgNPs in chicken meat,14 and examine the association of AgNPs with HepG2 cells.15
The aim of this work was to apply a conventional symmetrical flow field-flow fractionation (FlFFF) with on-line, inductively coupled plasma mass spectrometry (ICP-MS) to investigate the association between plasma protein and silver nanoparticles (AgNPs). Plasma proteins studied herein include bovine serum albumin (BSA), globulin, and fibrinogen. The key parameters affecting the association between plasma proteins and AgNPs were examined, including incubation time and concentration of AgNPs. The novel finding from this technique also includes the information on stoichiometric binding between AgNPs and BSA.
Experimental
Instrumentation
A symmetrical FlFFF system (Model PN-1201-FO, Postnova Analytics, Landsberg, Germany) equipped with a 1000 Da molecular weight cut-off regenerated cellulose acetate membrane (Postnova) was used. The geometry of the FlFFF channel is 27.7 cm long, 2.0 cm wide, and 0.0254 cm thick. Sample volume of 20 μL was introduced into FlFFF via the Rheodyne® injector valve. Two high pressure liquid chromatography (HPLC) pumps (Model PN 2101, Postnova Analytics, Germany) were used to regulate the channel flow and the cross flow. In our experiment, channel flow was set at 1 mL min−1, and a cross flow of 2 mL min−1 was used. After fractionation, the effluent was directed through a UV detector (Model Water 2487 Dual λ Absorbance Detector, Waters, Milford, MA, USA), which was set at 280 nm for detection of the plasma proteins. The UV detector outlet was coupled to an ICP-MS instrument (Sciex/Elan 6000, PerkinElmer Instruments, Shelton, CT, USA) using a cross-flow nebulizer with 50 cm poly (tetrafluoroethylene) tubing (PTFE, 0.58 mm id). The eluted fraction from FlFFF was introduced into the ICP-MS sample introduction system for further determination of elements. Both silver isotopes (107Ag and 109Ag) were monitored, and an integration dwell time of 25 ms was set for each isotope. The total number of readings per replicate was chosen such that data were collected for the entire fractograms. To assure no drift of instrument, 20 μg L−1 AgNPs was used to check the stability of the signal after every fifth run. The FlFFF-ICP-MS operating conditions are given in Table 1.| FlFFF: Model PN-1021-FO | |
|---|---|
| Channel flow rate/mL min−1 | 1.0 |
| Cross flow rate/mL min−1 | 2.0 |
| Equilibration time/min | 1.1 |
| Carrier liquid | 30 mM Tris–HNO3 (buffered at pH 9) |
| Membrane | 1 kDa MWCO, poly(regenerated cellulose acetate) |
| ICP-MS: Sciex/Elan 6000 PerkinElmer | |
|---|---|
| RF generator frequency/MHz | 40 |
| RF power/W | 1100–1300 |
| Nebulizer gas flow rate/L min−1 | 0.90–0.95 |
| Coolant gas flow rate/L min−1 | 15.0 |
| Auxiliary gas flow rate/L min−1 | 0.90 |
| Mode | Peak hopping |
| Dwell time/measurement/isotope | 25 |
| Torch | Fassel type |
| Torch injector | Ceramic alumina |
| Spray chamber | Ryton®Scott-type |
| Nebulizer | Gem-tip® cross flow |
| Isotopes monitored | 107Ag, 109Ag |
A UV/visible spectrophotometer (Model V-530, Jasco, Easton, Maryland, USA) was used for acquisition of the UV/visible absorption spectra of the AgNPs, plasma protein, and associated protein–AgNPs.
Chemicals
Bovine serum albumin (BSA) and tannic acid were purchased from Fluka (Buchs, Switzerland). γ-Globulin and fibrinogen were purchased from Sigma-Aldrich (Steinheim, Germany). Silver nitrate, sodium azide and nitric acid (65%) were from Merck (Darmstadt, Germany). Tris (hydroxymethyl aminomethane) and FL-70® detergent (AR 98% assay) were from Fisher Scientific (Leicestershire, UK). Deionized water (18.2 MΩ cm−1) obtained from a water purification system (Barnstead International, Dubuque, IA, USA) was used throughout the experiment. All glassware was washed and soaked overnight in 30% HNO3, and then rinsed again with deionized water before use.Two types of carrier liquid were used in the experiment. A 0.02% (w/v) FL-70 with 0.02% (w/v) sodium azide was used for size characterization of AgNPs. Another carrier liquid was 30 mM Tris (hydroxymethyl aminomethane), buffered at pH 9, which was used in the investigation of AgNPs–plasma protein association.
Silver nanoparticles were prepared by using the method described by Sivaraman et al.16 While stirring, 25 mL of 0.3 mM tannic acid, pH-adjusted with K2CO3, and 5 mL of 3 mM silver nitrate were mixed in a conical flask. Three pH conditions were used, including pH 8, 9, and 10, to prepare AgNPs of various sizes. A brownish yellow solution appeared immediately, indicating the formation of tannic-stabilized AgNPs. Albumin (5.2 × 10⁻¹ M), γ-globulin (6.2 × 10⁻² M), and fibrinogen (5.8 × 10⁻³ M) were prepared in Tris buffer.
Calculation of AgNPs concentration
The concentration of the synthesized AgNPs was calculated by the method described by Mariam et al.7 By assuming that AgNPs are spherical in shape, the number of silver atoms was calculated by considering that the volume ratio of silver atom to AgNPs is 74.1% in the cubic structure. The radius of silver atom is 0.144 nm, and therefore its volume is 0.0125 nm3. For AgNPs with the diameter of d nm, the volume is (π/6)d3 nm3. Thus, the number of silver atoms (N) in each AgNP is equal to , which is calculated to be 31 d3.7 The concentration of the AgNPs was then calculated by taking the ratio of the total number of silver atoms added to the reaction solution (NTotal) and the product of the number of silver atoms present in each nanoparticle (N), the volume of the reaction solution in liters (V), and Avogadro's constant (NA). By assuming that all silver atoms were converted to AgNPs completely, therefore, the concentrations of various AgNPs sizes of 2.6, 10, and 23 nm were calculated to be 9.2 × 10⁻⁷, 1.6 × 10⁻⁸, and 1.3 × 10⁻⁹ M, respectively. Calculations are given in the ESI.†
Observation of incubation time and concentration of AgNPs with plasma proteins
Two parameters influencing protein–nanoparticle association were investigated. These included the effects of incubation time and AgNPs concentration on protein binding. To examine the effect of incubation time, 4.6 × 10⁻⁷ M of 2.6 nm tannic-stabilized AgNPs was incubated with either 2.6 × 10⁻¹ M BSA, 3.1 × 10⁻² M globulin, or 2.9 × 10⁻³ M fibrinogen at 37 °C for 5 min, 2, and 24 h. To examine the effect of AgNPs concentration on their binding with proteins, various concentrations of 2.6 nm tannic-stabilized AgNPs: 9.2 × 10⁻⁸, 2.7 × 10⁻⁷, and 4.6 × 10⁻⁷ M, were incubated with either 2.6 × 10⁻¹ M bovine serum albumin, 3.1 × 10⁻² M globulin, or 2.9 × 10⁻³ M fibrinogen at 37 °C for 24 h. After incubation, the mixture was introduced into FlFFF for characterization. After fractionation, the effluent was directed through a UV detector and sequentially to ICP-MS.Observation of stoichiometric binding between AgNPs and BSA
The stoichiometric binding between AgNPs with BSA was investigated by incubating different concentrations of bovine serum albumin with 9.2 × 10⁻⁸ M of 2.6 nm tannic-stabilized AgNPs at 37 °C for 5 min. To confirm the stoichiometric binding between AgNPs and BSA, various concentrations of tannic-stabilized AgNPs were incubated with 1.5 × 10⁻² M BSA. After incubation, the mixture was introduced into FlFFF-ICP-MS. The mole ratio between AgNPs and BSA was examined by keeping AgNPs and BSA constant, as shown in Tables 2 and 3, respectively.| Concentration of AgNPs (M) | Concentration of BSA (M) |
|---|---|
| 9.2 × 10⁻⁸ | 1.49 × 10⁻² |
| 7.46 × 10⁻² | |
| 1.49 × 10⁻¹ | |
| 1.79 × 10⁻¹ | |
| 2.08 × 10⁻¹ | |
| 2.38 × 10⁻¹ | |
| 2.98 × 10⁻¹ |
| Concentration of BSA (M) | Concentration of AgNPs (M) |
|---|---|
| 1.49 × 10⁻² | 1.84 × 10⁻⁹ |
| 3.68 × 10⁻⁹ | |
| 4.60 × 10⁻⁹ | |
| 5.52 × 10⁻⁹ | |
| 5.98 × 10⁻⁹ | |
| 6.44 × 10⁻⁹ | |
| 7.36 × 10⁻⁹ | |
| 8.28 × 10⁻⁹ | |
| 9.20 × 10⁻⁹ | |
| 1.10 × 10⁻⁸ |
Results and discussion
Characterization of silver nanoparticles
Characterization of the synthesized AgNPs was performed using UV-visible absorption spectrophotometry and FlFFF. With UV-visible absorption spectrophotometry, the blank solution containing tannic acid at the same pH as the tannic-stabilized AgNPs was filled in a reference cuvette for background subtraction. The absorption spectra of AgNPs displayed surface plasmon resonance bands at 400, 410, and 420 nm for tannic-stabilized AgNPs at pH 8, 9, and 10, respectively, as displayed in Fig. 1a. These peaks indicated the formation of AgNPs. With FlFFF, the particle size distributions showed the peaks at 23.0 ± 0.2, 10.0 ± 0.3, and 2.6 ± 0.1 nm for tannic-stabilized AgNPs at pH 9, 10, and 11, respectively, as illustrated in Fig. 1b. The large void peaks observed in the fractograms shown in Fig. 1b were due to the incomplete removal of the negatively charged tannic acid through the negatively charged cellulose acetate membrane during a very short equilibration step (1.1 min, Table 1). The trends of particles sizes obtained from UV-visible absorption spectrophotometry and FlFFF were in good agreement. As can be seen, the smaller particle size of AgNPs exhibited plasmon resonance peaks at a shorter wavelength as compared to the bigger particle. These AgNPs were used in further experiments to observe the association between these particles and proteins.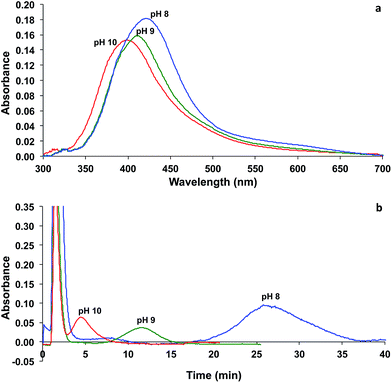 | ||
| Fig. 1 (a) UV-visible absorption spectra and (b) fractograms of tannic-stabilized AgNPs synthesized at pH 8 (blue), 9 (green), 10 (red). | ||
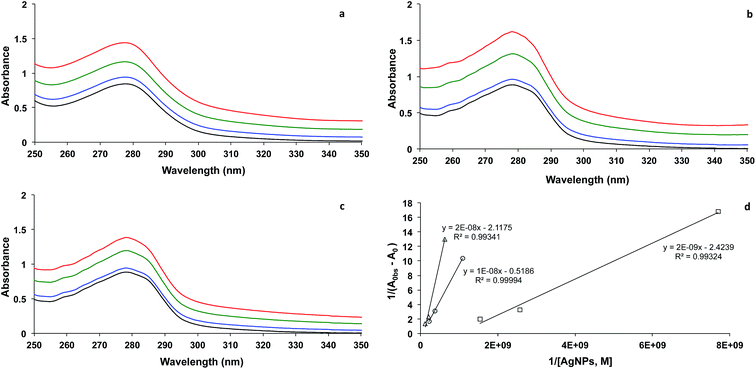
As reported by other investigators,7,17 the complex formation of BSA and AgNPs could be characterized by UV-visible absorption spectrophotometry. The absorption spectrum of BSA displayed a peak maximum at 278 nm (Fig. 2). In the presence of AgNPs as illustrated in Fig. 2a–c for AgNPs of 2.6, 10, and 23 nm size, respectively, the absorbance of BSA at 278 nm increased with increasing AgNPs concentration, suggesting the formation of the ground state complex between BSA and AgNPs.7 The apparent association constant (Kapp) for the complex formation between BSA and AgNPs was then calculated using the method reported by Benesi and Hildebrand,17 as illustrated in Fig. 2d. The slope of the graph represents the reciprocal of Kapp(Ac − A0), and the intercept represents the reciprocal of (Ac − A0), where Ac is the absorbance of the AgNPs–BSA complex, and A0 is the absorbance of BSA. Therefore, the values of Kapp for AgNPs sized 2.6, 10, and 23 nm were calculated to be 5.2 × 10⁷, 8.8 × 10⁷, and 9.8 × 10⁸ L mol−1, respectively. This trend suggests that the bigger the particle size, the higher the value of the apparent association constant. The increase in Kapp value was found to linearly depend on the increase of the particle volume (Kapp ∝ d3).
FlFFF-ICP-MS for observation of protein–AgNPs association
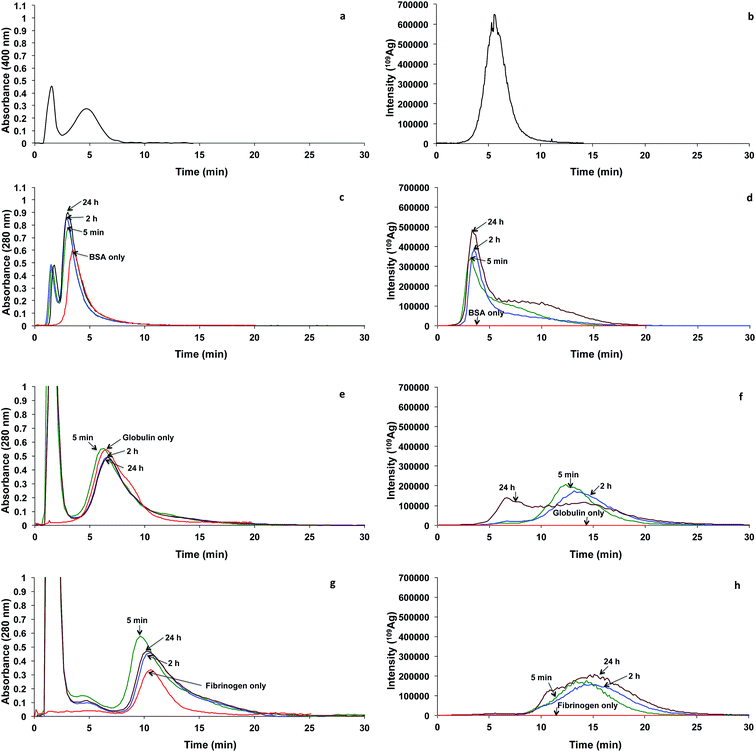
The effects of incubation time and AgNPs concentration on the binding of the protein to AgNPs were examined using FlFFF-ICP-MS. The proteins investigated were BSA, globulin, and fibrinogen. The particle size of AgNPs was 2.6 nm. In order to understand if the binding was due to the binding between the proteins and AgNPs, or with the free dissolved Ag ions that were not converted into AgNPs, the remaining dissolved Ag ions were estimated. The estimation was performed by calculating the amount of Ag detected under the fractogram compared with the amount of Ag from the AgNPs suspension, which was nebulized directly into the ICP-MS without flowing through the FlFFF channel. By taking into consideration that the sample recovery of AgNPs fractionation in the FlFFF channel was approximately 80%, the remaining dissolved Ag ion in the AgNPs was estimated to be approximately 5%. Therefore, the binding behavior discussed hereafter is mainly due to the binding between the protein and AgNPs.As evidenced by Cedervall et al.,18 the nanoparticle–protein corona formation is a complex and time-dependent process, which is governed by thermodynamic and kinetic factors. Under the condition studied herein, the association between BSA and AgNPs or the released Ag ion from the AgNPs occurred within 5 min of incubation time. With longer incubation time at 24 h, a bimodal characteristic was observed with the appearance of the peak at approximately 10 min, implying that AgNPs might grow bigger. The shift to bigger size may be caused by one of three reasons. The first plausible reason is nanoparticle–protein corona formation, yielding a larger particle size. The second plausible reason is the displacement of the tannic acid stabilizing agent by BSA, which is more steric, leading to larger particle size. The displacement of stabilizing agent by BSA might occur through the ligand-exchange or place-exchange reaction as reported by other investigators of AuNPs.22 The third plausible reason is the interaction between tannic acid and BSA, as the association between tannic acid and proteins has been widely known by food scientists to cause astringency perception.23
To demonstrate the effect of incubation time on AgNPs binding with globulin, the fractograms shown in Fig. 3e and f are considered. The fractograms of globulin are illustrated in Fig. 3e (with UV detection at 280 nm) and Fig. 3f (with ICP-MS detection). With UV detection (Fig. 3e, red), the globulin peak appeared at the retention time of 6.2 min with a shoulder at 8.7 min. Clearly, no signal was observed with the ICP-MS detection (Fig. 3f, red). Different incubation times at 5 min, 120 min, and 24 h were given to allow globulin to interact with AgNPs. For the mixture, fractograms with varying incubation times are shown in Fig. 3e (with UV detection at 280 nm) and Fig. 3f (with ICP-MS detection). At incubation times of 5 and 120 min, monomodal distribution was observed at the retention time of 13.2 min. It is interesting to note that the peak at 13.2 min shifted significantly from the peak of individual AgNPs at 5.5 min (Fig. 3b), suggesting the rapid occurrence of binding between AgNPs and globulin. This globulin–AgNPs corona formation resulted in a larger particle size. Alternatively, the peak at 13.2 min might be assigned to the binding between the released Ag ion with the dimeric form of globulin, as the monomeric form of globulin displayed a peak at approximately 6.2 min (Fig. 3e). One might wonder why this dimeric peak was not distinct with the absorbance detection at 280 nm, as shown in Fig. 3e. We believe that the dimeric form was present in a relatively lower concentration than the monomeric form of globulin. Nonetheless, the released Ag ion from AgNPs showed preferential association with the globulin dimer, leading to the more distinct peak of the dimeric form when ICP-MS was used for silver detection. The dimerization of globulin on the AgNPs' surface might be caused by structural perturbation of globulin by the high surface-to-volume ratios of nanoparticles, which resulted in a high concentration of globulin adsorbed at the particle surface of low dimensionality, enhancing the probability of partial unfolding of globulin, as described by Linse et al.24 Nonetheless, bimodal distribution was observed when the incubation time reached 24 h, with peaks at 6.6 and 13.2 min. This suggested that in our experiment, dimerization occurred rapidly within 5 min and was found reversible, as the monomeric peak at 6.6 min retention time was observed at the incubation time of 24 h. Alternatively, the peak at 6.6 min might be due to binding of the released Ag ion from AgNPs with the monomeric fraction.
The effect of incubation time on the binding of AgNPs to fibrinogen was examined, as illustrated in Fig. 3g and h. The fractograms of fibrinogen are illustrated in Fig. 3g (with UV detection at 280 nm) and Fig. 3h (with ICP-MS detection). With UV detection (Fig. 3g, red), the fibrinogen peak appeared at the retention time of 10.3 min. As expected, no signal was observed with the ICP-MS detection (Fig. 3h, red). Fibrinogen was allowed to incubate with AgNPs for various incubation times at 5 min, 120 min, and 24 h. Comparing Fig. 3g and h, the peak positions were not similar, suggesting that AgNPs preferentially associated with the larger molecular weight fibrinogen. Considering Fig. 3h, the binding occurred within 5 min of incubation time, as can be observed from the peak at 14.5 min, which slightly shifted toward a larger size than the pure fibrinogen.
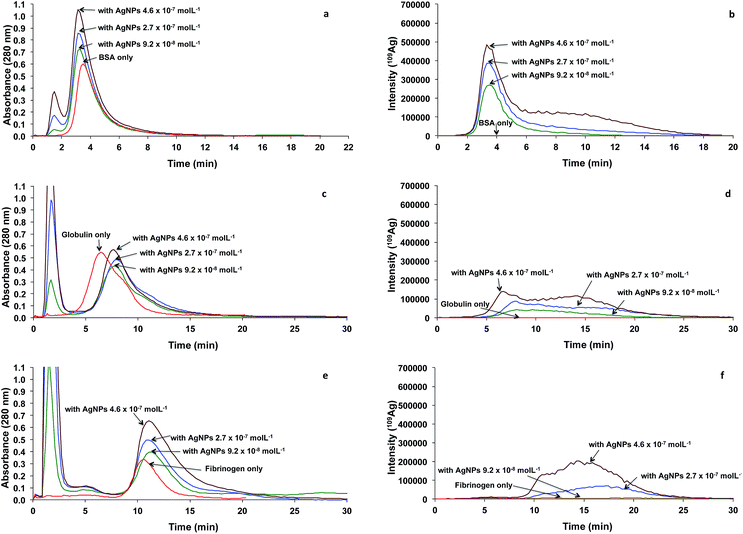
The binding of globulin to AgNPs with various AgNPs concentrations was also examined at a fixed incubation time of 24 h. When concentration of AgNPs was increased, the signal intensity of the fractogram increased. Broad distribution was observed at low globulin concentration. The distribution became bimodal, showing distinct peaks at 6.6 and 13.2 min retention time when the concentration of AgNPs was increased to 4.6 × 10⁻⁷ M. This suggests that the dimerization of globulin induced by AgNPs is concentration-dependent.
The binding of fibrinogen to AgNPs with various AgNPs concentrations is shown in Fig. 4e and f. With AgNPs concentration of 9.2 × 10⁻⁸ M, the Ag signal was quite negligible, suggesting that this concentration might be too low to cause binding with 2.9 × 10⁻³ M fibrinogen (Fig. 4f). However, when the concentration of AgNPs increased to 2.7 × 10⁻⁷ M, a peak was observed at 16.6 min. Formation of nanoparticle–protein corona between AgNPs and fibrinogen is possible as reported by Cedervall et al.18 With increased concentration of AgNPs to 4.6 × 10⁻⁷ M, bimodal characteristic was observed at 10.5 and 14.2 min. The peak at 10.5 min is quite close to the peak of pure fibrinogen, suggesting the possible binding of fibrinogen with the released Ag ion from the AgNPs.
Binding stoichiometry between AgNPs and BSA
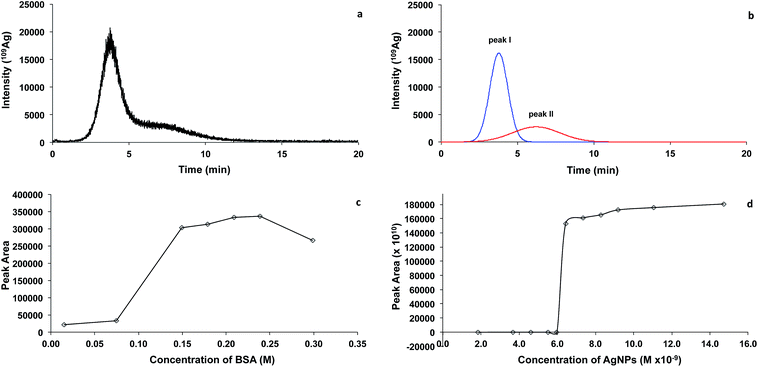
This is the first time that FlFFF-ICP-MS was applied to examine the stoichiometry of the binding of BSA with AgNPs. Various concentrations of BSA were incubated with 9.2 × 10⁻⁸ M AgNPs. In order to differentiate the signal of Ag between that bound to BSA and the Ag in the AgNPs, the fractogram of the mixture between BSA and AgNPs (Fig. 5a) was deconvoluted using PeakFit® (an automated peak separation analysis software). The deconvoluted peaks of the fractogram are illustrated in Fig. 5b, which showed two distinct peaks at 3.6 and 5.9 min. The first peak is related to BSA binding, and the second peak is contributed by AgNPs. The area under the first deconvoluted peak (peak I) of the Ag fractogram was analyzed. Using the mole-ratio method, the peak area under the first deconvoluted peak (peak I) of the Ag fractograms obtained from varying concentrations of BSA was plotted as a function of BSA concentration as illustrated in Fig. 5c. At low BSA concentration, the peak area of the first deconvoluted peak (peak I) of the Ag fractogram was low, and the peak area increased rapidly with increasing BSA concentration from 7.46 × 10⁻² to 1.49 × 10⁻¹ M. After this point, the peak area under the first deconvoluted peak (peak I) of the Ag fractogram became relatively constant with increasing BSA, suggesting that the binding became constant. The stoichiometric binding between BSA and AgNPs was determined at the inflection point—the point where the two straight lines met—which was at the BSA concentration of 1.49 × 10⁻¹ M, implying that the binding ratio between BSA and AgNPs was 1![[thin space (1/6-em)]](https://www.rsc.org/images/entities/char_2009.gif) :
:![[thin space (1/6-em)]](https://www.rsc.org/images/entities/char_2009.gif) 6.2 × 10⁻⁷. This is only a rough estimation, as the increment of the concentration from 7.46 × 10⁻² to 1.49 × 10⁻¹ M was rather unrefined.
6.2 × 10⁻⁷. This is only a rough estimation, as the increment of the concentration from 7.46 × 10⁻² to 1.49 × 10⁻¹ M was rather unrefined.
To confirm the stoichiometric binding between AgNPs and BSA, a similar experiment was performed by varying AgNPs concentrations with fixed BSA concentration at 1.49 × 10⁻² M. For very low concentrations of AgNPs, no Ag signal was observed at the BSA peak. The Ag signal increased significantly until the concentration of AgNPs was 7.4 × 10⁻⁹ M, and then became relatively constant thereafter (Fig. 5d). This suggests that the stoichiometric binding of BSA and AgNPs is 1![[thin space (1/6-em)]](https://www.rsc.org/images/entities/char_2009.gif) :
:![[thin space (1/6-em)]](https://www.rsc.org/images/entities/char_2009.gif) 4.9 × 10⁻⁷. Using the mole ratio method by keeping either AgNPs or BSA constant, the ratio of BSA and AgNPs were found to be approximately 1
4.9 × 10⁻⁷. Using the mole ratio method by keeping either AgNPs or BSA constant, the ratio of BSA and AgNPs were found to be approximately 1![[thin space (1/6-em)]](https://www.rsc.org/images/entities/char_2009.gif) :
:![[thin space (1/6-em)]](https://www.rsc.org/images/entities/char_2009.gif) 5 × 10⁻⁷, suggesting that approximately 2 × 10⁶ molecules of BSA adsorbed on a single AgNP with the size of 2.6 nm.
5 × 10⁻⁷, suggesting that approximately 2 × 10⁶ molecules of BSA adsorbed on a single AgNP with the size of 2.6 nm.
Conclusions
With the use of UV-visible spectrophotometry, complex formation of BSA and AgNPs could be observed, and the apparent association constant (Kapp) could be determined as reported by other investigators.7,17 The novel finding from this study, however, is that the Kapp value was found to linearly depend on the particle volume (Kapp ∝ d3). Furthermore, FlFFF-ICP-MS was demonstrated as an alternative method to monitor the protein–AgNPs association. Plasma proteins (BSA, globulin, and fibrinogen) were investigated for their formation of protein corona with AgNPs. The interaction between BSA and AgNPs was affected by both incubation time and concentration of AgNPs. The binding of plasma protein and AgNPs occurred rapidly within 5 min of incubation time. Additionally, the investigation of the stoichiometric binding between BSA and AgNPs was possible by FlFFF-ICP-MS, showing potential applications of the technique in studying the complexation between other metals and macromolecules.Acknowledgements
We sincerely thank the Office of the Higher Education Commission, Ministry of Education, Thailand through the Center for Innovation in Chemistry: Postgraduate Education and Research Program in Chemistry (PERCH-CIC) for the scholarship given to PW and funding for equipment. Financial supports from the Thailand Research Fund (TRF) and Mahidol University under the National Research Universities Initiative are gratefully acknowledged. Thanks are also due for the useful comments from anonymous reviewers.References
- C.-F. Chau, S.-H. Wu and G.-C. Yen, Trends Food Sci. Technol., 2007, 18, 269–280 CrossRef CAS PubMed
.
- Y. Li, Y. Zhang and B. Yan, Int. J. Mol. Sci., 2014, 15, 3671–3697 CrossRef CAS PubMed
.
- Y. Teow, P. V. Asharani, M. P. Hande and S. Valiyaveettil, Chem. Commun., 2011, 47, 7025–7038 RSC
.
- S. Elodie, D. Julien, R.-L. Fernando and D. Jean-Marie, J. Phys.: Conf. Ser., 2011, 304, 012039 CrossRef
.
- C. Beer, R. Foldbjerg, Y. Hayashi, D. S. Sutherland and H. Autrup, Toxicol. Lett., 2012, 208, 286–292 CrossRef CAS PubMed
.
- L. Li, Q. Mu, B. Zhang and B. Yan, Analyst, 2010, 135, 1519–1530 RSC
.
- J. Mariam, P. M. Dongre and D. C. Kothari, J. Fluoresc., 2011, 21, 2193–2199 CrossRef CAS PubMed
.
- M. A. Dobrovolskaia, A. K. Patri, J. Zheng, J. D. Clogston, N. Ayub, P. Aggarwal, B. W. Neun, J. B. Hall and S. E. McNeil, Nanomedicine, 2009, 5, 106–117 CrossRef CAS PubMed
.
- Z. J. Deng, G. Mortimer, T. Schiller, A. Musumeci, D. Martin and R. F. Minchin, Nanotechnology, 2009, 20, 455101 CrossRef PubMed
.
- I. Lynch and K. A. Dawson, Nano Today, 2008, 3, 40–47 CrossRef CAS
.
- A. R. Poda, A. J. Bednar, A. J. Kennedy, A. Harmon, M. Hull, D. M. Mitrano, J. F. Ranville and J. Steevens, J. Chromatogr. A, 2011, 1218, 4219–4225 CrossRef CAS PubMed
.
- J. G. Coleman, A. J. Kennedy, A. J. Bednar, J. F. Ranville, J. G. Laird, A. R. Harmon, C. A. Hayes, E. P. Gray, C. P. Higgins, G. Lotufo and J. A. Steevens, Environ. Toxicol. Chem., 2013, 32, 2069–2077 CrossRef CAS PubMed
.
- A. R. Poda, A. J. Kennedy, M. F. Cuddy and A. J. Bednar, J. Nanopart. Res., 2013, 15, 1–10 CrossRef
.
- K. Loeschner, J. Navratilova, C. Købler, K. Mølhave, S. Wagner, F. von der Kammer and E. H. Larsen, Anal. Bioanal. Chem., 2013, 405, 8185–8195 CrossRef CAS PubMed
.
- E. Bolea, J. Jimenez-Lamana, F. Laborda, I. Abad-Alvaro, C. Blade, L. Arola and J. R. Castillo, Analyst, 2014, 139, 914–922 RSC
.
- S. K. Sivaraman, I. Elango, S. Kumar and V. Santhanam, Curr. Sci., 2009, 97, 1055–1059 CAS
.
- H. A. Benesi and J. H. Hildebrand, J. Am. Chem. Soc., 1949, 71, 2703–2707 CrossRef CAS
.
- T. Cedervall, I. Lynch, S. Lindman, T. Berggård, E. Thulin, H. Nilsson, K. A. Dawson and S. Linse, Proc. Natl. Acad. Sci. U. S. A., 2007, 104, 2050–2055 CrossRef CAS PubMed
.
- A. L. Capriotti, G. Caracciolo, C. Cavaliere, V. Colapicchioni, S. Piovesana, D. Pozzi and A. Laganà, Chromatographia, 2014, 77, 755–769 CAS
.
- A. Ulrich, S. Losert, N. Bendixen, A. Al-Kattan, H. Hagendorfer, B. Nowack, C. Adlhart, J. Ebert, M. Lattuada and K. Hungerbühler, J. Anal. At. Spectrom., 2012, 27, 1120–1130 RSC
.
- A.-K. Ostermeyer, C. K. Mumuper, L. Semprini and T. Radniecki, Environ. Sci. Technol., 2013, 47, 14403–14410 CrossRef CAS PubMed
.
- R. Sardar, J. W. Park and J. S. Shumaker-Parry, Langmuir, 2007, 23, 11883–11889 CrossRef CAS PubMed
.
- E. Obreque-Slier, C. Mateluna, A. Peña-Neira and R. López-Solís, J. Agric. Food Chem., 2010, 58, 8375–8379 CrossRef CAS PubMed
.
- S. Linse, C. Cabaleiro-Lago, W. F. Xue, I. Lynch, S. Lindman, E. Thulin, S. E. Radford and K. A. Dawson, Proc. Natl. Acad. Sci. U. S. A., 2007, 104, 8691–8696 CrossRef CAS PubMed
.
Footnote |
| † Electronic supplementary information (ESI) available. See DOI: 10.1039/c4ja00225c |
| This journal is © The Royal Society of Chemistry 2015 |

