Use of amine electride chemistry to prepare molybdenum disulfide intercalation compounds
Amila Udayanga Liyanage and
Michael M. Lerner*
Department of Chemistry, Oregon State University, Corvallis, OR 97331-4003, USA. E-mail: michael.lerner@oregonstate.edu; Fax: +1-541-737-2062; Tel: +1-541-737-6747
First published on 17th September 2014
Abstract
Electride solutions, formed by dissolution of Na(m) in ethylenediamine (en), are used to generate MoS2 intercalation compounds. Two new intercalation compounds were obtained, labeled α and β phases, containing both Na and en as intercalate and cointercalate respectively. The intercalation reaction proceeds via formation of a kinetic product, the β phase, and subsequent generation of a stable thermodynamic product, the α phase. The β and α phases have interlayer distances, dIC, of 1.19 and 0.97 nm, respectively, which are ascribed to a perpendicular or parallel orientation of en within the intercalate galleries. Product compositions, morphologies and spectrochemical features are obtained from thermogravimetry, SEM and Raman measurement. Electrochemical reduction of MoS2 in an en-based electrolyte is investigated, but does not show the same intercalation reactions. The chemistry observed is compared with that previously reported for this and other MS2 hosts, and with graphite intercalation.
Introduction
Many transition metal dichalcogenides (MX2) are layered structures consisting of metal cations bound between hexagonal planes of chalcogenide anions.1–3 The MX2 layers can often be chemically4–8 or electrochemically9–11 reduced with concomitant intercalation of cationic guests, including the alkali metals,4–6,8 alkaline earths,7 or other molecular or complex cations.1,10 The electrostatic attraction between the positive intercalates and the negative MX2 layers stabilize these intercalation compounds.1 In order to accommodate the cation guests, the MX2 sheets separate, with the interlayer expansion, Δd, defined as:| Δd = dIC − dh | (1) |
MoS2 is a rather chemically inert semiconductor, and is highly anisotropic, with an electrical resistivity 1000× greater in the direction perpendicular to the sheets. Important applications include use as a solid lubricant in both terrestrial and space environments (where graphite shows poor performance), as a catalyst in hydrodesulfurization and hydrogen evolution reactions, and as a photochemical catalyst in the oxidation of organics. MoS2 holds promise for more efficient solar cells due to its resistance to photodegradation in water and photochemical activity over a wide frequency range.3
Intercalation by alkali metal cations and co-intercalates can change MoS2 from a semiconductor to a metal.3 For example, the band gap decreases and the electrical conductivity increases by formation of Li0.1MoS2·δ(PEO)12 and Li0.1MoS2·δdialkylamine,13 which both act as mixed electronic-ionic conductors. Intercalation chemistry may thereby enable tailored conductivities for specific materials applications. Some alkali metal or alkali earth metal intercalation compounds with MoS2 are superconducting, with transition temperatures typically ∼7° K.7,8
Intercalation of promoter elements like Co or Ni has improved the catalytic activity of γ-Al2O3-supported MoS2 in hydrodesulfurization.3 Enhanced hydrogen evolution catalysis has been reported by use of metallic 1T-MoS2 nanosheets obtained via chemical exfoliation of 2H-MoS2 nanostructures grown directly on graphite.14
MoS2 and its intercalation compounds may also be useful as electrodes in energy storage. Lemmon et al. have reported improved Li cycling stability and a significant increase in reversible capacity for the PEO/MoS2 and PEO/MoS2/graphene composites.15,16 MoS2, MoS2/graphene composites and MoS2 nanosheets have recently been explored for use in Na-ion batteries where cycling performance is highly correlated to the nanostructure.17–19
Several synthetic routes have been used to produce AxMX2 intercalation compounds where A is an alkali metal, including; (1) direct high temperature solid state synthesis by combining either the MX2 host and an alkali metal or combining the A, M and X constituent elements,1,2 (2) reaction of the MX2 host with a reductant solution,4–7 or (3) electrochemical reduction of the MX2 host in a suitable electrolyte.9,11 For some metal redox couples, such as Mo(IV)/Mo(III), the intercalation reaction requires powerful reductants such as an alkali metal dissolved in liquid ammonia.4,5,8 This blue electride solution contains sodium ion complex cations and solvated electrons which are a powerful reductant:20
 | (2) |
Other strong reductants that have been used to form AxMX2 include butyllithium or sodium naphthalide dissolved in suitable organic solvents.1,6 For MX2 hosts with more easily reduced metal cations, intercalation can be accomplished using ammonia,2,21,22 amines1,2,23–26 or aqueous solutions.27
In some cases, solvent (Sol.) cointercalation is observed (Fig. 1), to generate compounds represented as AxMX2·δSol. The driving force for such cointercalation is the retention of some solvation of the alkali metal intercalate.
Alkali metal intercalation of MS2 was first reported in 1959.4 Rüdorff has reported a wide range of AxMX2 intercalation compounds with the hosts including MoS2, MoSe2, WS2, WSe2, ReS2, TiS2, and TiSe2.4,5 Rouxel and coworkers have also extensively studied intercalation of the group 4 transition metal MX2 compounds.2 Whittingham et al. studied the lithium intercalation of MX2s6 and Schöllhorn et al. reported several different syntheses and exchange reactions for MX2 intercalation compounds.1,28
Rüdorff reported formation of Li0.8MoS2·0.8NH3, Na0.6MoS2, K0.6MoS2 and Cs0.5MoS2 compounds with interlayer expansions (Δd, eqn (1)) of 0.335, 0.135, 0.195 and 0.274 nm, respectively.5 Since the ionic radius of Li+ is ≈0.076 nm,29 the much larger expansion of Li0.8MoS2·0.8NH3 indicates the presence of NH3 cointercalate. Schöllhorn and Weiss reported that these intercalation compounds can also absorb water to form hydrated cation complexes with an increase in Δd to 0.29–0.70 nm, depending on the reaction conditions.28
A series of alkali metal and alkaline earth intercalation compounds of MoS2 were synthesized in NH3(l), with the observed Δd values ranging from 0.14 to 0.37 nm.7,8 The same method was utilized to synthesize intercalation compounds for TaS2, with the resulting products NaxTaS2 and KxTaS2 giving Δd of 0.11 and 0.21 nm, respectively.30
LixTiS2, LixMoS2, and LixTaS2 were obtained by reaction of the hosts with butyllithium in hexane, with Δd from 0.025–0.05 nm.6
Some organic and inorganic Lewis bases react to form intercalation compounds with groups 4 and 5 MX2 hosts with Δd ranging from 0.30 nm (for smaller molecules like NH3) to 5.23 nm (for octadecylamine), with compositions reflecting the uptake of 0.1 to 1.0 guests per MX2 unit.2 This interaction between the host and guest has been ascribed either to charge transfer1 or to a redox reaction where the host is reduced and the cationic form of base, solvated by the neutral base, intercalate (i.e. NH4+ and NH3 respectively). Group 6 chalcogenides hosts do not react to form intercalation compounds with organic bases in this manner.1,2
Some MX2 hosts react in strong aqueous base to intercalate hydrated alkali metal cations, e.g. Na0.3TaS2·δH2O.2,27 These complex intercalates undergo facile displacement by subsequent reaction with aqueous salt solutions.28 Alternately, the water cointercalate can be displaced by reaction in polar inorganic or organic solvents.28 The product compositions, including both the contents of intercalate cations and of cointercalates, depend on the degree of reduction, exposure to exchange solutions, and post-reaction processing.
Ethylenediamine (en) and trimethylenediamine (tn) react directly with TiS2, NbS2, and TaS2 to form intercalation compounds with Δd = 0.34–0.41 nm. From the known intercalate dimensions, these gallery dimensions indicate that the amine intercalates must form monolayers with long molecular axes oriented parallel to the host layers.24–26 These products show a range of compositions depending on the host and sample processing conditions, with intercalate to MX2 ratios of 0.17–0.39 for en and 0.15–0.33 for tn. Secondary amines, such as diethylamine, dibutylamine, and dipentylamine react with exfoliated MoS2, generating Li0.1MoS2·δdialkylamine, where δ = 0.11–0.42 and Δd = 0.374–0.445 nm, depending on the dialkylamine cointercalate.13
Our group has previously explored the use of electride solutions to prepare graphite intercalation compounds containing amines or diamine intercalates.31–34 Stage 1 and 2 graphite intercalation compounds (GICs) were reported for syntheses using Li(m) or Na(m) dissolved in liquid en. When the intercalate is the Li(en)+ complex, the intercalate guests show an orientation transition of perpendicular to parallel upon evacuation. With Na(en)+, the complexes show only a parallel orientation.33
Since the reduction of graphite generally occurs at a lower potential than that for MoS2, it is worthwhile to explore electride reactions for the intercalation of dichalcogenide hosts, especially since alkali metal–amine electride systems (other than with ammonia) have not previously been reported. In this work, we describe the first use of electride solutions to form MoS2 intercalation compounds with amines, along with the product structures and compositions obtained. A novel intermediate phase is found, and we propose a mechanism for the reaction. The results obtained are also analyzed in light of recent reports on electrochemical reduction of MoS2.
Experimental
Reagents
Sodium metal (3–12 mm pieces in oil, 99.95%, Alfa Aeser), ethylenediamine (en) (99%, Alfa Aeser), molybdenum disulfide (MoS2) (powder <2 micron, 99%, Aldrich), poly(ethylene-co-propylene-co-5-methylene-2-norbornene) (EPDM) (Aldrich), acetylene black (99.5+%, Alfa Aeser), cyclohexane (ACS grade, Alfa Aeser), sodium hexafluorophosphate (NaPF6) (98%, Aldrich) and acetonitrile (HPLC grade, Fisher Scientific) were used as received.Chemical syntheses
Synthesis and handling of the air-sensitive reagents were performed under an inert atmosphere (N2) using either a drybox or septum-syringe techniques. In a typical reaction, Na metal (50 mg) was stirred overnight in ethylenediamine (3.0 mL) at 60 °C under an inert (N2) atmosphere to form a blue-colored electride solution. MoS2 (100 mg) was then added to the electride solution, and the reaction vigorously stirring at 60 °C for 48 h. Samples were centrifuged for 10 min and the solution phase was extracted by syringe. The solid products were placed under vacuum for 12 h at 60 °C.As specified below, the above reaction conditions (time, temperature, reagent amounts and chemical addition sequence) were varied for some experiments. Products obtained are labeled with reaction temperature and time. For example, the sample obtained by reaction at 60 °C for 24 h has been labeled “S-60C-24h”.
Electrochemical syntheses
Galvanostatic reduction was performed in a 2-compartment cell with a fritted glass separator maintained under an inert (N2) atmosphere at ambient temperature. Working electrodes were prepared by painting SS mesh (geometric area ∼1 cm2) with a cyclohexane slurry containing MoS2 powder (80 mass pct.), acetylene black (15 mass pct.), and EPDM binder (5 mass pct.). The dried electrode mass was 18–20 mg. Counter and reference electrodes were SS mesh and SS wire. The electrolyte solution was 0.1 M NaPF6 in ethylenediamine. Working electrodes were reduced at a constant current of 0.10 mA for 16–48 h, then immediately removed from the cell, rinsed briefly with 3–4 mL of acetonitrile, and dried overnight under vacuum at ambient temperature.Analyses
Powder X-ray diffraction (XRD) data from 3–20° 2θ were collected on a Rigaku MiniFlex II diffractometer, using Ni-filtered Cu Kα radiation, at a scan rate of 3° min−1 and step size of 0.02°. Diffraction peak areas were obtained using MDI JADE 9.0 XRD analysis software. Thermogravimetric (TGA) analyses were performed using a Shimadzu TGA-50 analyzer under flowing Ar gas (20 mL min−1) from ambient to 400 °C at a heating rate of 10 °C min−1 and under air from ambient to 900 °C at a heating rate of 10 °C min−1. Scanning electron micrographs (SEM) were obtained using an FEI Quanta 600F scanning electron microscope equipped with a field emission gun and operated at 10 kV. Raman spectra were obtained from 60–4000 cm−1 using a Witec Alpha 300 confocal Raman microscope with 514 nm laser source.The van der Waals volume of en, Ven = 0.0651 nm3 was calculated based on Bondi radii using a method termed “Atomic and Bond Contributions of van der Waals volume” (VABC).35 Volume of Na+, VNa = 0.00445 nm3 was calculated using the ionic radius of Na+ (0.102 nm).29 Packing fractions for MoS2 intercalation compounds were calculated36,37 as:
 | (3) |
![[thin space (1/6-em)]](https://www.rsc.org/images/entities/char_2009.gif) :
:![[thin space (1/6-em)]](https://www.rsc.org/images/entities/char_2009.gif) MoS2 and en
MoS2 and en![[thin space (1/6-em)]](https://www.rsc.org/images/entities/char_2009.gif) :
:![[thin space (1/6-em)]](https://www.rsc.org/images/entities/char_2009.gif) MoS2 respectively, and a = 0.3160 nm.1,2
MoS2 respectively, and a = 0.3160 nm.1,2
Energy optimization of the gas-phase en molecule was performed using the DFT B3LYP method with a 6-31G+(d,p) basis set and Gaussian 09W software.
Results and discussion
The powder XRD patterns obtained from reactions of MoS2 with a sodium electride solution (Fig. 2 and 3) shows host expansion to form new intercalation compounds. In Fig. 2 (S-60C-48h), a single new phase is evident with interlayer distance, dIC = 0.97 nm. The expansion relative to the host MoS2 sheet thickness (d002 = 0.615 nm)3 is Δd = 0.35 nm. Hereafter this new phase is labeled the α phase.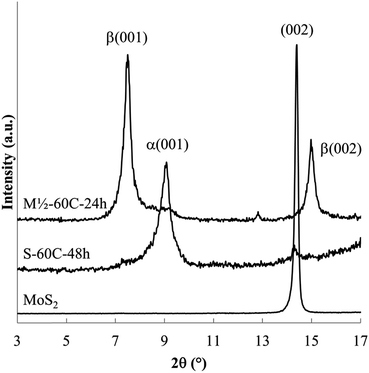 | ||
| Fig. 2 Powder XRD of MoS2 and the intercalation compounds obtained after 48 h reaction at 60 °C (S-60C-48h) and after 24 h reaction at 60 °C using decreased Na mass (M1/2-60C-24h). | ||
 | ||
| Fig. 3 Powder XRD of MoS2 and the intercalation compounds obtained after 24 h at reaction temperatures ambient to 100 °C. | ||
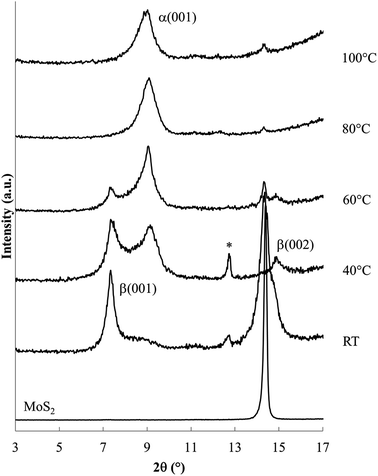
Fig. 3 shows XRD patterns obtained after 24 h reaction at ambient to 100 °C. Ambient temperature reaction produces a different new phase (with d = 1.19 nm, Δd = 0.57 nm), labelled the β phase, along with the unreacted host. Reaction products at 40 and 60 °C contain both the α and β phases along with unreacted MoS2. Higher temperature reactions, at 80 °C and 100 °C, produce mainly the α phase, with a very small residual of unreacted MoS2.
Lower temperature reactions show an additional diffraction peak (tagged with an *) near d = 0.69 nm, attributed to NaxMoS2, i.e. the intercalation product without the en cointercalate. This phase has previously been reported, with d = 0.75 nm (ref. 28) or d = 0.71 nm.38 The small interlayer expansion observed for this phase (Δd ≈ 0.1 nm) eliminates the possibility of en contained in that product.
Summarizing the changes observed with varied reaction temperature, (i) lower temperature reactions result in a relatively large amount of unreacted host (an incomplete reaction), and are relatively rich in the β phase, and (ii) higher temperatures generate nearly complete reactions to form mainly the α phase.
The incomplete reactions observed at lower temperature could arise from the slow kinetics of amine electride (reactant) formation, resulting in a low reductant concentration, or alternately they may be related to a slower rate of diffusion of the Na(en)x+ complex intercalate into the intercalation compound galleries.
In other experiments aimed at decreasing the electride reactant concentration, reactions for 48 h reaction at 60 °C were run using 1/2 the mass of Na or 5× the standard volume of en. Both changes results in products containing both the α and β phases and unreacted MoS2. The association of β phase and incomplete reactions again provides some evidence that the β phase is a kinetic product. In one experiment using the decreased Na mass, the product obtained after 24 h reaction at 60 °C contained only the β phase (Fig. 2. M1/2-60C-24h).
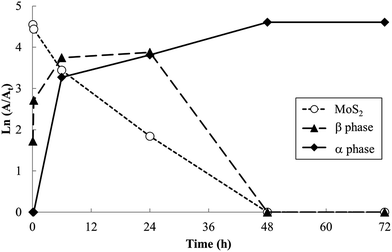
Products obtained at 60 °C with varied reaction times are shown in Fig. 4. Shorter reaction times produce the β phase along with unreacted MoS2; the α phase is first evident after reaction for 1 h. At longer reaction times, the β phase and MoS2 are no longer observed. These data confirm that the β phase is formed more rapidly as a kinetic product, but ultimately disappears as the more stable α phase forms.
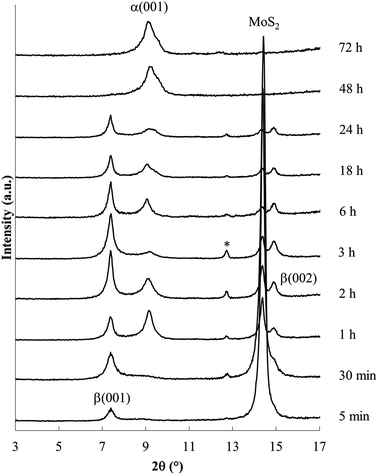 | ||
| Fig. 4 Powder XRD data obtained for reaction of MoS2 with Na/en electride solution at 60 °C. Reaction times are indicated at the right. | ||
Relative PXRD peak areas (A/At) were obtained by dividing the raw area of individual peak (A) by the total area of all observed peaks (At = ΣA), to normalize relative peak areas and more closely represent the volume fraction of the associated phases. Analysis of relative PXRD peak areas (A/At), shown in Fig. 5, shows clearly the intermittent appearance of the β phase during the 60 °C reaction.
Although lower electride concentrations, lower reaction temperatures and shorter reaction times are seen to favor formation of the β phase, this phase was difficult to obtain as a single-phase product. This indicates that the rates of conversion of MoS2 to β phase, and β to α phase, i.e. rates k1 and k2 in Fig. 6, were comparable under the range of reaction conditions studied.
 | ||
| Fig. 6 Proposed reaction mechanism; MoS2 forms a metastable β phase, which converts to the more stable α phase. | ||
We propose that the β phase appears due to the more rapid diffusion of the Na(en)x+ complex with a perpendicular orientation within intercalate galleries. Thermodynamic stabilities of these products depend on several factors, such as electrostatic and solvation enthalpies. Smaller galleries, as observed for the α phase, should generally have a more favorable lattice enthalpy, since E ∝ −1/d.
The α and β phases obtained are both ascribed to the cointercalation of en with Na+ to form an intercalate monolayer. The α phase expansion (Δd = 0.35 nm) corresponds to an en orientation with long axis parallel to host sheets, and the β phase expansion (Δd = 0.57 nm) to a perpendicular en orientation. Optimized molecular dimensions obtained by Gaussian (Fig. 7) correlate well with the observed gallery dimensions. Amine intercalates have been previously reported with Δd = 0.37–0.40 nm for MS2 hosts13,26 but we are not aware of any reports on the observed β phase for any MX2 intercalation products. Graphite intercalation compounds (GICs) containing en show both types of expansion, with the perpendicular orientation of Δd = ∼0.5 nm for LiCx·δen and a reported transition to parallel orientation observed upon evacuation of the product.33 That work also reported the formation of a GIC with composition NaC15·1.0en with Δd = 0.36 nm, indicating a parallel en orientation.33
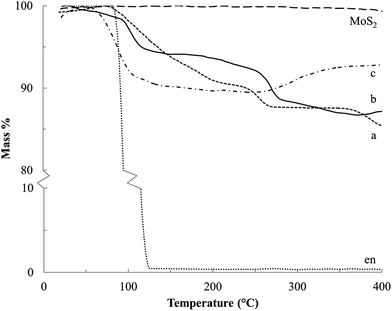
An alternate explanation for the appearance of α and β phases could be the formation of en monolayers and bilayers, respectively, as occurs in the hydration of AxMS2.39 However, thermogravimetric data (vide infra) show that the obtained phases have similar en content, which does not support this model. Additionally, the observed dIC for the α phase is 1.19 nm, which is significantly less than the 1.32 nm calculated to accommodate two en layers.
Thermograms for the Na–en–MoS2 intercalation compounds under Ar flow (Fig. 8a and b) show two mass loss events at 100–200 °C and 225–275 °C, which are attributed to volatilization (b.p. of en = 116 °C) and decomposition of the en cointercalate. Under air flow, a mass increase above 275 °C can be attributed to the formation of Na2O (Fig. 8c). From the mass loss and uptake, the composition for S-60C-48h (α-phase) and S-60C-3h (β-phase predominant) are found to be Na0.3MoS2·0.4en and Na0.2MoS2·0.3en, respectively. Other studies of MS2 (M = Ti, Ta and Nb) also give maximum en![[thin space (1/6-em)]](https://www.rsc.org/images/entities/char_2009.gif) :
:![[thin space (1/6-em)]](https://www.rsc.org/images/entities/char_2009.gif) MS2 ratios in the 0.3–0.4 range.24–26
MS2 ratios in the 0.3–0.4 range.24–26
Where all graphene sheets are separated by intercalate galleries (i.e. in the stage 1 products), GIC have an en mass of 20–22%.33 In comparison, the structurally-analogous MoS2 intercalation compounds show en contents of ∼12%. Calculated packing fractions (Table 1) correcting for the different host sheet surface areas and formula masses, indicate much denser intercalate packing for both α and β phases in MoS2 than for the corresponding orientations in GICs. In part, this reflects a higher en![[thin space (1/6-em)]](https://www.rsc.org/images/entities/char_2009.gif) :
:![[thin space (1/6-em)]](https://www.rsc.org/images/entities/char_2009.gif) Na ratios in MoS2 intercalation compounds (1.3–1.5 in MoS2 compounds vs. 0.6–1.0 in stage 1 GICs33). Also, the packing fraction of β phases is lower due to the greater gallery expansion.
Na ratios in MoS2 intercalation compounds (1.3–1.5 in MoS2 compounds vs. 0.6–1.0 in stage 1 GICs33). Also, the packing fraction of β phases is lower due to the greater gallery expansion.
| Composition | Stage | Phase | Packing fraction | Reference |
|---|---|---|---|---|
| LiC15·0.8en | 1 | α | 0.40 | 33 |
| LiC26·0.7en | 2 | β | 0.28 | ” |
| NaC15·1.0en | 1 | α | 0.51 | ” |
| NaC25·0.6en | 2 | α | 0.40 | ” |
| Na0.3MoS2·0.4en | 1 | α | 0.88 | This work |
| Na0.2MoS2·0.3en | 1 | β | 0.43 | ” |
Less dense packing in the β-phase may facilitate Na(en)x+ complex diffusion, allowing more rapid formation of this phase. It may also be that the very high packing density in the α-phase MoS2 compound prohibits reduction to the extent observed where no en cointercalate is present (such as in Na0.6MoS2).4,5
The calculated sheet charge densities for NaC15·1.0en, Na0.3MoS2·0.4en and Na0.2MoS2·0.3en are 2.5, 3.5, and 2.3 e− per nm2, respectively. Again, we can propose that lower charge densities may allow for more rapid diffusion, but result in a less thermodynamically stable product.
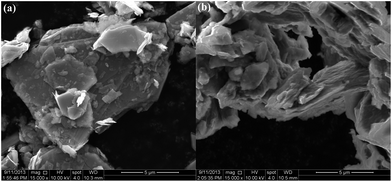
SEM images (Fig. 9) show that a layered microstructure is retained in all samples, with the reaction products displaying a somewhat delaminated appearance as compared to the starting MoS2.
Raman spectra of MoS2 and a representative Na–en–MoS2 intercalation compound are shown in Fig. 10. MoS2 displays prominent sharp absorbance peaks at 390 cm−1 (E12g mode) and 418 cm−1 (A2g mode) as has been reported previously.40,41 After intercalation, the spectrum background increases significantly, the two sharp peaks broaden and shift slightly to lower frequency, and two new strong broad peaks appear at ≈1350 and ≈1600 cm−1. Very similar changes were previously observed following Li intercalation into MoS2, with the new high frequency peaks ascribed to a disordered state arising from intercalate arrangement.41 In the present case, en has molecular absorbances in this region, however, these should be relatively sharp and the other strong en absorbances expected at 3300 (ν(NH2)), 2900 (ν(CH2)) and 2850 (ν(CH2)) cm−1 were not detected.42 Therefore the high frequency broad bands present in the intercalation compound samples more likely arise from a transition associated with disorder within the intercalate galleries.
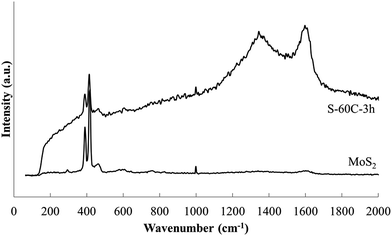 | ||
| Fig. 10 Raman spectra of MoS2 and Na–en–MoS2 intercalation compound (S-60C-3h) indicates the structural change upon intercalation. | ||
In contrast to the chemical syntheses, galvanostatic reduction of MoS2 in en/NaPF6 did not generate predominant intercalation products. A very weak XRD peak associated with the α phase is observed, but the principal change is a weakening and broadening of the MoS2 host diffraction peaks (Fig. 11 and 12).
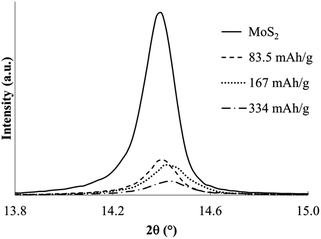 | ||
| Fig. 11 Powder XRD profiles for MoS2 and products of electrochemical reduction in en/NaPF6 with applied charges indicated. | ||
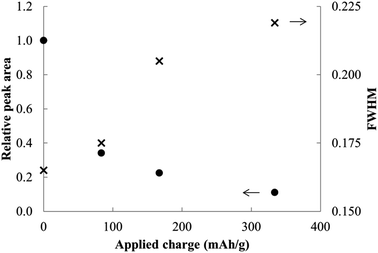 | ||
| Fig. 12 Relative peak areas and widths for MoS2 and reduction products at different applied charges. | ||
Lemmon et al. reported that reduction of MoS2 in a 7![[thin space (1/6-em)]](https://www.rsc.org/images/entities/char_2009.gif) :
:![[thin space (1/6-em)]](https://www.rsc.org/images/entities/char_2009.gif) 3 vv ethylene methyl carbonate
3 vv ethylene methyl carbonate![[thin space (1/6-em)]](https://www.rsc.org/images/entities/char_2009.gif) :
:![[thin space (1/6-em)]](https://www.rsc.org/images/entities/char_2009.gif) ethylene carbonate electrolyte with LiPF6 resulted in formation of Li2S and an amorphous form of Mo or LixMo.15,16 The analogous reduction for Na reaction is in eqn (4):
ethylene carbonate electrolyte with LiPF6 resulted in formation of Li2S and an amorphous form of Mo or LixMo.15,16 The analogous reduction for Na reaction is in eqn (4):
| MoS2 + (4 + x)Na+ + (4 + x)e− → 2Na2S + NaxMo | (4) |
Theoretically the capacity required for the above reduction is ≈840 mA h g−1 (if x = 1); each 1e− reduction translates to 167 mA h g−1. After applying from half to twice the latter charge, almost no intercalation products were evident. As can be seen, the ordered layered structure is destroyed even at much lower applied charges, suggesting an entirely different and non-intercalative mechanism for this electrochemical reduction.
Conclusions
MoS2 reacts with electride solutions with amine to form intercalation compounds of composition Na0.2–0.3MoS2·0.3–0.4en. A metastable product, identified as the β phase, shows a perpendicular en orientation with interlayer expansion of 0.57 nm, and the thermodynamic product, or α phase, shows a parallel orientation and interlayer expansion of 0.35 nm. Shorter reaction time, dilution and lower temperatures favor formation of the β phase. The intercalation products are not obtained by electrochemical reduction in en/NaPF6.Acknowledgements
We thank Professor Chih-Hung Chang and Changqing Pan (OSU Chemical Engineering) for assistance with Raman measurements. A.U.L. thanks the Whiteley Fellowship in Material Sciences for financial support.References
- Intercalation Chemistry, ed. M. S. Whittingham and A. J. Jacobson, Academic Press, New York, 1982 Search PubMed.
- Intercalated layered materials, ed. F. A. Lévy, D. Reidel Publishing, Dordrecht, Holland, 1979 Search PubMed.
- E. Benavente, M. A. Santa Ana, F. Mendizabal and G. Gonzalez, Coord. Chem. Rev., 2002, 224, 87 CrossRef CAS.
- W. Rüdorff and H. H. Sick, Angew. Chem., 1959, 71, 127 CrossRef.
- W. Rüdorff, Chimia, 1965, 19, 489 Search PubMed.
- M. S. Whittingham and F. R. Gamble, Mater. Res. Bull., 1975, 10, 363 CrossRef CAS.
- R. B. Somoano, V. Hadek, A. Rembaum, S. Samson and J. A. Woollam, J. Chem. Phys., 1975, 62, 1068 CrossRef CAS PubMed.
- R. B. Somoano, V. Hadek and A. Rembaum, J. Chem. Phys., 1973, 58, 697 CrossRef CAS PubMed.
- M. A. Santa Ana, V. Sanchez and G. Gonzalez, Electrochim. Acta, 1995, 40, 1773 CrossRef CAS.
- A. A. Stepanov, N. D. Lenenko, A. S. Golub and V. S. Pervov, Russ. J. Electrochem., 2013, 49, 86 CrossRef CAS.
- M. S. Whittingham, J. Electroanal. Chem., 1981, 118, 229 CrossRef CAS.
- G. Gonzalez, M. A. Santa Ana and E. Benavente, Electrochim. Acta, 1998, 43, 1327 CrossRef CAS.
- V. Sanchez, E. Benavente, M. A. Santa Ana and G. Gonzalez, Chem. Mater., 1999, 11, 2296 CrossRef CAS.
- M. A. Lukowski, A. S. Daniel, F. Meng, A. Forticaux, L. S. Li and S. Jin, J. Am. Chem. Soc., 2013, 135, 10274 CrossRef CAS PubMed.
- J. Xiao, D. W. Choi, L. Cosimbescu, P. Koech, J. Liu and J. P. Lemmon, Chem. Mater., 2010, 22, 4522 CrossRef CAS.
- J. Xiao, X. J. Wang, X. Q. Yang, S. D. Xun, G. Liu, P. K. Koech, J. Liu and J. P. Lemmon, Adv. Funct. Mater., 2011, 21, 2840 CrossRef CAS.
- L. David, R. Bhandavat and G. Singh, ACS Nano, 2014, 8, 1759 CrossRef CAS PubMed.
- G. S. Bang, K. W. Nam, J. Y. Kim, J. Shin, J. W. Choi and S.-Y. Choi, ACS Appl. Mater. Interfaces, 2014, 6, 7084 CAS.
- J. Park, J.-S. Kim, J.-W. Park, T.-H. Nam, K.-W. Kim, J.-H. Ahn, G. Wang and H.-J. Ahn, Electrochim. Acta, 2013, 92, 427 CrossRef CAS PubMed.
- J. L. Dye, Science, 2003, 301, 607 CrossRef CAS PubMed.
- E. Wein, W. Mullerwarmuth and R. Schöllhorn, Solid State Ionics, 1987, 22, 231 CrossRef CAS.
- L. Bernard, M. McKelvy, W. Glaunsinger and P. Colombet, Solid State Ionics, 1985, 15, 301 CrossRef CAS.
- L. A. Brown, W. S. Glaunsinger and M. J. McKelvy, J. Solid State Chem., 2000, 155, 326 CrossRef CAS.
- H. Ogata, H. Fujimori, S. Miyajima, K. Kobashi, T. Chiba, R. E. Taylor and K. Endo, J. Phys. Chem. Solids, 1997, 58, 701 CrossRef CAS.
- E. Figueroa, J. W. Brill and J. P. Selegue, J. Phys. Chem. Solids, 1996, 57, 1123 CrossRef CAS.
- H. Boller and H. Blaha, J. Solid State Chem., 1982, 45, 119 CrossRef CAS.
- M. S. Whittingham, Mater. Res. Bull., 1974, 9, 1681 CrossRef CAS.
- R. Schöllhorn and A. Weiss, J. Less-Common Met., 1974, 36, 229 CrossRef.
- R. D. Shannon, Acta Crystallogr., Sect. A: Cryst. Phys., Diffr., Theor. Gen. Crystallogr., 1976, 32, 751 CrossRef.
- O. Matsumoto, E. Yamada, Y. Kanzaki and M. Konuma, J. Phys. Chem. Solids, 1978, 39, 191 CrossRef CAS.
- T. Maluangnont, K. Gotoh, K. Fujiwara and M. M. Lerner, Carbon, 2011, 49, 1040 CrossRef CAS PubMed.
- T. Maluangnont, G. T. Bui, B. A. Huntington and M. M. Lerner, Chem. Mater., 2011, 23, 1091 CrossRef CAS.
- T. Maluangnont, M. M. Lerner and K. Gotoh, Inorg. Chem., 2011, 50, 11676 CrossRef CAS PubMed.
- T. Maluangnont, W. Sirisaksoontorn and M. M. Lerner, Carbon, 2012, 50, 597 CrossRef CAS PubMed.
- Y. H. Zhao, M. H. Abraham and A. M. Zissimos, J. Org. Chem., 2003, 68, 7368 CrossRef CAS PubMed.
- A. U. Liyanage and M. M. Lerner, RSC Adv., 2012, 2, 474 RSC.
- A. U. Liyanage, E. U. Ikhuoria, A. A. Adenuga, V. T. Remcho and M. M. Lerner, Inorg. Chem., 2013, 52, 4603 CrossRef CAS PubMed.
- J. Zheng, H. Zhang, S. H. Dong, Y. P. Liu, C. T. Nai, H. S. Shin, H. Y. Jeong, B. Liu and K. P. Loh, Nat. Commun., 2014, 5, 2995 Search PubMed.
- A. Lerf and R. Schöllhorn, Inorg. Chem., 1977, 16, 2950 CrossRef CAS.
- C. N. R. Rao and A. Nag, Eur. J. Inorg. Chem., 2010, 4244 CrossRef CAS.
- T. Sekine, C. Julien, I. Samaras, M. Jouanne and M. Balkanski, Mater. Sci. Eng., B, 1989, 3, 153 CrossRef.
- M. G. Giorgini, M. R. Pelletti, G. Paliani and R. S. Cataliotti, J. Raman Spectrosc., 1983, 14, 16 CrossRef CAS.
| This journal is © The Royal Society of Chemistry 2014 |


