Chemical bonding in amorphous Si-coated carbon nanotubes as anodes for Li ion batteries: a XANES study†
Jigang Zhou*ac,
Yongfeng Hua,
Xiaolin Lib,
Chongmin Wang*b and
Lucia Zuina
aCanadian Light Source Inc, Saskatoon, Canada. E-mail: jigang.zhou@lightsource.ca; Fax: +1-306-6573535; Tel: +1-306-657-3587
bPacific Northwest National Laboratory, Richland, Washington 99354, USA. E-mail: Chongmin.wang@pnnl.gov
cSchool of Chemical Engineering, Harbin Institute of Technology, China
First published on 11th March 2014
Abstract
The nature of the chemical bonding in an amorphous Si-coated carbon nanotube (Si-CNT) anode, and its evolution upon electrochemical cycling, have been investigated using comprehensive X-ray absorption spectroscopy (XANES) at the Si L- and K-edges, along with the C and O K-edges. The Si nanolayer on the CNT is found to be anchored to the CNT via Si–O–C bonding. This bond weakens upon electrochemical cycling, accompanied by the generation of Li2CO3 on the surface of the Si-CNT. These findings are crucial in designing further improved Si–C composite anodes for lithium ion batteries.
Nanostructured Si, especially when hybridized with carbon, offers a plausible solution to utilizing the high theoretical capacity of Si while avoiding any concerns of structural damage due to the extremely large volume change (300%) during the lithiation–delithiation cycle.1,2 Given that the Si–C composite relies on the electronic conductivity of carbon, the interaction of Si with the carbon and its maintenance during the electrochemical lithiation–delithiation cycling are crucial for a high performance lithium ion battery anode. An in situ TEM investigation has previously been carried out to study the phase transformation and microstructural evolution of the amorphous silicon nano-layer coated carbon nanotube (Si-CNT), which found that the Si layer is strongly bonded to the CNT and that no spallation occurs during the lithiation and delithiation cycles.2 However, a deeper and more fundamental understanding of the electronic nature of the bonding between the Si layer and the CNT in the Si-CNT, and its evolution upon cycling, is still needed to provide insights into the structural stability of Si-CNT as an anode, and its failure mechanism. This information will not only benefit the study of Si-CNTs but will serve as a model for other Si–C3 based lithium ion battery anodes, leading to further performance improvements. In addition to the Si–C interaction in the Si-CNT, a study of the solid–electrolyte interface (SEI), a layer of decomposed electrolyte which occurs on the surface of the Si-CNT anode upon cycling, is also needed for further understanding of the stable cycling performance of the Si-CNT. Additionally, the Si oxidation state change upon lithiation shall unveil the charge compensation mechanism during lithiation,4 which is important for a full understanding of the lithiation process. X-ray absorption near edge structure (XANES) spectroscopy involves the measurement and interpretation of the photoabsorption cross-section across a particular core level (absorption edge) of an atom in a chemical environment up to ∼50 eV above the threshold. The absorption features in a XANES spectrum track the bound-to-bound and bound-to-quasi-bound (multiple scattering) transitions, thus affording element specificity, and they are very sensitive to the local chemical environment of the absorbing atom. XANES spectroscopy has been successfully used to reveal the fundamental structure and bonding in nanomaterials, particularly carbon nanostructure hybrids,5–7 and also the chemical interactions in graphene based lithium ion battery electrode materials.4,8 O K-edge XANES spectroscopy is known to be very sensitive to various Li oxide and carbonate compounds,9 which are the major components of an SEI layer.10 This study reports the application of C, O, and Si K-edge and Si L-edge XANES spectroscopy to investigate the chemical nature of the Si–C interaction, and its evolution during cycling in a Si-CNT. Alongside this main goal, the SEI and Si oxidation states and their changes upon cycling will also be studied. Such goals can only be achieved with a comprehensive X-ray spectroscopic study, by probing different elements and/or different edges of the same element in a complex system. The former allows a full perspective view of a bonding environment involving different elements, while the latter can access the different orbitals of a single element.
Si-CNTs were prepared by the chemical vapor deposition of a thin layer of Si (∼13 nm) onto CNTs with a diameter of 100–200 nm (Fig. S1a in the ESI†). The CNTs without an Si coating have an amorphous surface which could serve as a link layer to anchor the coated Si, as seen in Fig. S1a.† TEM and EDX mapping also clarified the uniform Si coating (Fig. S1d and e in the ESI†). The silicon to carbon ratio was 1![[thin space (1/6-em)]](https://www.rsc.org/images/entities/char_2009.gif) :
:![[thin space (1/6-em)]](https://www.rsc.org/images/entities/char_2009.gif) 3 and the specific capacity of ∼1000 mA h g−1 for the Si-CNT (Fig. S1f in the ESI†) was determined in a coin cell, which consisted of a Si-CNT electrode and a Li metal counter electrode with ethylene carbonate and diethyl carbonate (EC-DEC) as the electrolyte.2 The coin cell was cycled at a current rate of 1 A g−1 with the cut-off voltage at 0.05 V for lithiation and 1.5 V for the delithiation. The XANES characterization of pristine and cycled Si-CNTs was performed at SGM and PGM beamline in a vacuum chamber at ∼10−8 Torr and data were recorded for the surface sensitive total electron yield (TEY, sensitive to the top ∼5 nm) and bulk sensitive fluorescence yield (FY). For the cycled samples, the coin cell was disassembled in a glove box which was attached to the beamline, and loaded directly into the vacuum chamber. XANES data were first normalized to the incident photon flux I0, measured with a fresh gold mesh at SGM and a Ni mesh at PGM located upstream of the sample. After background correction, the XANES was normalized to the edge jump (the difference in absorption coefficients just below, and at a flat region above, the edge).
3 and the specific capacity of ∼1000 mA h g−1 for the Si-CNT (Fig. S1f in the ESI†) was determined in a coin cell, which consisted of a Si-CNT electrode and a Li metal counter electrode with ethylene carbonate and diethyl carbonate (EC-DEC) as the electrolyte.2 The coin cell was cycled at a current rate of 1 A g−1 with the cut-off voltage at 0.05 V for lithiation and 1.5 V for the delithiation. The XANES characterization of pristine and cycled Si-CNTs was performed at SGM and PGM beamline in a vacuum chamber at ∼10−8 Torr and data were recorded for the surface sensitive total electron yield (TEY, sensitive to the top ∼5 nm) and bulk sensitive fluorescence yield (FY). For the cycled samples, the coin cell was disassembled in a glove box which was attached to the beamline, and loaded directly into the vacuum chamber. XANES data were first normalized to the incident photon flux I0, measured with a fresh gold mesh at SGM and a Ni mesh at PGM located upstream of the sample. After background correction, the XANES was normalized to the edge jump (the difference in absorption coefficients just below, and at a flat region above, the edge).
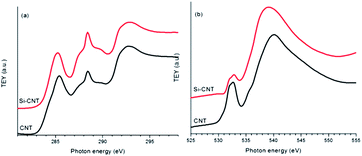
The Si–C interaction in the Si-CNT is first explored by comparing the C K-edge XANES results for the CNT and the Si-CNT, as shown in Fig. 1a. The C K-edge XANES spectra reflect the transition from C 1s electrons to mainly C 2p states, following dipole selection rules. It is indicated by two main transitions at ∼285 and ∼292 eV, attributable to the C 1s transitions to the graphitic C–C (sp2 carbon) π* and the C–C σ* state, respectively, in CNT and its composite. The observation of C–C π* and C–C σ* in the Si-CNT confirms the existence of the graphitic network after Si coating. Along with these two features, a broad peak centered at ∼288 eV is present in both samples. This peak has been observed in various carbon nanostructures and can be attributed to a C–O bond.6,8,11,12 It is also well accepted that this feature will be enhanced whenever the carbon nanostructure is hybridized with other components, including metal oxides and phosphates, and so it has been identified as a reliable spectroscopic indicator of the covalent bonding in these nano-hybrids.12–14 Evidently, this absorption feature is greatly enhanced in the Si-CNT relative to that in the pristine CNT, and this is the first solid spectroscopic evidence of covalent bonding between Si and the CNT in Si-CNTs, quite possibly in the form of Si–O–C bonding. Such bonding also alters the electronic structure in the C 2p orbitals in the Si-CNT, as shown by the negative energy shift and decreased intensity of the C–C π*peak. This could suggest an even better electronic conductivity in the Si-CNT due to the increase in electrons closer to the conduction band; this might be comparable to the situation in the conductive polymer binder of a high capacity battery anode.15 The proposed Si–O–C bonding can be further evaluated by an O K-edge XANES study of the Si-CNT and CNT, which is shown in Fig. 1b. O K-edge XANES spectroscopy probes the unoccupied O 2p projected states, which could be hybridized with carbon or silicone states. The CNT presents a broad peak at ∼532 eV which could be due to the π* of the C–O bond.16 The presence of this peak, together with the appearance of an ∼288 eV peak in the C K-edge in Fig. 1a, confirms the existence of oxygen functional groups in the pristine CNT. This C–O bonding has an associated σ* bonding feature at ∼540 eV. This is also called a shape resonance peak due to its intrinsic sensitivity to bond length, similar to the case seen in the N K-edge XANES study of a C–N bond.17 Interestingly, upon Si coating this shape resonance peak shifts to a lower energy, which indicates a loosely bonded O compared to that in pristine CNTs. This agrees well with the fact that Si has a larger atomic radius and weaker electron affinity than carbon, and thus a Si–O bond is expected to have a weaker covalent feature than a C–O bond. Therefore this is the second spectroscopic evidence of the formation of a Si–O–C bond in the interface between Si and the CNT in a Si-CNT. Si uses sp3 hybridization to bond with the oxygen, and therefore the Si–O–C bond results in a lower intensity of π*, at ∼532 eV.
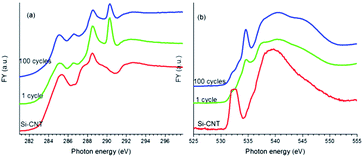
We will focus next on the C and O K-edge XANES studies of lithiated Si-CNTs to explore the Si–O–C bond change upon electrochemical lithiation and cycling of lithiation–delithiation, before we use Si L and K-edge XANES spectroscopy to explore this Si–O–C bonding and its evolution. Upon lithiation, a passivating SEI layer with Li2CO3 as the major component18 was expected to form on the Si-CNT. This would block TEY signals from the CNT from being detected, resulting in a much lower C–C π* in the lithiated Si-CNT relative to that in the pristine Si-CNT (see Fig. S2 for the C K-edge TEY spectra in the ESI†). To probe the Si–O–C bond in the SEI coated Si-CNT, bulk sensitive FY mode was used to perform C K-edge XANES spectroscopy on the lithiated Si-CNT along with the pristine Si-CNT, and the spectra are displayed in Fig. 2a. Evidently, lithiation dramatically sharpens the Si–O–C bond peak (288 eV), which could be due to the strain caused by the large volume expansion in the lithiated Si layer. The intensity of this feature decreases further after 100 cycles of lithiation–delithiation, which is highly likely to be related to a weaker Si–O–C bond in the cycled samples. The weaker Si–O–C bond is also reflected in the O K-edge XANES spectrum, as displayed in Fig. 2b. As discussed above for Fig. 1b, the shape resonance peak at around 540 eV can be used to understand the Si–O–C bonding in the Si-CNT. It can be observed that lithiation broadens this peak and cycling shifts this peak to a higher energy, similar to that of the pristine Si-CNT. This aligns well with the decrease in intensity of the 288 eV peak in the C K-edge XANES spectrum, as the Si–O–C bond becomes weaker upon lithiation and electrochemical cycling. Along with this observation, the sharp peak at ∼290 eV in the C K-edge, and at ∼535 eV in the O K-edge XANES spectra of the lithiated Si-CNT indicates the presence of Li2CO3 (ref. 19) in the SEI. It should be noted that the SEI is very complex and contains other Li species, such as LiOx, which could be identified by O K-edge XANES spectroscopy.19 The spectroscopic difference between the lithiated Si-CNTs (cycle 1 and cycle 100) should also be caused by the SEI difference. For instance, there might be more Li2CO3 in the Si-CNT with 100 cycles, and there might be more LiOx in the Si-CNT with only one cycle, as shown by the broadened feature close to 535 eV.19
 | ||
| Fig. 2 XANES spectra of the Si-CNT and the lithiated Si-CNTs at the C K-edge (a), and the O K-edge (b), recorded in FY mode. | ||
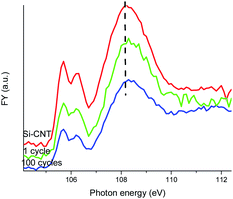
The Si–O–C bonding in the Si-CNT and its evolution is further explored from a Si perspective with the Si L-edge XANES spectra displayed in Fig. 3. Si L-edge XANES spectroscopy involves the electronic transition of Si 2p states, and it is also sensitive to the oxidation state. Again, due to the shallow probing depth in TEY mode (∼5 nm), only bulk sensitive FY is suitable to explore the Si–O–C interface in the Si-CNT and the lithiated Si-CNT. The TEY mode Si L-edge XANES spectrum of the Si-CNT shows an elemental Si feature at ∼100 eV but there is no Si–O feature detectable (ESI† Fig. S3), which strengthens the buried interface nature of the Si–O–C bond in the Si-CNT. Elemental and lithiated Si are present in the FY mode Si L-edge XANES spectrum, but we will only focus on the Si–O region in Fig. 3, as the FY Si L-edge suffers from self-absorption with partially inverted features20 (ESI† Fig. S4). The first two well-resolved peaks are transitions to the first unoccupied 3s-like states, from the spin-orbit split of Si 2p (2p3/2 and 2p1/2). The peak at ∼108 eV is due to a 2p to 3d transition, which features a broad peak (due to multiple scattering). It is generally agreed that the splitting and relative peak ratio of the first two peaks relates to the long range order of Si–O tetrahedral coordination: the splitting of the peaks becomes more resolved and the peak ratio of first![[thin space (1/6-em)]](https://www.rsc.org/images/entities/char_2009.gif) :
:![[thin space (1/6-em)]](https://www.rsc.org/images/entities/char_2009.gif) second peak increases with the increase in shared oxygen atoms.21 Clearly, lithiation and further cycling reduces the peak splitting and also the peak ratio of first
second peak increases with the increase in shared oxygen atoms.21 Clearly, lithiation and further cycling reduces the peak splitting and also the peak ratio of first![[thin space (1/6-em)]](https://www.rsc.org/images/entities/char_2009.gif) :
:![[thin space (1/6-em)]](https://www.rsc.org/images/entities/char_2009.gif) second peak, which indicates a more amorphous Si–O bond. This must be closely related to a weaker Si–O–C bond in the lithiated and cycled Si-CNT. Along with the change of the first two peaks, the broad peak at 108 eV also slightly shifts to a higher energy upon lithiation. This could be linked to a compressed Si–O bond, caused by the strain effect due to the volume change in the Si.
second peak, which indicates a more amorphous Si–O bond. This must be closely related to a weaker Si–O–C bond in the lithiated and cycled Si-CNT. Along with the change of the first two peaks, the broad peak at 108 eV also slightly shifts to a higher energy upon lithiation. This could be linked to a compressed Si–O bond, caused by the strain effect due to the volume change in the Si.
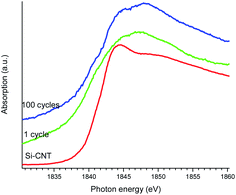
Finally, the chemical states of Si in the lithiated Si-CNT were examined by Si K-edge XANES spectroscopy (TEY) to glean an insight into the lithiation process, as shown in Fig. 4. The Si K-edge arises from the transition of the excited Si 1s electron to the unoccupied orbitals with a dominant p character. It is very sensitive to the Si oxidation state, so that SiO2 has a characteristic peak at ∼1850 eV and Si shows up at ∼1845 eV.22 With this as the guide it is clear that the oxidation state in the Si-CNT is close to elemental Si with a detectable Si–O feature being observed in the Si L-edge and the C and O K-edges in the above results. Lithiation shifts the absorption edge to a lower energy, which indicates that the oxidation state of the Si becomes negative. This makes sense when taking into consideration the low electron affinity of Li relative to that of Si. Therefore a charge transfer from the Li to the Si is expected, resulting in a negative covalence for Si in the SiLi alloy. In addition to the negative edge shift, a new feature at ∼1848 eV appears upon lithiation. This might also be due to lithiation, but we cannot exclude the possibility of a distorted Si–O in the Si–C interface or a contribution from the SEI. Further cycling moves the Si K-edge absorption back to a higher energy, though the oxidation state is still negative. Such spectroscopic differences between lithiated Si-CNTs with different cycles clarifies their chemical differences, which could be used to explore the electrode fading mechanism.
In summary, the nature of the chemical interaction at the Si–C interface in a Si-CNT structure has been studied in detail using comprehensive XANES spectroscopy, involving multiple elements and edges. The most likely interaction which anchors the Si layer onto the CNT is found to be the Si–O–C bond. This bond was distorted upon lithiation and repeated cycling, and became more amorphous. Such an observation agrees with our previous publication which found that repeated cycling changes the morphology of the Si coating2 and also matches the TEM results in the ESI† (Fig. S1b and c). Lithiation also generates a passivating layer which consists of Li2CO3. Finally, the charge goes to the Si site upon lithiation as examined by the Si K-edge XANES spectroscopy. These observations shall be useful for the further development of better Si–C based Si composite anodes, especially when theoretical calculations and modelling are combined to fully understand the Si–O–C bonding nature and its behaviour during lithiation.
Acknowledgements
Thanks to Drs J. Dynes and T. Regier at CLS for technical assistance. CLS is supported by NSERC, NRC, CIHR and the University of Saskatchewan. We thank Dr D. J. Burton of Applied Science for providing the Si-CNT sample. CW is grateful for the support of the Chemical Imaging Initiative of Pacific Northwest National Laboratory. Part of this work was conducted in the William R. Wiley Environmental Molecular Sciences Laboratory (EMSL), a national scientific user facility sponsored by the DOE's Office of Biological and Environmental Research and located at PNNL. PNNL is operated by Battelle for the Department of Energy under Contract DE-AC05-76RLO1830.Notes and references
- L. Hu, H. Wu, Y. Gao, A. Cao, H. Li, J. McDough, X. Xie, M. Zhou and Y. Cui, Adv. Energy Mater., 2011, 1, 523 CrossRef CAS.
- C.-M. Wang, X. Li, Z. Wang, W. Xu, J. Liu, F. Gao, L. Kovarik, J.-G. Zhang, J. Howe, D. J. Burton, Z. Liu, X. Xiao, S. Thevuthasan and D. R. Baer, Nano Lett., 2012, 12, 1624–1632 CrossRef CAS PubMed.
- A. Magasinski, P. Dixon, B. Hertzberg, A. Kvit, J. Ayala and G. Yushin, Nat. Mater., 2010, 9, 353 CrossRef CAS PubMed.
- J. G. Zhou, J. Wang, Y. F. Hu, T. Regier, H. L. Wang, Y. Yang, Y. Cui and H. J. Dai, Chem. Commun., 2013, 49, 1765–1767 RSC.
- J. G. Zhou, H. T. Fang, Y. F. Hu, T. K. Sham, C. X. Wu, M. Liu and F. Li, J. Phys. Chem. C, 2009, 113, 10747–10750 CAS.
- J. G. Zhou, H. T. Fang, J. M. Maley, J. Y. P. Ko, M. Murphy, Y. Chu, R. Sammynaiken and T. K. Sham, J. Phys. Chem. C, 2009, 113, 6114–6117 CAS.
- S. Yang, D. Wang, G. Liang, Y. M. Yiu, J. Wang, L. Liu, X. Sun and T.-K. Sham, Energy Environ. Sci., 2012, 5, 7007–7016 CAS.
- J. G. Zhou, J. Wang, L. Zuin, T. Regier, Y. F. Hu, H. L. Wang, Y. Y. Liang, J. Maley, R. Sammynaiken and H. J. Dai, Phys. Chem. Chem. Phys., 2012, 14, 9578–9581 RSC.
- B. M. Gallant, D. G. Kwabi, R. R. Mitchell, J. Zhou, C. V. Thompson and Y. Shao-Horn, Energy Environ. Sci., 2013, 6, 2518–2528 CAS.
- S. Chattopadhyay, A. L. Lipson, H. J. Karmel, J. D. Emery, T. T. Fister, P. A. Fenter, M. C. Hersam and M. J. Bedzyk, Chem. Mater., 2012, 24, 3038–3043 CrossRef CAS.
- J. G. Zhou, J. Wang, H. T. Fang, C. X. Wu, J. N. Cutler and T. K. Sham, Chem. Commun., 2010, 46, 2778–2780 RSC.
- Y. Y. Liang, Y. G. Li, H. L. Wang, J. G. Zhou, J. Wang, T. Regier and H. J. Dai, Nat. Mater., 2011, 10, 780–786 CrossRef CAS PubMed.
- Y. Y. Liang, H. L. Wang, P. Diao, W. Chang, G. S. Hong, Y. G. Li, M. Gong, L. M. Xie, J. G. Zhou, J. Wang, T. Z. Regier, F. Wei and H. J. Dai, J. Am. Chem. Soc., 2012, 134, 15849–15857 CrossRef CAS PubMed.
- Y. Y. Liang, H. L. Wang, J. G. Zhou, Y. G. Li, J. Wang, T. Regier and H. J. Dai, J. Am. Chem. Soc., 2012, 134, 3517–3523 CrossRef CAS PubMed.
- M. Wu, X. Xiao, N. Vukmirovic, S. Xun, P. K. Das, X. Song, P. Olalde-Velasco, D. Wang, A. Z. Weber, L.-W. Wang, V. S. Battaglia, W. Yang and G. Liu, J. Am. Chem. Soc., 2013, 135, 12048–12056 CrossRef CAS PubMed.
- D. W. Lee, L. V. De Los Santos, J. W. Seo, L. L. Felix, A. D. Bustamante, J. M. Cole and C. H. W. Barnes, J. Phys. Chem. B, 2010, 114, 5723–5728 CrossRef CAS PubMed.
- J. G. Zhou, X. T. Zhou, R. Y. Li, X. L. Sun, Z. F. Ding, J. Cutler and T. K. Sham, Chem. Phys. Lett., 2009, 474, 320–324 CrossRef CAS PubMed.
- M. Nie, D. P. Abraham, Y. Chen, A. Bose and B. L. Lucht, J. Phys. Chem. C, 2013, 117, 13403–13412 CAS.
- B. M. Gallant, R. R. Mitchell, D. G. Kwabi, J. G. Zhou, L. Zuin, C. V. Thompson and Y. Shao-Horn, J. Phys. Chem. C, 2012, 116, 20800–20805 CAS.
- Y. F. Hu, R. Boukherroub and T. K. Sham, J. Electron Spectrosc. Relat. Phenom., 2004, 135, 143–147 CrossRef CAS PubMed.
- S. A. Shaw, D. Peak and M. J. Hendry, Geochim. Cosmochim. Acta, 2009, 73, 4151–4165 CrossRef CAS PubMed.
- Y. F. Hu, H. Piao, J. Fronheiser and K. Matocha, J. Electron Spectrosc. Relat. Phenom., 2011, 184, 245–248 CrossRef CAS PubMed.
Footnote |
| † Electronic supplementary information (ESI) available: TEM and EDS of Si-CNTs and lithiated Si-CNTs, electrochemical performance, C K-edge of lithiated Si-CNTs at TEY mode and Si L-edge XANES at FY mode. See DOI: 10.1039/c4ra01332h |
| This journal is © The Royal Society of Chemistry 2014 |


