
Recent progress in homogeneous immunosensors based on fluorescence or bioluminescence using antibody engineering
Abdul Qawee
Rani
a,
Bo
Zhu
 b,
Hiroshi
Ueda
b and
Tetsuya
Kitaguchi
*b
b,
Hiroshi
Ueda
b and
Tetsuya
Kitaguchi
*b
aMoon Creative Lab Inc., 3-10-5 Kitaaoyama, Minato-ku, Tokyo 107-0061, Japan
bLaboratory for Chemistry and Life Science, Institute of Innovative Research, Tokyo Institute of Technology, 4259 Nagatsuta-cho, Midori-ku, Yokohama 226-8503, Japan. E-mail: kitaguct-gfp@umin.ac.jp
First published on 28th February 2023
Abstract
Homogeneous immunosensors integrate the advantages of both biosensors and immunoassays; they include speed, high sensitivity, and accuracy. They have been developed rapidly in the past few years and offer a cost-effective alternative technology with rapidity, sensitivity, and user-friendliness, which has been applied in a wide variety of applications. This review introduces the current directions of immunosensor development, focusing on fluorescent and bioluminescent immunosensors and highlighting the advantages, improvements, and key approaches to overcome the limitations of each.
Introduction
Immunoassays are widely used in environmental and food monitoring, as well as in disease diagnosis, owing to their high sensitivity and specificity derived from the molecular recognition of antibodies. Immunoassays are based on immunoreactions, such as the binding of antibodies to antigens, and the immunosensor used in the immunoassay converts immunoreactions to measurable signals such as color, fluorescence, or bioluminescence. Based on their operation principle, immunoassays are either heterogeneous or homogeneous.Heterogeneous immunoassays, such as enzyme-linked immunosorbent assay (ELISA), are generally quantitative and sensitive techniques, but require several washing steps to remove free antigens and antibodies for a reduced background signal1 and a long incubation time for several reactions (Fig. 1A). In contrast, as a heterogeneous immunoassay, immunochromatography achieves detection in a short time by performing washing steps in flow (Fig. 1B). This immunoassay is performed using portable devices and does not require extra equipment, while requiring only a low sample volume.2 However, it has limited sensitivity, especially in detecting small molecules (<1 kDa), and quantification is difficult. Therefore, the development of a quantitative immunoassay that can readily and rapidly detect analytes with high sensitivity and specificity is urgently needed.
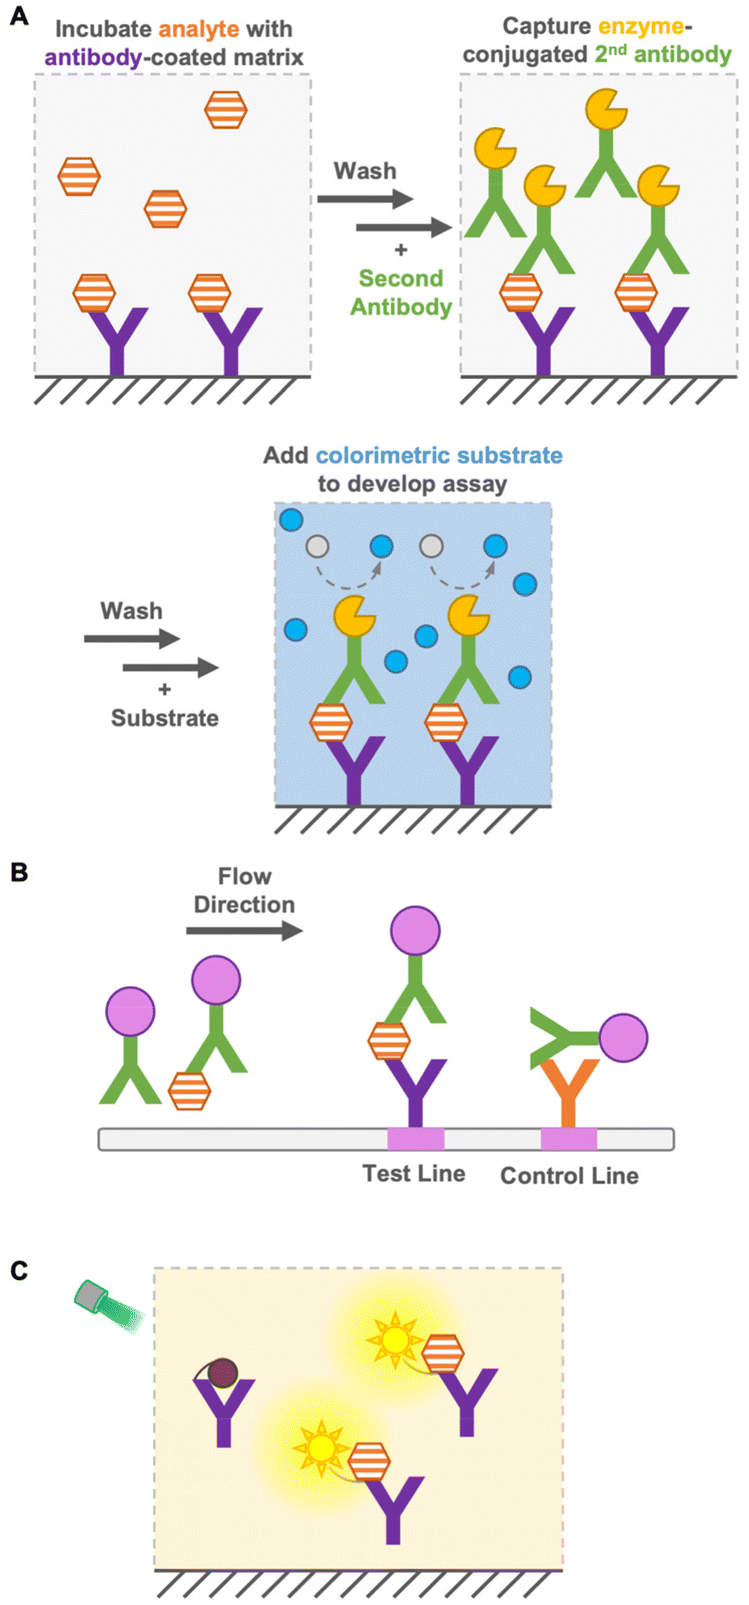 | ||
| Fig. 1 Heterogeneous and homogeneous immunoassays. (A) Scheme of a sandwich ELISA heterogenous immunoassay with multiple incubation and washing steps. (B) Scheme of immunochromatography assay. (C) Example of a homogeneous immunoassay. “Y” shape: antibody; hexagon: antigen; gray or blue circle: colorimetric substrate or product; pink circle: colloidal gold; and sun shape: fluorophore. | ||
Homogeneous immunoassays are as simple as mixing sensor proteins and analytes and do not require the removal of free antigens and antibodies (Fig. 1C). Moreover, some immunoassays do not require sophisticated or expensive instruments. Nevertheless, they are reasonably accurate and sensitive compared with the conventional ELISA methods.3–5 As mentioned above, the main advantage of homogeneous immunoassays is that they do not require extensive washing steps and long incubation times, which allows rapid on-site detection indoors and outdoors. Because of the simple operation principle of homogeneous immunoassays, non-laboratory-trained personnel can perform analyses effectively. Furthermore, their suitability for miniaturization, multiplex system, and compatibility with simple and widely available reader platforms, such as digital cameras and cellphones, expand their potential for application in a wide range of quantitative bioanalytical applications.
Fluorescent immunosensors
Fluorescence-based immunosensors have many advantages, such as fast response and non-invasiveness caused by light, multiple analyses using different wavelengths of fluorescence, high sensitivity and selectivity compared to colorimetric and absorbance-based analyses, easy labeling due to many available fluorescent reagents, and improved safety compared to radioisotope labeling. Therefore, fluorescent immunosensors are the most commonly and widely used immunosensors.Förster resonance energy transfer (FRET) immunosensors
FRET involves a nonradiative energy transfer from an excited donor chromophore to another acceptor chromophore within a suitable distance, usually less than 10 nm. Therefore, an immunosensor employing FRET is used as a tool for detecting antigen–antibody binding.6 Generally, the concentration of the analyte is detected by calculating the FRET ratio (ratio of donor to acceptor fluorescence), which changes when the analyte binds to the FRET immunosensor. In 1976, Ullman et al. developed the first homogeneous FRET immunosensor.7 The immunosensors aimed to detect small molecules, such as morphine, by competitive immunoassays with labeled antigens (Fig. 2A), as well as to detect large molecules by non-competitive immunoassays without labeled antigens (Fig. 2B). After these promising immunosensors were developed, many ways have been explored to overcome their limitations, expand the efficiency, decrease the fluorescence background, and avoid competition with labeled antigens.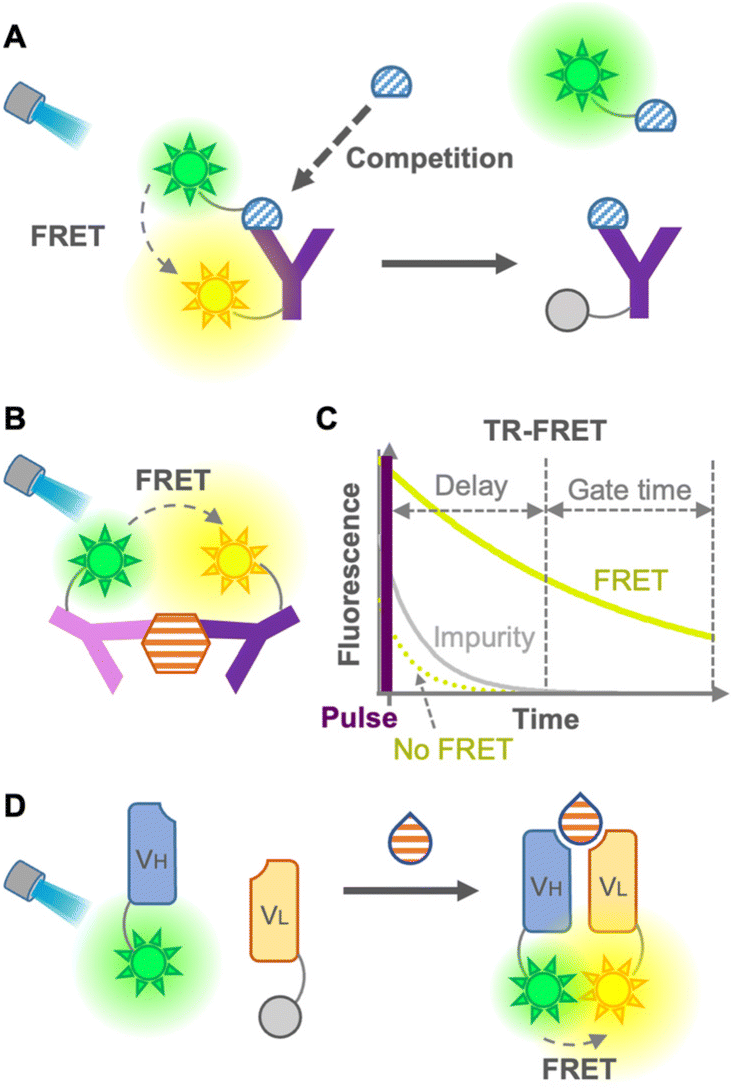 | ||
| Fig. 2 FRET immunosensors. (A) Scheme of a competitive FRET immunosensor. (B) Scheme of a non-competitive FRET immunosensor. (C) Principle of the TR-FRET immunoassay. Fluorescence from the acceptor (green) and impurity (gray). (D) Scheme of an open sandwich non-competitive immunoassay. “Y” shape: antibody; semicircle: small molecule antigen; hexagon: large molecule antigen; drop shape: large or small molecule antigen; and sun shape: fluorophore. | ||
Heyduk et al. in 2008 reported an immunosensor with fluorescein or Cy5-labeled oligonucleotides attached to a pair of target-specific antibodies which works as a molecular pincer with consistent generation of FRET signals regardless of the specific configuration; this is attributable to a simple and predictable geometry of duplex DNA by annealed oligonucleotides.8 Moreover, the annealed oligonucleotides increased the stability of the complex 10–10![[thin space (1/6-em)]](https://www.rsc.org/images/entities/char_2009.gif) 000 times higher than that of the same complex without the oligonucleotide component, which leads to a reduced background donor fluorescence derived from the dissociation of the complex. Practical and/or commercial applicability of the pincer immunosensor has been extended to the detection of human serum albumin,9 cancer markers using carcinoembryonic antigen (CEA),10 determination of insulin and C-peptide levels in biological samples,11 and Hepatitis C diagnosis via detection of anti-Hepatitis C virus IgG and IgM.12 Although this non-competitive immunosensor was able to detect large molecules, it might show low efficiency for small-molecule detection due to the difficulty in recognizing different epitopes of a small molecule using two antibodies.
000 times higher than that of the same complex without the oligonucleotide component, which leads to a reduced background donor fluorescence derived from the dissociation of the complex. Practical and/or commercial applicability of the pincer immunosensor has been extended to the detection of human serum albumin,9 cancer markers using carcinoembryonic antigen (CEA),10 determination of insulin and C-peptide levels in biological samples,11 and Hepatitis C diagnosis via detection of anti-Hepatitis C virus IgG and IgM.12 Although this non-competitive immunosensor was able to detect large molecules, it might show low efficiency for small-molecule detection due to the difficulty in recognizing different epitopes of a small molecule using two antibodies.
The leakage of excitation light and background fluorescence present in complex media, such as cell lysates or serum, is a limitation of FRET immunosensors. This limitation was overcome using long-lived fluorophore labeling and time-resolved FRET (TR-FRET).13 The principle of the TR-FRET-based immunoassay was first described by Morrison in 1988, in which pyrenebutyrate and B-phycoerythrin were used as a long-lifetime donor fluorophore and a short-lifetime acceptor fluorophore, respectively14 (Fig. 2C). Once the TR donor is excited in a short pulse, it emits light for a long period, such as hundreds of nanoseconds, leading to excitation of the acceptor close to the donor for emitting fluorescence. This time-resolved fluorescence enables highly sensitive fluorescence measurement with minimal background by starting the measurement after the fluorescence of impurities in the cell lysate and serum, and that of the acceptor not mediated by FRET disappear. Furthermore, Geißler et al. in 2013 presented a robust multiplexed six-color TR-FRET immunosensor for simultaneous monitoring of cancer markers.15 TR-FRET, providing fewer false-positive/false-negative results, increases the sensitivity and reliability of the immunoassay. Many TR-FRET immunosensors developed for the detection of a variety of antigens9,16 are commercially available and widely used in various applications. However, the main drawback of TR-FRET is the cost of extra equipment for time-resolved detection, as well as the difficulty in sandwiching a small molecule for a non-competitive immunoassay. As mentioned so far, because of the large dimension of the antibodies, it is difficult to perform a sandwich-type non-competitive immunoassay for small antigens with two fluorophore-labeled antibodies.17 To overcome this drawback, Ueda et al. in 1999 described a FRET-based sensor consisting of fluorescein- and rhodamine-labeled heavy chain (VH) and light chain (VL) fragments, respectively, which was able to detect small antigens with non-competitive immunoassay18 (Fig. 2D). This method is derived from the open-sandwich immunoassay19 based on the association of separated VH and VL chains of an antibody variable region in the presence of an antigen. Although this promising method avoids the use of labeled antigens and competitive immunoassays, a high FRET efficiency and antigen-dependent association are not always guaranteed.
Single fluorophore immunosensors
Although FRET immunosensors are useful and widely used around the world for homogeneous immunoassays, they have persistent drawbacks. As a FRET immunosensor generally utilizes the ratio of two emissions for detection, it is not suitable for the simultaneous detection of multiple targets in single trace samples because the number of emissions required is twice the number of targets. The ratio calculation is usually essential, and it is not easy to obtain a large change in the FRET ratio from the immunosensor because the FRET efficiency depends on several physical parameters, such as distance, spectral overlap, and dipole moment between donor and acceptor fluorophores. Using single fluorophores, an emission intensiometric immunosensor can be produced, which provides a simple and easy-to-use immunoassay. Therefore, a single fluorophore immunosensor could contribute to intuitive and user-friendly homogeneous immunoassays.The first single fluorophore immunosensor was designed based on fluorescence polarization. Dandliker et al. first applied fluorescence polarization for the detection of antigen–antibody interactions in the 1960s20 (Fig. 3A). The fluorescence-labeled antigen rotates rapidly in a solution, resulting in low fluorescence polarization. When the labeled antigen is bound to a specific antibody, the rotation of the complex becomes slower, and the fluorescence polarization is increased. While applying the sample containing an antigen as an analyte, to the complex, the antigen in the samples competes with the labeled antigen, and fluorescence polarization is decreased by detaching the labeled antigens.21 Due to its simplicity, this immunoassay is suitable for high-throughput screening, such as screening of mycotoxins in cereals22 and maize,23 determination of diclofenac24 and carbamazepine25 in wastewater, and detection of thiacloprid in environmental and agricultural samples.26 Moreover, multiplex detection of tumor markers has been successfully achieved using multicolor quantum dots (QDs) for antigen labeling.27 The main limitations of this immunoassay might be the necessity to generate a fluorescence-labeled antigen specific to the antibody and a competitive immunoassay, but it does not require engineering of the antibody itself. Recently, using fluorescence-labeled Fab fragments through antibody engineering, C-reactive proteins in the human serum were successfully detected non-competitively, which is only applicable to large proteins.28 On the other hand, an analytical method employs a fluorescence polarization immunoassay to detect SARS-CoV-2 antibodies in the human serum.29 In this immunoassay, only sub-microliters of serum is sufficient to provide rapid and quantitative detection. Compared to antigen detection, antibody detection is more promising for this immunoassay as it switches from a competitive to a non-competitive immunoassay with a higher sensitivity. Because of this advantage, the detection of antibodies by fluorescence polarization has been applied to detect Brucella abortus in the serum and milk30 and influenza A virus in chicken and goat sera.31
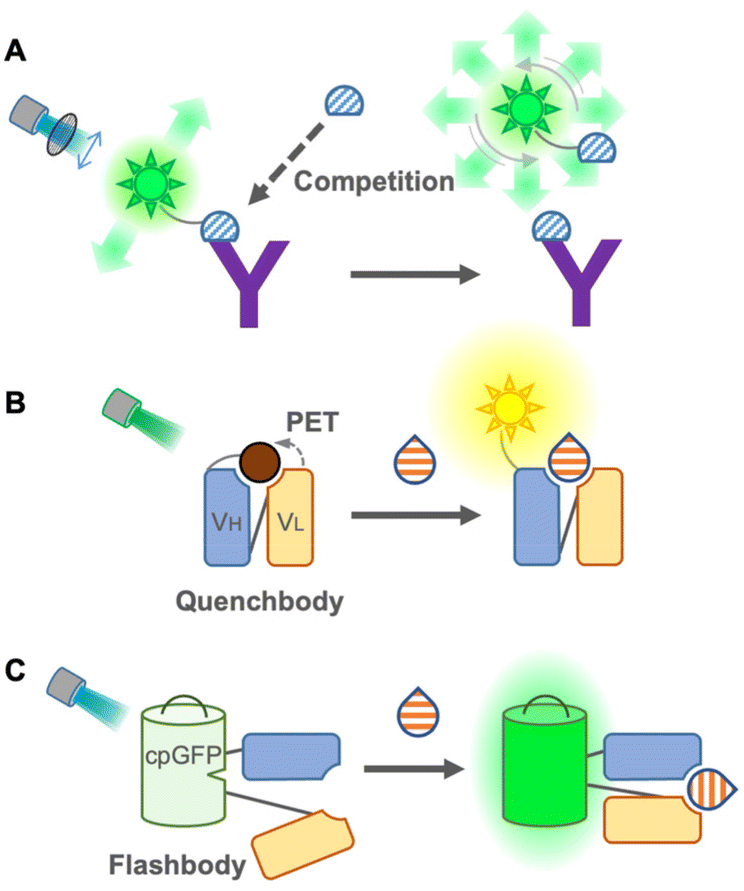 | ||
| Fig. 3 Single fluorophore immunosensors. (A) Scheme of a polarization-based immunosensor. (B) Scheme of a Quench-body (Q-body) immunosensor. (C) Scheme of a Flashbody immunosensor. “Y” shape: antibody; semicircle: small molecule antigen; drop shape: large or small molecule antigen; and sun shape: fluorophore. | ||
In 2011, Abe et al. reported a quench-based immunosensor called Quenchbody (Q-body), which is based on labeling antibodies with a fluorescent dye at a specific position, usually the N-terminal of antibody fragments5,32 (Fig. 3B). The fluorescent dye is quenched by the tryptophan residue of the antibody in the vicinity of the paratope due to photoinduced electron transfer (PET), and the Q-body functions via the antigen-dependent cancelation of the quenching effect on a fluorescent dye by release from the tryptophan residue. Therefore, the measurement principle of the Q-body is a competitive immunoassay, but the actual measurement can be performed similar to that of a non-competitive immunoassay. To achieve antigen-dependent release of the fluorescent dye, it is very important to label it at a specific position in the antibody. In the first report of Q-bodies, the N-terminal of scFv was labeled using a cell-free translation-mediated position-specific protein labeling system employing an amber suppression method with fluorescence-labeled non-natural amino acids. As this system is not simple and difficult to be applied to a large-scale and low-cost production, several strategies have been developed to achieve site-specific labeling for creating Q-bodies. Next, maleimide dyes were conjugated with the cysteine residue at the N-terminal of the variable region of the antibody fragments, which has made it affordable and easy; hence this labeling method is well accepted for creating Q-bodies against many analytes including antigens from SARS-Cov-2.33,34 To take a shortcut for removing free dyes during construction, another method using a stable and high-affinity coiled-coil peptide pair, E4 and K4, was employed, and the prepared Q-bodies were named coiled Q-body. It was formed by mixing a Fab fragment fused with an E4 peptide at the N-terminal with fluorescently labeled K4. It is simple and fast; moreover, dyes are easily changeable,35 which makes it the most practical labeling method. Furthermore, Protein M, an antibody-binding protein from Mycoplasma genitalium, introducing C-terminal cysteine, was labeled with the maleimide dye and then incubated with Fab or IgG to create a Q-body.36 Because this labeling method does not require antibody engineering before labeling, commercially available antibodies can be easily converted into a homogeneous immunosensor.
To eliminate the labeling step in immunosensor construction, a chemical-labeling-free sensor was developed using a fluorescent protein. This single fluorophore immunosensor was a genetically encoded immunosensor called Flashbody37 (Fig. 3C). Since a fluorescent protein self-catalyzes its chromophore without exogenous enzymes and emits fluorescence, it enables us to develop a homogeneous non-competitive immunosensor without extra dye labeling, which makes it a golden choice, especially for live cell imaging to visualize the spatiotemporal dynamics of molecules. The Flashbody was designed by inserting circularly permuted GFP between two fragments of the variable region (VH and VL). After optimizing the linker sequences, the fluorescence intensity of the Flashbody was elevated in a dose-dependent manner upon antigen binding. Although the proof of concept has been achieved using GFP and an antibody against the peptide antigen, it has not yet been proved whether it can be developed with other antibodies and different fluorescent proteins. Once a Flashbody proves to be achievable with a range of antibodies, it opens up new possibilities for visualizing a myriad of molecules of interest in live cell imaging.
Bioluminescent immunosensors
Bioluminescence-based immunoassays have low background signals compared to fluorescence-based homogeneous immunoassays, which are generally prone to elevate background signals in samples with impurities, such as serum or tissue lysates.38 Therefore, they yield a broad dynamic range and high sensitivity, which are advantageous for the development of homogeneous immunoassays.39,40Additionally, bioluminescence-based immunoassays are carried out using simple devices, as external excitation light is not required. Despite these advantages, only a few bioluminescent homogeneous immunosensors have been developed. This may be due to the difficulty in protein engineering of fusion proteins containing antibody fragments and bioluminescent proteins. Even in fluorescent immunosensors, most of them are antibodies labeled with chemical fluorophores, and few employ fused fluorescent proteins, which are free from chemical labeling. This may also reflect the difficulties in developing immunosensors based on protein fusion to antibodies using molecular biological methods.
Bioluminescence resonance energy transfer (BRET) immunosensor
We first introduce the BRET immunosensor as a bioluminescent immunosensor. BRET is the energy transfer from a bioluminescent donor to a fluorescent acceptor when the distance between the donor and acceptor is close. Thus, similar to FRET, BRET is applicable for the analysis of antigen–antibody binding. When the analyte binds to the BRET immunosensor, the BRET ratio (ratio of the donor and acceptor emission) changes in a dose-dependent manner, and the concentration of the analyte is then identified. In contrast to the FRET immunosensor, the major advantage of the BRET immunosensor is that autofluorescence, light scattering, and photobleaching can be ignored.The first non-competitive BRET immunosensor,41 evolved from an open-sandwich immunoassay, which utilized the antigen-dependent association of antibody variable domains fused to Renilla luciferase (Rluc) and YFP, was reported by Arai et al. in 2001 (Fig. 4A). The working principle of this non-competitive BRET immunosensor was similar to that of the FRET immunosensor18 described above. Although hen egg lysozyme proteins have been used as antigens, this immunosensor is promising for the detection of small molecules in principle. In addition, a competitive BRET immunoassay in which a Myc peptide tag was fused to firefly luciferase and Cy3-labeled anti-Myc antibody was reported by the same group42 (Fig. 4B). However, since this report, BRET immunosensors have been quietly developed. Recently, attempts to improve the BRET efficiency by utilizing QDs as acceptors have been reported, which have a broad excitation wavelength, as reported by Yu et al. in 2016. The QD-BRET immunosensors consist of a QD-labeled antigen as an acceptor and Rluc-fused scFv as a donor and showed an improved BRET efficiency.4 However, in addition to further improvement in the BRET efficiency, a competitive immunoassay requiring a labeled antigen is still the main limitation of this QD-BRET immunosensor.
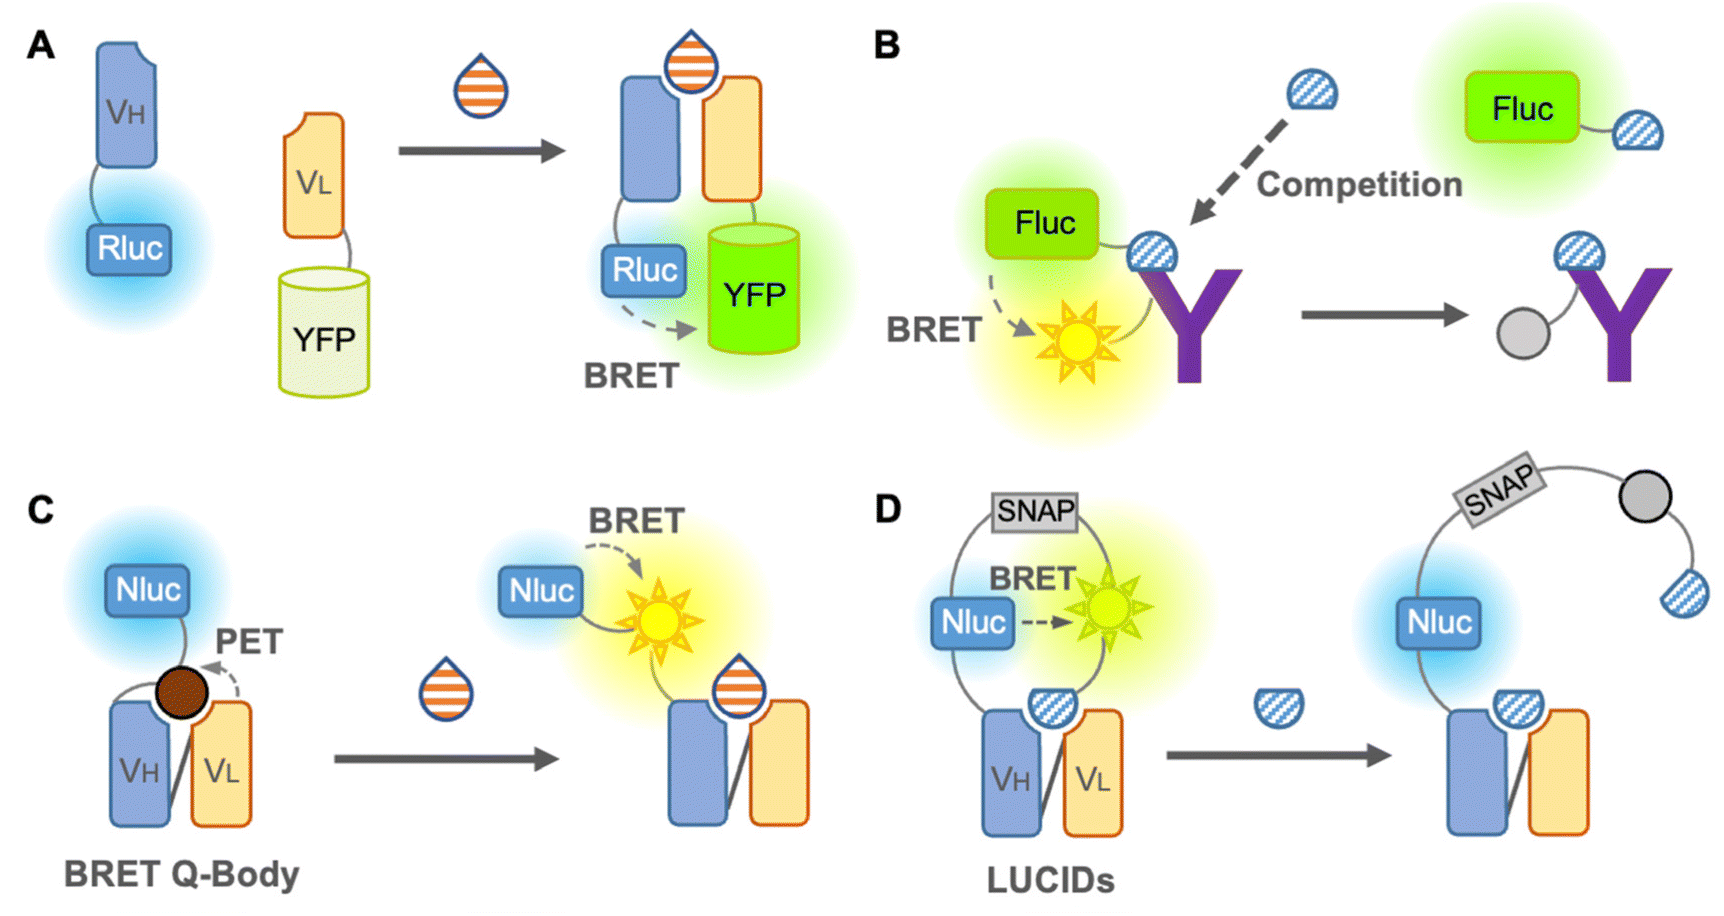 | ||
| Fig. 4 BRET immunosensors. (A) Scheme of an open sandwich BRET immunosensor. (B) Scheme of a competitive BRET immunosensor. (C) Scheme of a BRET-Q-body. (D) Scheme of a LUCID immunosensor. “Y” shape: antibody; semicircle: small molecule antigen; drop shape: large or small molecule antigen; and sun shape: fluorophore. | ||
Takahashi et al. reported a BRET immunosensor with a distinct working principle developed by a combination of Q-body and BRET in 2021 (Fig. 4C). They converted the single fluorophore Q-body into a BRET Q-body by fusing luciferase, NanoLuc, to the N-terminal of the Q-body, which is close to the fluorescent dye.43 Binding of the antigen releases the PET-quenched fluorescent dye from the paratope, which is more accessible to NanoLuc and leads to an increase in the BRET efficiency of the BRET Q-body. Therefore, the signal of the BRET Q-body is derived from the addition of both the release of dye quenching and the altered BRET efficiency, producing an increased dynamic range for detection. Since it works like a non-competitive immunoassay and is suitable for small molecule detection, similar to the Q-body, it is a BRET immunosensor with a bright future.
As mentioned earlier, few BRET immunosensors have been developed. However, there is an interesting example of a sensor named luciferase-based indicator of drugs (LUCIDs), which contains a binding domain from a protein for molecular recognition and has evolved into an antibody-based sensor (Fig. 4D). LUCIDs are based on the fusion protein of a receptor protein for the drug of interest44 or antibody fragments,45 NanoLuc luciferase, and SNAP-tag labeled with a fluorescent dye, which is connected to a synthetic ligand competitor of the antigen. BRET between the luciferase and the tethered fluorescent competitor was disrupted by the binding of the antigen, leading to the release of the competitor from the antibody. Similar to the Q-body, LUCIDs can also be used as non-competitive immunoassays. Analytes can be quantified by spotting samples onto filter paper for analysis with a digital camera, which was designed for reliable quantification of analytes in point-of-care diagnostics. Thus, in the early days, the development of BRET immunosensors was not sufficient or popular, but it is rapidly developing into a promising immunosensor.
Split luciferase immunosensor
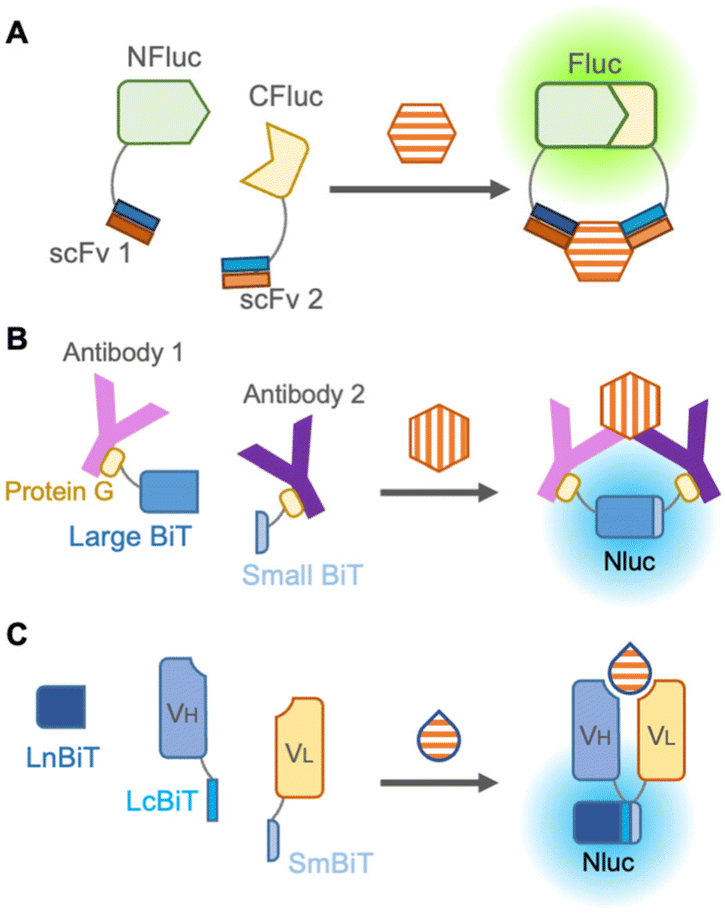
It is known that a luciferase loses its enzymatic activity when it is split into two parts, and its activity is restored when the two fragments are in close proximity. When each of the two fragments was fused to two different proteins, the interaction between these proteins could be examined by bioluminescence, leading to the detection of antigen–antibody binding. In 2002, Paulmurugan et al. first reported the complementation of split firefly luciferase driven by the interaction between two proteins, Id and MyoD.46 In 2004, Luker et al. optimized the position of the split in the firefly luciferase protein by screening truncation libraries of N- and C-terminal fragments.47The first split luciferase immunosensor48 was described by Stains et al. in 2010 (Fig. 5A). This non-competitive immunosensor employed two scFvs recognizing distinct epitopes of HER2 fused to the N- and C-terminal fragments of luciferase to detect the tumor marker. Despite the simplicity of the split luciferase immunosensor, such as single-color bioluminescence and no requirement for excitation light, the immunosensors have also been quietly developed. This is attributable to bioluminescence generally being known to be darker than fluorescence, and even darker when split into two fragments. Moreover, fusion proteins with antibodies are not always reproducible or functional, as previously mentioned. Another possible reason is that the feasibility of small molecule detection by a split luciferase immunosensor had not yet been proved and needs further improvements and ingenuities.
 | ||
| Fig. 5 Split luciferase immunosensors. (A) Scheme of a split Fluc non-competitive immunosensor. (B) Scheme of a RAPPID immunosensor. (C) Scheme of an open sandwich bioluminescent immunosensor (ternary protein fragment complementation). “Y” shape: antibody; hexagon: large molecule antigen; and drop shape: large or small molecule antigen. | ||
The darkness limitation was overcome by the emergence of NanoLuc, a luciferase derived from deep-sea shrimp displaying more than 150-fold brighter bioluminescence than other previous luciferases.49 It also offers several advantages, including enhanced protein stability, easier handling due to its smaller size (19 kDa), and a large signal-to-background ratio during complementation. In the reliable complementation for detection of protein–protein interaction, NanoLuc is cleaved into two subunits: an 11 amino acid peptide termed “Small BiT” and an 18 kDa polypeptide named “Large BiT”, and reconstitution of the two subunits generates sufficient bioluminescence.
To avoid fusion with antibodies, Hwang et al., in 2020 chemically labeled anti-mouse and anti-rabbit IgG antibodies with halo-tag ligands,50 which were conjugated with Small BiT and Large BiT fused with a halo-tag. These antibodies were mixed with commercially available rabbit IgG and mouse IgG against the same targets, such as IκBα, AKT, STAT3, etc., and these target proteins were successfully detected in a dose-dependent manner by bioluminescence from complementation of Small BiT and Large BiT. Instead of chemical labeling against antibodies, Ni et al. in 2021 employed protein G, an antibody-binding protein from Streptococcal bacteria fused to Small BiT and Large BiT for modification of antibodies, and this platform was named ratiometric plug-and-play immunodiagnostics (RAPPID)51 (Fig. 5B). After protein G-Small BiT and -Large BiT were separately mixed with two antibodies developed against the same target and photo-conjugated to the antibodies, the RAPPID platform allowed sensitive detection of several biomarkers, such as cardiac damage marker (cardiac troponin I) and inflammation marker (CRP), monitoring of anti-antibodies during therapeutic antibody treatment, and clinical testing for SARS-CoV-2. Nevertheless, the detection of small molecules remains difficult as two antibodies are recruited for detection.
To develop a split luciferase immunosensor using a reliable and stable fusion protein with an antibody, Dixon et al. in 2017 split NanoLuc into three parts consisting of one large fragment and two 11 amino acid peptides that are fused as the antibody appendages,52 because a short peptide usually has a minor effect on the function of the fused original protein. When peptide-fused Fab, peptide-fused antibody mimetic named designed ankyrin repeat proteins (DARPin), and a large fragment from NanoLuc were mixed, they can quantify HER2, proving that this unique complementation system overcomes previous limitations. Interestingly, Ohmuro-Matsuyama et al. in 2018 developed a non-competitive immunoassay for a small molecule by applying ternary NanoLuc fragment complementation to open-sandwich immunoassay53 (Fig. 5C). When two 11 amino acid NanoLuc peptides, LcBiT and SmBiT, fused to VH and VL, respectively, were mixed with a large fragment, LnBiT, a small antigen consisting of 7 amino acids was detected in both the luminometer and digital camera. Remarkably, this approach is promising for the detection of small molecules and large proteins with high sensitivity, introducing a technique for a wide variety of applications.
Future prospects
The development of homogeneous immunosensors for the detection of target molecules at a low concentration or in complex samples with interference from impurities is a challenging work, especially for small molecules. To increase the robustness, including the dynamic range and LOD, of the FRET/BRET-based competitive immunosensors for small molecules, the energy transduction efficiency between luciferases, fluorescent proteins, fluorophores, or fluorescent particles such as quantum dots54,55 can be improved by looking for an optimal and universal labeling site or a method on different antibodies or antibody fragments.For the detection of small molecules, non-competitive immunosensors, such as open-sandwich immunosensors, Q-body and Flashbody, have successfully avoided the difficulties in creating and using competitive assays including the inhibitor antigen (or analogue) conjugation and the turn-off signal interpretation at a low analyte concentration. As emerging non-competitive immunosensors, their development methods or molecular designs still need to be improved. The affinity between the VH and VL usually affects the signal-to-background in an open-sandwich immunosensor. Even though a screening approach is available to engineer the interface between the VH and VL,56 a more straightforward method to find suitable antibodies from the monoclonal antibody generation step should be developed. The intrinsic tryptophan for quenching fluorophores is critical to the Q-body immunosensor.5 However, the function prediction of a Q-body from the antibody sequence is still challenging. For accelerating Q-body development and engineering, it is necessary to understand more about the relationship between antibody sequences and the function of Q-body using a high-throughput profiling method.57 For Flashbody, the linker sequences between the antibody fragment and circularly permuted fluorescent protein are important for its dynamic range.37 Currently, the best method to find functional linker sequences is step-wise random mutagenesis, which is relatively time-consuming, and the selected linkers are difficult to be used in a different Flashbody. A high-throughput screening method, which enables us to do a comprehensive optimization of the linker sequences, will benefit the development of Flashbody and contribute to finding universal linkers in the future.
Conclusions
The development of homogeneous immunosensors represents a promising way to the establishment of rapid, sensitive, and user-friendly immunoassays for a wide variety of applications. Several directions for the development, ingenuity, refinement, and improvement of homogeneous immunosensors were introduced in this review. We described the efforts of many scientists to provide a solution for many complications and limitations that appeared in the development of homogeneous immunosensors. Many difficulties have been overcome, and some homogeneous immunosensors are commercially available, though not as frequently as ELISA and immunochromatography. To catch up with and surpass these heterogeneous immunoassays, further increases in sensitivity and stability are crucial for effective application of homogeneous immunoassays.Author contributions
A. Q. R. wrote the manuscript. B. Z. contributed to figure construction and writing. H. U. contributed to the review design. T. K. designed and drafted the manuscript.Conflicts of interest
The authors declare no conflicts of interest. The authors are responsible for the content and writing of this manuscript.Acknowledgements
We thank Mr Keisuke Tenda from Moon Creative Lab Inc. for his support and advice.References
- R. Ekins, Nature, 1980, 284, 14–15 CrossRef CAS PubMed.
- O. D. Hendrickson, E. A. Zvereva, D. S. Popravko, A. V. Zherdev, C. Xu and B. B. Dzantiev, J. Chromatogr. B: Anal. Technol. Biomed. Life Sci., 2020, 1141, 122014 CrossRef CAS.
- M. Ma, K. Wen, R. C. Beier, S. A. Eremin, C. Li, S. Zhang, J. Shen and Z. Wang, ACS Appl. Mater. Interfaces, 2016, 8, 17745–17750 CrossRef CAS PubMed.
- X. Yu, K. Wen, Z. Wang, X. Zhang, C. Li, S. Zhang and J. Shen, Anal. Chem., 2016, 88, 3512–3520 CrossRef CAS.
- R. Abe, H. Ohashi, I. Iijima, M. Ihara, H. Takagi, T. Hohsaka and H. Ueda, J. Am. Chem. Soc., 2011, 133, 17386–17394 CrossRef CAS PubMed.
- W. R. Algar, N. Hildebrandt, S. S. Vogel and I. L. Medintz, Nat. Methods, 2019, 16, 815–829 CrossRef CAS.
- E. F. Ullman, M. Schwarzberg and K. E. Rubenstein, J. Biol. Chem., 1976, 251, 4172–4178 CrossRef CAS.
- E. Heyduk, B. Dummit, Y. H. Chang and T. Heyduk, Anal. Chem., 2008, 80, 5152–5159 CrossRef CAS PubMed.
- R. E. Wang, L. Tian and Y. H. Chang, J. Pharm. Biomed. Anal., 2012, 63, 165–169 CrossRef CAS.
- E. Heyduk and T. Heyduk, Biosensors and Molecular Technologies for Cancer Diagnostics, Taylor & Francis, 1st edn, 2012, ch. 26, pp. 455–463 Search PubMed.
- E. Heyduk, M. M. Moxley, A. Salvatori, J. A. Corbett and T. Heyduk, Diabetes, 2010, 59, 2360–2365 CrossRef CAS PubMed.
- L. Tian, R. E. Wang and Y. H. Chang, Antiviral Ther., 2012, 17, 1437–1442 CrossRef CAS.
- D. W. Piston and G. J. Kremers, Trends Biochem. Sci., 2007, 32, 407–414 CrossRef CAS.
- L. E. Morrison, Anal. Biochem., 1988, 174, 101–120 CrossRef CAS.
- D. Geißler, S. Stufler, H. G. Lohmannsroben and N. Hildebrandt, J. Am. Chem. Soc., 2013, 135, 1102–1109 CrossRef PubMed.
- B. Baldo, P. Paganetti, S. Grueninger, D. Marcellin, L. S. Kaltenbach, D. C. Lo, M. Semmelroth, A. Zivanovic, D. Abramowski, D. Smith, G. P. Lotz, G. P. Bates and A. Weiss, Chem. Biol., 2012, 19, 264–275 CrossRef CAS PubMed.
- P. R. Selvin and J. E. Hearst, Proc. Natl. Acad. Sci. U. S. A., 1994, 91, 10024–10028 CrossRef CAS.
- H. Ueda, K. Kubota, Y. Wang, K. Tsumoto, W. Mahoney, I. Kumagai and T. Nagamune, BioTechniques, 1999, 27, 738–742 CrossRef CAS.
- H. Ueda, K. Tsumoto, K. Kubota, E. Suzuki, T. Nagamune, H. Nishimura, P. A. Schueler, G. Winter, I. Kumagai and W. C. Mohoney, Nat. Biotechnol., 1996, 14, 1714–1718 CrossRef CAS PubMed.
- W. B. Dandliker, S. P. Halbert, M. C. Florin, R. Alonso and H. C. Schapiro, J. Exp. Med., 1965, 122, 1029–1048 CrossRef CAS PubMed.
- D. S. Smith and S. A. Eremin, Anal. Bioanal. Chem., 2008, 391, 1499–1507 CrossRef CAS.
- H. S. Chun, E. H. Choi, H. J. Chang, S. W. Choi and S. A. Eremin, Anal. Chim. Acta, 2009, 639, 83–89 CrossRef CAS.
- C. Li, K. Wen, T. Mi, X. Zhang, H. Zhang, S. Zhang, J. Shen and Z. Wang, Biosens. Bioelectron., 2016, 79, 258–265 CrossRef CAS.
- A. Raysyan, R. Moerer, B. Coesfeld, S. A. Eremin and R. J. Schneider, Anal. Bioanal. Chem., 2021, 413, 999–1007 CrossRef CAS PubMed.
- L. Oberleitner, U. Dahmen-Levison, L. A. Garbe and R. J. Schneider, J. Environ. Manage., 2017, 193, 92–97 CrossRef CAS.
- Y. Ding, H. Chen, Q. Yang, L. Feng, X. Hua and M. Wang, RSC Adv., 2019, 9, 36825–36830 RSC.
- J. Tian, L. Zhou, Y. Zhao, Y. Wang, Y. Peng and S. Zhao, Talanta, 2012, 92, 72–77 CrossRef CAS.
- K. Nishiyama, M. Fukuyama, M. Maeki, A. Ishida, H. Tani, A. Hibara and M. Tokeshi, Sens. Actuators, B, 2021, 326, 128982 CrossRef CAS.
- K. Nishiyama, K. Takahashi, M. Fukuyama, M. Kasuya, A. Imai, T. Usukura, N. Maishi, M. Maeki, A. Ishida, H. Tani, K. Hida, K. Shigemura, A. Hibara and M. Tokeshi, Biosens. Bioelectron., 2021, 190, 113414 CrossRef CAS.
- K. Nielsen, M. Lin, D. Gall and M. Jolley, Methods, 2000, 22, 71–76 CrossRef CAS.
- Y. Takeda, Y. Yonezawa, S. Asake, H. Ogawa and K. Imai, J. Vet. Diagn. Invest., 2020, 32, 887–891 CrossRef CAS PubMed.
- H. Ueda and J. Dong, Biochim. Biophys. Acta, 2014, 1844, 1951–1959 CrossRef CAS PubMed.
- B. Zhu, N. Nosaka, S. Kanamaru, J. Dong, Y. Dai, A. Inoue, Y. Yang, K. Kobayashi, T. Kitaguchi, H. Iwasaki, R. Koike, K. Wakabayashi and H. Ueda, Analyst, 2022, 147, 4971–4979 RSC.
- H.-J. Jeong, K. Takuya, J. Dong and H. Ueda, ACS Sens., 2016, 1, 88–94 CrossRef CAS.
- T. Yasuda, A. Inoue, T. Kitaguchi and H. Ueda, Chem. Commun., 2021, 57, 8206–8209 RSC.
- J. Dong, C. Miyake, T. Yasuda, H. Oyama, I. Morita, T. Tsukahara, M. Takahashi, H. J. Jeong, T. Kitaguchi, N. Kobayashi and H. Ueda, Biosens. Bioelectron., 2020, 165, 112425 CrossRef CAS PubMed.
- D. Wongso, J. Dong, H. Ueda and T. Kitaguchi, Anal. Chem., 2017, 89, 6719–6725 CrossRef CAS PubMed.
- M. P. Hall, V. A. Kincaid, E. A. Jost, T. P. Smith, R. Hurst, S. K. Forsyth, C. Fitzgerald, V. T. Ressler, K. Zimmermann, D. Lazar, M. G. Wood, K. V. Wood, T. A. Kirkland, L. P. Encell, T. Machleidt and M. L. Dart, Anal. Chem., 2021, 93, 5177–5184 CrossRef CAS PubMed.
- F. Fan and K. V. Wood, Assay Drug Dev. Technol., 2007, 5, 127–136 CrossRef CAS.
- Q. Yu, L. Xue, J. Hiblot, R. Griss, S. Fabritz, C. Roux, P. A. Binz, D. Haas, J. G. Okun and K. Johnsson, Science, 2018, 361, 1122–1126 CrossRef CAS PubMed.
- R. Arai, H. Nakagawa, K. Tsumoto, W. Mahoney, I. Kumagai, H. Ueda and T. Nagamune, Anal. Biochem., 2001, 289, 77–81 CrossRef CAS.
- Y. Yamakawa, H. Ueda, A. Kitayama and T. Nagamune, J. Biosci. Bioeng., 2002, 93, 537–542 CrossRef CAS PubMed.
- R. Takahashi, T. Yasuda, Y. Ohmuro-Matsuyama and H. Ueda, Anal. Chem., 2021, 93, 7571–7578 CrossRef CAS.
- R. Griss, A. Schena, L. Reymond, L. Patiny, D. Werner, C. E. Tinberg, D. Baker and K. Johnsson, Nat. Chem. Biol., 2014, 10, 598–603 CrossRef CAS PubMed.
- L. Xue, Q. Yu, R. Griss, A. Schena and K. Johnsson, Angew. Chem., Int. Ed., 2017, 56, 7112–7116 CrossRef CAS PubMed.
- R. Paulmurugan, Y. Umezawa and S. S. Gambhir, Proc. Natl. Acad. Sci. U. S. A., 2002, 99, 15608–15613 CrossRef CAS.
- K. E. Luker, M. C. Smith, G. D. Luker, S. T. Gammon, H. Piwnica-Worms and D. Piwnica-Worms, Proc. Natl. Acad. Sci. U. S. A., 2004, 101, 12288–12293 CrossRef CAS.
- C. I. Stains, J. L. Furman, J. R. Porter, S. Rajagopal, Y. Li, R. T. Wyatt and I. Ghosh, ACS Chem. Biol., 2010, 5, 943–952 CrossRef CAS PubMed.
- S. Liu, Y. Su, M. Z. Lin and J. A. Ronald, ACS Chem. Biol., 2021, 16, 2707–2718 CrossRef CAS PubMed.
- B. B. Hwang, L. Engel, S. A. Goueli and H. Zegzouti, Commun. Biol., 2020, 3, 8 CrossRef CAS PubMed.
- Y. Ni, B. Rosier, E. A. van Aalen, E. T. L. Hanckmann, L. Biewenga, A. M. Pistikou, B. Timmermans, C. Vu, S. Roos, R. Arts, W. Li, T. F. A. de Greef, M. van Borren, F. J. M. van Kuppeveld, B. J. Bosch and M. Merkx, Nat. Commun., 2021, 12, 4586 CrossRef CAS PubMed.
- A. S. Dixon, S. J. Kim, B. K. Baumgartner, S. Krippner and S. C. Owen, Sci. Rep., 2017, 7, 8186 CrossRef PubMed.
- Y. Ohmuro-Matsuyama and H. Ueda, Anal. Chem., 2018, 90, 3001–3004 CrossRef CAS PubMed.
- K. D. Wegner, S. Linden, Z. Jin, T. L. Jennings, R. el Khoulati, P. M. van Bergen en Henegouwen and N. Hildebrandt, Small, 2014, 10, 734–740 CrossRef CAS.
- E. R. Goldman, I. L. Medintz, J. L. Whitley, A. Hayhurst, A. R. Clapp, H. T. Uyeda, J. R. Deschamps, M. E. Lassman and H. Mattoussi, J. Am. Chem. Soc., 2005, 127, 6744–6751 CrossRef CAS PubMed.
- J. Dong, M. Ihara and H. Ueda, Anal. Biochem., 2009, 386, 36–44 CrossRef CAS PubMed.
- A. Inoue, T. Yasuda, B. Zhu, T. Kitaguchi, A. Murakami and H. Ueda, Sci. Rep., 2021, 11, 22590 CrossRef CAS PubMed.
| This journal is © The Royal Society of Chemistry 2023 |