 Open Access Article
Creative Commons Attribution 3.0 Unported Licence
Recent progress in sensing application of metal nanoarchitecture-enhanced fluorescence
Meiling
Wang
 a,
Min
Wang
a,
Ganhong
Zheng
a,
Zhenxiang
Dai
a and
Yongqing
Ma
*ab
a,
Min
Wang
a,
Ganhong
Zheng
a,
Zhenxiang
Dai
a and
Yongqing
Ma
*ab
aAnhui Key Laboratory of Information Materials and Devices, School of Physics and Materials Science, Anhui University, Hefei, 230039, China. E-mail: yqma@ahu.edu.cn
bInstitute of Physical Science and Information Technology, Anhui University, Hefei, 230039, China
First published on 9th March 2021
Abstract
Fluorescence analytical methods, as real time and in situ analytical approaches to target analytes, can offer advantages of high sensitivity/selectivity, great versatility, non-invasive measurement and easy transmission over long distances. However, the conventional fluorescence assay still suffers from low specificity, insufficient sensitivity, poor reliability and false-positive responses. By exploiting various metal nanoarchitectures to manipulate fluorescence, both increased fluorescence quantum yield and improved photostability can be realized. This metal nanoarchitecture-enhanced fluorescence (MEF) phenomenon has been extensively studied and used in various sensors over the past years, which greatly improved their sensing performance. Thus in this review, we primarily give a general overview of MEF based sensors from mechanisms to state-of-the-art applications in environmental assays, biological/medical analysis and diagnosis areas. Finally, their pros and cons as well as further development directions are also discussed.
1 Introduction
Fluorescence-based techniques are simple and universal analytical methods extensively used in trace detection, biomedical imaging, diagnosis, optoelectronics and forensics.1–7 As a real time and in situ analytical approach to target analytes, fluorescence-based sensors can offer advantages of high sensitivity, high selectivity, non-invasive measurements and easy transmission over long distances.7–9 However, they still suffer from shortcomings, such as low fluorescence quantum efficiency, environment-dependent intensity and photobleaching, which severely hinder their wider application.Localized surface plasmons (LSPs) refer to free electron collective oscillations induced by external electromagnetic waves, in confined metal nanostructures such as nanoparticles (see Fig. 1a). Resonance may occur when the light frequency matches that of the conduction electron oscillation. Under this condition, the electric field near the nanoparticle surface is largely enhanced and the metal optical extinction is greatly increased.10,11 Thus LSPs offer unique absorption and scattering properties to metallic nanoparticles.12,13 It should be noted that absorption (corresponding to nonradiative decays) induces fluorescence quenching of nearby fluorophores, while scattering contributes to fluorescence enhancement. And the proportion of scattering in total extinction spectra greatly affects the degree of fluorescence enhancement induced by these metallic nanoparticles. Silver and gold nanoparticles with larger sizes are preferably used for fluorescence enhancement, as for smaller ones, absorption loss tends to dominate.14
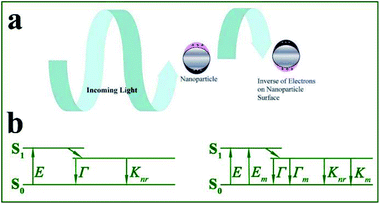 | ||
| Fig. 1 (a) Interactions between light and metal nanoparticles induce absorption and scattering of incident light. Schematic shows the induced surface charge oscillations by the external light field. Reprinted from ref. 1 with permission. (b) Jablonski diagram in the absence (left) and presence (right) of a metal nanostructure. E – excitation rate, Γ – radiation rate, Knr – nonradiation decay rate, Em – metal-enhanced excitation rate, and Γm – metal enhanced-radiation rate. | ||
Based on the above theory, we summarized that metal nanoarchitecture-enhanced fluorescence (MEF, firstly reported in the 1960s15,16 and firstly used for biosensors in 1991) arises from resonant interactions between emission dipoles and LSPs of metal nanoarchitectures (see Fig. 1a). The enhanced electric field experienced by fluorophores gives rise to extra increased excitation rates Em, while the resultant coupling between fluorophores and nearby metal nanoparticles induces extra radiative rates Γm. This process can be more easily understood using the Jablonski diagram shown in Fig. 1b. Thus MEF can effectively enhance the fluorescence quantum efficiency of fluorophores by increasing both excitation and radiative decay rates.14,17–19 To obtain effective MEF, there should be overlaps between excitation/emission spectra and the metal plasmon bands. It should be noted that, as a result of enhanced radiative decay rates, shortened effective fluorescence lifetimes can be obtained, which greatly improved the photostability of fluorophores.2,14,20 Thus MEF can solve the inherent shortcomings of fluorophores by improving both quantum efficiency and stability.
So far, LSPs have been used to enhance the emission of dyes,17,19,21,22 rare earth elements,23–28 quantum dots (QDs),14,29–43 carbon dots,36,38 carbon nanotubes,44 gold nanoclusters45,46 and even upconversion fluorophores.33,47,48 And this enhanced fluorescence has already been extensively applied in environmental analysis,45,48–64 tip-enhanced fluorescence spectroscopy,65 biotechnology66 (including fluorescence imaging,67–71 DNA mismatch investigation,72,73 immunoassays,26,74–80 bioassays,28,38,42,81–100 and investigation of biological mechanisms67,101–103), biomedical analysis (virus and bacteria detection43,104 and clinical diagnosis105,106) and so on. Characteristics and applications of MEF have been summarized in Table 1.
| Characteristics of MEF | Enhanced fluorescence | Shortened fluorescence lifetimes | Improved fluorescence stability |
|---|---|---|---|
| Applications | Environmental analysis (including environmental pollutants such as organic pollutants and heavy metal ions) | Tip-enhanced fluorescence spectroscopy | Biotechnology and bioanalysis (including protein, DNA, ATP, enzymes and so on) |
As reported, various kinds of metals have been used for MEF, such as gold,21,22,34,48,49,75,100,107–113 silver,30,31,35,45,69,110,112,114–120 aluminum,121,122 copper,123–125 nickel,125,126 chromium,125,127 zinc125 and so on. So far, MEF across the ultra-violet to the second near infrared wavelength range has been reported.128 Considering their visible and near infrared plasmon transitions, low damping associated with inter- and intra-band transitions,129 as well as easy fabrication and functionalization, gold and silver are most commonly used for MEF in practical applications.130 Gold and silver nanoparticles show plasmon frequencies decreasing with increased particle size, and thus their plasmon bands can be tuned over the entire visible and near infrared spectrum. Besides composition and size, plasmon transition frequencies can also be affected by shape and local dielectric environments of metallic nanostructures. Silver shows a much higher scattering efficiency than gold in the wavelength range of λ < 600 nm,129,131 while gold is known for its better biocompatibility and chemical stability.
MEF induced fluorescence intensity is principally determined by the following two factors: the degree of spectral overlap between fluorophore excitation and plasmon transitions, and the distance between the fluorophore and the metal surface.14,132,133 For fluorophores in close proximity (less than 5 nm) or even directly attached to the metal surface, quenching may occur as a result of the excited electron transfer to the metal via nonradiative decay ways.134 However, as the enhanced electric field decays nearly exponentially with distance, the fluorophore should not be too far from the plasmonic nanostructure. The efficiency of plasmon induced MEF is highest when they are separated by a few nanometers,14 and thus distance control is important.
To achieve a superior MEF effect, a core/shell structure or a sandwich structure is commonly used, which consists of a metal core/film, a dielectric shell/film as a spacer layer and a fluorophore layer.10,135 The spacer layer is usually a dielectric layer with precisely/atomically controlled thickness, and used to separate and connect the metal core/film and the fluorophore layer.26,50,56,58,74,136 Both the defect-free quality and the dielectric properties of the spacer can affect the plasmonic enhancement.137 In addition, an ideal spacer layer should play roles in protecting the metal from oxidation. Based on these theories, various spacer layers such as silica,18,45,138,139 alumina,140 polymers,81,141,142 graphene,48,143,144 biomolecules including aptamers and antibodies,75,77,145–147 BN,17,19,148,149 MoS2,19 WS2,19 natural halloysite nanotubes,25 carbon dots144 and carbon nanotubes144 have been reported. It should be pointed out that each kind of spacer layer has its advantages and disadvantages,17,136 and we can choose the most suitable one according to requirements.
To produce the integrated core/shell or sandwich plasmonic nanostructure, commonly the following three processes should be considered: preparation of the metallic nanostructure, coating of the spacer layer and immobilization of the fluorophore layer.27,59–64,147 Various geometrical nanostructures for MEF have been studied so far, and they can be categorized into two main groups: solution-based colloidal nanoparticles (NPs)27,31,48,52,54,92,145,150 and periodical/non-periodical plasmonic substrate chips,45,51,64,74,108,135,151,152 see Fig. 2. Design, preparation and performance study of these different geometrical plasmonic nanostructures are well summarized in previous reviews.10,31,108,112,125,136,139,153
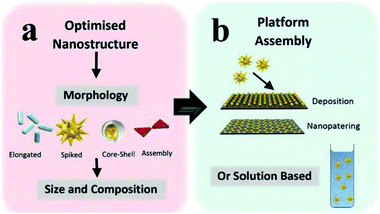 | ||
| Fig. 2 Schematic showing (a) the optimization of metal geometric nanostructures, including morphology, composition and size selection, and (b) integrated plasmon metallic nanostructure assembly (including chip film and solution-based platforms). Reproduced from ref. 128 with permission from the Royal Society of Chemistry. | ||
In this review, after elaborating the related MEF theory and platform assembling method, in the following sections, we will review research advances and the implications/limitations of these integrated MEF plasmon nanostructures in fluorescence sensing applications. Finally, we will present our views on future directions and further perspectives in this area. We hope that this review can provide a comprehensive coverage of current development achievements in this field and put forward new perspectives for the future development of improved sensing performance.
2 MEF-based fluorescence sensing for environmental analysis
2.1 Detection of heavy metal ions
So far, most of the MEF sensing is performed using solution-based colloidal NPs, where plasmonic NPs are dispersed into analyte-containing solutions, as they are attractive for biological detection, bioimaging and nanophotonic applications.136Among various types of spacer layers, silica is highly regarded for its ease of preparation, thickness controllability, light transparency, stability and biocompatibility.154 So far, such silica-coated core–shell NPs have been taken as the most successful class of hybrid plasmonic colloids. Various functions of silica shells are summarized in ref. 139. In this section, we will give a detailed introduction to Ag/Au@SiO2 core–shell colloidal NPs used in environmental analysis areas.
Heavy metal ions, such as Cu2+, Hg2+ and Pb+, are considered as persistent toxic pollutants, which mainly come from uncontrolled battery manufacturing, metal melting, automobile exhaust and old ship demolition.155 Once discharged into the environment, these heavy metals show high biotoxicity, degradation-resistance and bioaccumulation. Thus their trace detection in aqueous solutions is urgent and important.
Therefore, MEF-based fluorescence sensors for these heavy metal ions have been developed in virtue of their improved emission properties (see Table 2). For example, Kim and his co-workers fabricated a new kind of Ag@SiO2 core–shell NP, with silica chosen as the rigid spacer to adjust the distance between the Ag core and fluorophores, and Au25 nanoclusters modified on its surface acting as the fluorescence indicator.45 MEF of Au25 nanoclusters was studied with varied core sizes, shell thicknesses and excitations. And an enhancement factor of 7.4 was obtained under optimal conditions. Furthermore, the Au25-adsorbed Ag@SiO2 NPs were used for highly sensitive and selective ‘turn-off’ sensing of Cu2+, and it was proved that the turn-off ratio is 3.3 times larger than that of free Au25 nanoclusters under optimal conditions, indicating their much superior sensing ability for Cu2+ in aqueous solutions.
| MEF sensors | Fluorophores used | Fluorescence enhancement factor | Target analytes | Relative merits (LOD refers to the limit of detection) |
|---|---|---|---|---|
| Ag@SiO2 core–shell NPs58 | HPTS | 4 and 9 fold with excitation of 405 and 455 nm respectively | pH | Ratiometric sensing; pH detection range of 5–9 was realized |
| Ag@SiO2 core–shell NPs50 | 2-AA | 6.4 | 2-AA | Outstanding selectivity over co-existing polycyclic aromatic hydrocarbons |
| Ag@SiO2 (ref. 63) | Tetracycline | 6.8 | Tetracycline | LOD of 25 pM; real water sample analysis was realized |
| Ag/SiO2/SiO2 core–shell NPs and nanorods (NRs)52 | FITC | 2.63 and 3.5 | Fe3+ | LOD of 19.4 and 0.83 nM respectively; a prototype arduino based electronic device was fabricated |
| Ag NP based molecular beacons147 | FAM | 5.6 | Hg2+ | LOD of 1 nM; quantitative analysis in real lake water samples |
| MBs-aptamer/cDNA-Au@Ag15-GU48 | Upconversion nanoparticles | 4.5 | Hg2+ | Dual channel biosensor (SERS and FL); LOD of 0.33 and 1 ppb respectively; quantify Hg2+ in spiked tap water and milk samples; reproducibility, selectivity and anti-interfering ability |
| CSN-RhD55 | Rhodamine derivatives | Not mentioned | Hg2+ | Bimodal sensor (SERS and FL); with a linear detection range from 0.001 to 100 ppm and 0.01–100 ppm, and LODs of 0.94 and 5.16 ppb for MEF and SERS modes |
| ZnFe2O4@Au–Ag core–shell nanocomposite conjugated with double-stranded DNA158 | Cy3 | Not mentioned | Pb2+ | Ratiometric fluorescence analysis in the range of 10−12 to 3 × 10⁻⁶ M; LOD of 3 × 10⁻¹³ M; good recyclability and selectivity; real-time visual detection |
Ag@SiO2 based core–shell colloidal NPs of Ag@SiO2–AuNCs (AuNCs refer to Au nanoclusters) with good water dispersibility, high stability and good biocompatibility have been synthesized by Xu and his co-workers for multi-component detection of Cu2+, pyrophosphate (PPi) and pyrophosphatase (PPase) (Fig. 3). Interactions between silver cores and the outer Au NPs greatly enhanced the emission of Au NPs via improving their excitation efficiency, and the composite core–shell nanostructures were used for developing a sensing platform based on OFF–ON–OFF switching of the fluorescence signal in the presence of Cu2+, PPi and PPase, and the detection limits were 39 nM, 78.7 nM and 0.976 mU respectively. These sensing nanostructures have also been applied for fluorescence cellular imaging.56 However, unfortunately, their fluorescence imaging results can only be used for qualitative research of Cu2+, PPi or PPase, but not for quantitative research.
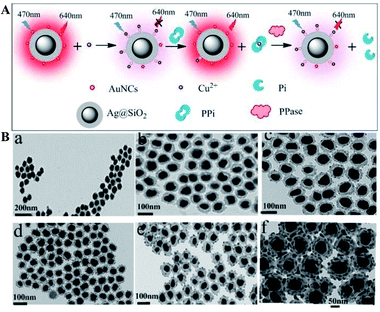 | ||
| Fig. 3 (A) Schematic of sensing mechanisms of multiple components with Ag@SiO2–AuNCs, AuNCs refer to Au nanoclusters and (B) TEM micrographs of composite Ag@SiO2 nanoparticles with different SiO2 spacer thicknesses: (a) ∼7 nm, (b) ∼10 nm, (c) ∼12 nm, (d) ∼15 nm, (e) ∼20 nm, and (f) ∼25 nm. Reprinted from ref. 56 with permission. | ||
Sui and his co-workers reported an Ag@SiO2 based core–shell nanoprobe for Hg2+, using a sensing strategy by combining MEF and hybridization chain reaction (HCR). As shown in Fig. 4, in the absence of Hg2+, HCR occurred, resulting in the formation of long DNA chains with fluorescent indicator SYBR Green intercalated into the double DNA helix. Thereafter, positively charged Ag@SiO2 NPs were added after a magnetic separation process from the test solution, which will be electrostatically adsorbed onto negatively charged DNA chains, just as ‘smart dust’ to enhance the fluorescence signal. In the presence of Hg2+, the fluorescence signal gradually decreased with [Hg2+], and a detection limit of 25 pM was obtained under current experimental conditions.63 And this probe has already been used for selective detection of Hg2+ in real water.
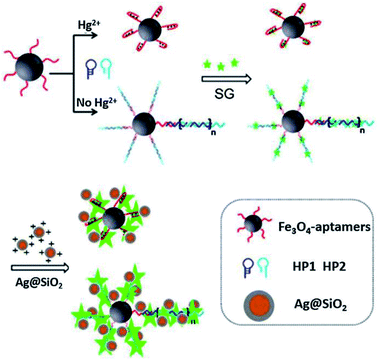 | ||
| Fig. 4 Schematic illustration of the sensing system for Hg2+ detection. Reprinted from ref. 63 with permission. | ||
Moreover, Rajbongshi and his co-workers synthesized fluorescein isothiocyanate (FITC) modified Ag/SiO2/SiO2 core–shell NPs and nanorods (NRs), and fluorescence quenching detection of Fe3+ was achieved using these plasmon nanostructures of different geometries. Lower detection limits of 19.4 and 0.83 nM were obtained for NPs (highest fluorescence enhancement factor of 2.63) and NRs (highest fluorescence enhancement factor of 3.5) respectively.52
As shown in Fig. 5A, a new MEF-based probe was designed using the distance-dependent fluorescence quenching-enhancement effect. Hg2+ was detected via the formation of the thymine–mercuric–thymine structure, which can open the hairpin and induce distance changes between the fluorophore and the Ag NPs. This process can realize fluorescence dequenching and MEF induced by Ag NPs, and 1 nM Hg2+ was detected. In this work, Ag NPs were functionalized as both the quencher to reduce blank signals and the enhancement substrate for MEF, which greatly improved detection sensitivity. And this design principle can be universal for MEF-based probes.147
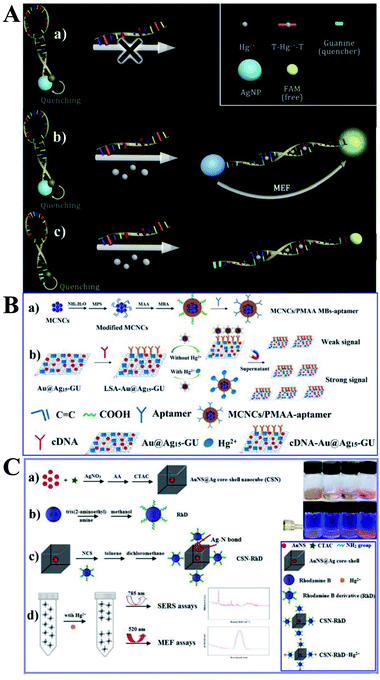 | ||
| Fig. 5 (A) Schematic showing the sensing principle of the proposed method, reprinted from ref. 147 with permission. (B) Schematic illustrations of the (a) fabrication and (b) sensing procedure of the dual-channel biosensor for the detection of Hg2+, reprinted from ref. 48 with permission. (C) Schematic illustration of the fabrication processes and sensing mechanisms of the proposed bimodal sensor for Hg2+, reprinted from ref. 55 with permission. | ||
As Raman spectroscopy has attractive vibrational fingerprint features with a bandwidth of over 100 times smaller than fluorescence,156 by combining the high-level multiplexing and specificity of surface-enhanced Raman scattering (SERS) with the large area rapid read-out of fluorescence signal, the dual-mode optical analysis is emerging as a powerful sensing analytical tool especially in biological and biomedical applications.156 Furthermore, as reported, much more pronounced photostability can be obtained for fluorophores near to a mixed metal substrate than to a single one.157 Thus Li and her co-workers fabricated a dual-channel biosensor by immobilizing versatile signal indicator Au@Ag/graphene upconversion nanohybrids (Au@Ag–GU) onto the surface of magnetic beads (MBs) through the complementary pairing reaction between the aptamer and the complementary DNA (cDNA) (denoted as MBs-aptamer/cDNA-Au@Ag15-GU), with the conjugated aptamer used for specific capture Hg2+. And the obtained sensor can export dual channels of SERS and fluorescence signals for simultaneous Hg2+ detection. As shown in Fig. 5B, in the absence of Hg2+, the MBs-aptamer/cDNA-Au@Ag15-GU can be easily attracted to one side using an external magnet, and the resulting supernatant solution did not include Au@Ag15-GU, and thus no SERS or fluorescence signal was observed. However, in the presence of Hg2+, specific binding of the aptamer with Hg2+ occurred, resulted in liberation of some cDNA-Au@Ag15-GU into the supernatant, which revealed strong SERS and enhanced fluorescence signals with increasing [Hg2+]. The as-fabricated dual-channel biosensor showed excellent performances for Hg2+ with detection limits of 0.33 and 1 ppb for SERS and fluorescence mode respectively, under the optimized conditions. And it has also been used for quantify Hg2+ in spiked tap water and milk samples. SERS can be used to achieve accurate results while the fluorescence method gives a much wider linear range, cheaper instruments and good reproducibility. It should be noted that this strategy bridged the gap between fluorescence sensing and SERS assays, which broadens future applications of MEF-based sensing.
And on this basis, the same research group synthesized a novel bimodal sensor based on rhodamine derivative (RhD) grafted Au nanospheres@Ag core–shell nanocubes (denoted as CSN-RhD), which show both MEF and SERS dual signals for Hg2+ detection (see Fig. 5C). Both the SERS and MEF intensity increased with [Hg2+]. With an optimized Ag cubic shell thickness, this CSN-RhD showed wide linear ranges of 0.001–1000 ppm and 0.01–1000 ppm, and detection limits of 0.94 and 5.16 ppb for MEF and SERS mode, respectively. These excellent sensing performances for Hg2+ can be attributed to effective signal enhancement ability of the CSN plasmon nanostructures.55
Moreover, Liang and his co-workers developed another novel MEF ratiometric/naked eye bimodal biosensor for Pb2+, which was composed of a ZnFe2O4@Au–Ag core–shell bifunctional nanocomposite conjugated with double-stranded DNA (including the Pb2+-specific DNAzyme strand labeled with Cy3 and the corresponding substrate strand labeled with N,S-doped carbon dots (N,S-CDs)). The fluorescence of N,S-CDs was significantly quenched with the formation of double-stranded DNA, which brought N,S-CDs and the super quencher CeO2 into close proximity, see Fig. 6. At the same time, Cy3 fluorescence was enhanced by the MEF effect of Au–Ag core–shell hollow nanocubes. In the presence of Pb2+, the DNAzyme strand was activated, broken away from the substrate strand and cleaved at the cleavage site into two fragments (red dot in Fig. 6). This process resulted in dequenching of N,S-CDs emission, while the fluorescence of the Cy3 labeled fragment was efficiently quenched as it can be easily adsorbed onto the CeO2. As shown in Fig. 6b, the disengaged DNA/CeO2 complex could result in a color change after adding H2O2 as a result of CeO2 autocatalysis, and thus real-time visual detection of Pb2+ can be realized. At the same time, by using the good linear relationships between log(I562/I424) and log[Pb2+] in the range of 10−12 to 3 × 10⁻⁶ M, ratiometric fluorescence quantitative analysis of Pb2+ can be realized.158 Their work might provide potential applications for on-site and real-time Pb2+ detection in real water systems.
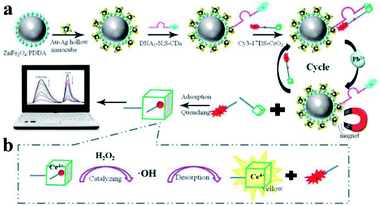 | ||
| Fig. 6 Schematic showing the fabrication and sensing processes of the Pb2+ biosensor. Reprinted Scheme 1 with permission from Linlin Liang, Feifei Lan, Shenguang Ge, Jinghua Yu, Na Ren and Mei Yan, Anal. Chem., 2017, 89, 3597–3605 (ref. 158). Copyright 2017 American Chemical Society. | ||
2.2 Analysis of pH and organic pollutants
Furthermore, MEF-based fluorescent sensors for pH and other organic pollutants were developed (as shown in Table 3). For example, a novel ratiometric sensor consisting of Ag@SiO2 core–shell NPs and a kind of pH sensitive dye of HPTS is developed by Bai and his co-workers for the pH assay.58 With a shell thickness of 8 nm, fluorescence was enhanced by 4 and 9 fold with excitation of 405 and 455 nm respectively. And the emission ratio of 513 nm excited by 455 nm to that excited by 405 nm versus pH in the range of 5–9 was determined, showing its potential application for pH detection in environmental and biological samples.| MEF sensors | Fluorophores used | Fluorescence enhancement factor | Target analytes | Relative merits (LOD refers to the limit of detection) |
|---|---|---|---|---|
| Ag@SiO2 core–shell NPs58 | HPTS | 4 and 9 fold with excitation of 405 and 455 nm respectively | pH | Ratiometric sensing; pH detection range of 5–9 was realized |
| Ag@SiO2 core–shell NPs50 | 2-AA | 6.4 | 2-AA | With a wide linear range of 1–800 nM; outstanding selectivity over co-existing polycyclic aromatic hydrocarbons |
| Ag@HNTs-Cit-Eu25 | Eu3+ | Not mentioned | Tetracycline | LOD of 4.8 nM; visual detection |
| Hydrogel microarray entrapping QD-Ag@Silica and AChE64 | QDs | Not mentioned | Paraoxon | LOD of 1.0 × 10⁻¹⁰ M; exhibiting sensitivities over three orders of magnitude higher than those without MEF effect |
Trace detection of 2-aminoanthracene (2-AA), an aromatic amine, is of great significance for environmental monitoring. Recently, Jin and co-workers synthesized a kind of Ag@SiO2 core–shell NP with an ∼40 nm Ag core and an ∼7 nm SiO2 shell, which could efficiently increase 2-AA emission via MEF. Based on this theory, 2-AA was detected within a wide linear range of 1–800 nM, with outstanding selectivity over co-existing polycyclic aromatic hydrocarbons.50
Besides Ag/Au@SiO2 core–shell colloidal NPs, other MEF-based detection in environmental analysis using Ag/Au colloidal NPs with different spacers have been reported, which we will review in this section too.
Tetracycline (TC), as a most frequently used antibiotic, also causes water pollution and enter the human body through the food chain, posing hazards to both the ecological environment and human health. Thus ultrasensitive detection of TC residues in water environments is necessary.25 Xu and his co-workers developed a smart silver-enhanced fluorescence platform via a simple modification of the interior and external surfaces of natural halloysite nanotubes (HNT) with Ag nanoparticles and Cit-Eu nanoprobes (schematically shown in Fig. 7). The appropriate thickness of the HNT walls results in effective MEF of Cit-Eu. And this Ag@HNTs-Cit-Eu nanocomposite was used for ultra-sensitive detection of TC with a detection limit of 4.8 nM.25
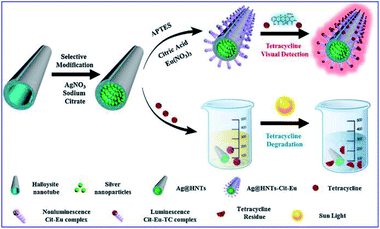 | ||
| Fig. 7 Schematical fabrication of the Ag@HNTs-Cit-Eu nanocomposite, and its schematic diagram for the detection and degradation of TC. Reprinted from ref. 25 with permission. | ||
As compared to solution-based colloidal NPs, attaching NPs to a substrate to integrate a plasmonic nanochip can reduce the tedious washing steps, but usually very low and position-dependent enhancement factors are obtained using this method as a result of random NP distributions. Considering this flaw, researchers have explored various ordered nanostructure arrays with much better plasmonic coupling between adjacent nanostructures and more hot-spot generation in nanogaps.
For example, Kim and his co-workers developed an enzyme-based miniaturized biosensor of hydrogel microarray entrapping QD-Ag@Silica and AChE for detection of neurotoxic paraoxon. In this design, MEF of Ag NPs was adopted to improve sensing performance, and paraoxon was detected via amplified QD fluorescence quenching once exposed to p-nitrophenol produced by the AChE-catalyzed hydrolytic reaction (see Fig. 8).64 This biosensor exhibited sensitivities (1.0 × 10⁻¹⁰ M) over three orders of magnitude higher than those without MEF effect. Its successful integration with microfluidic systems further demonstrated potential applications for micro-total-analysis-systems.
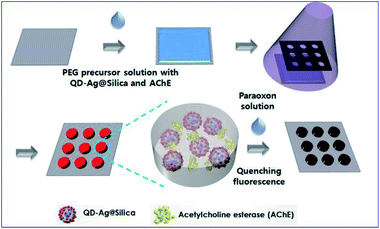 | ||
| Fig. 8 Schematic showing fabrication and sensing processes of the hydrogel microarray biosensor for paraoxon. Reproduced from ref. 64 with permission from the Royal Society of Chemistry. | ||
3 MEF-based sensing for the bioassay
Today, to improve disease curative and survival rates, early diagnosis is crucially important. Very low concentrations of biomarkers must be detected with great efficiency and reliability at preliminary stages. As a result of improved optical properties of fluorophores, MEF allows for much lower detection limits and much earlier diagnosis. Thus great efforts have been made by researchers in developing MEF-based sensing for bioassays.3.1 Immunoassay
As biochips based on plasmonic nanoparticles exhibit robust, rapid, and convenient detection, their fabrications have attracted increasing study. And the MEF phenomenon has already been widely exploited for immunoassays (as summarized in Table 4). For example, Xu and his co-workers developed a Ag@SiO2@SiO2-RuBpy core–shell composite, and a strategy for the detection of prostate specific antigen (PSA) by combining MEF and the magnetic separation technique was developed (as shown in Fig. 9A), which showed a good linear relationship between fluorescence intensity and the PSA concentration in the range of 0.1–100 ng mL−1.159 And it has also been successfully applied for the detection of PSA in human serum with high sensitivity and specificity, proving its potential in tumor diagnosis.| MEF sensors | Fluorophores used | Fluorescence enhancement factor | Target analytes | Relative merits (LOD refers to the limit of detection) |
|---|---|---|---|---|
| Ag@SiO2@SiO2-RuBpy159 | RuBpy | 3 | PSA | LOD of 0.1–100 ng mL−1; MEF and magnetic separation was combined; potential application of tumor diagnosis |
| Alloyed quaternary CdSeTeS QDs and Au NPs43 | CdSeTeS QDs | Not mentioned | Influenza virus | LOD of 10 PFU mL−1 for isolated H3N2 |
| Size-encoded PMMB-based multiplexed suspension array162 | Dyes | 60 | Multiple biomarkers | LOD of 100 fM; simultaneous detection of multiple targets with high output efficiency in complex samples; point-of-care detection |
| Ag NPs-gold nano film assembly75 | Dyes | 800 | Antigen | Neglectable initial background signal; limitless potential applications in biosensing |
| Gold island films and CDs38 | CDs | 17.2 | AFP | Dual amplification fluorescence assay; LOD of 94.3 fg mL−1; a wide linear detection range of 0.0005–5 ng mL−1 |
| Patterned Au NPs95 | FITC | Not mentioned | IgGs | LOD of 10 μg L−1; a linear response range of 10–100 μg L−1; direct detection of IgGs from patients’ urine without any pretreatments; point-of-care analysis |
| AgNCs61 | Dye | 4.6 | CEA | LOD of 1 ng mL−1; incubation times were tremendously reduced by acoustic streaming with Rayleigh surface acoustic waves |
| Ag@SiO2@SiO2-RuBpy nanocomposites28 | RuBpy | 2.12 | PSA | LOD of 0.20 ng mL−1; PSA can be detected in the range of 1–100 ng mL−1 |
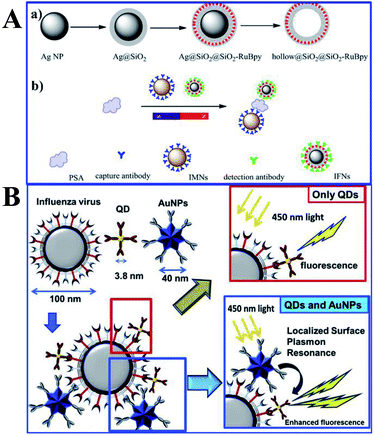 | ||
| Fig. 9 (A) Schematic showing synthesis processes of (a) Ag@SiO2@SiO2-RuBpy and hollow@SiO2@SiO2-RuBpy and (b) the sensing mechanism of PSA with the immunomagnetic nanospheres (IMNs) and immunofluorescent nanoparticles (IFNs), reprinted from ref. 159 with permission. (B) Schematic representations of the sensing principles of the MEF based fluorescence biosensor for the influenza virus. Reprinted from ref. 43 with permission. | ||
Influenza viruses, which can cause flu infections, pose major threats to human health, and thus their specific and sensitive diagnosis is urgently needed. Takemura and his co-workers developed a solution-based nanobiosensor based on MEF of alloyed quaternary CdSeTeS QDs (QD) induced by Au NPs for the detection of influenza viruses.43 The QDs were conjugated with anti-hemagglutinin (HA) antibodies (anti-HA Abs), while AuNPs were conjugated with anti-neuraminidase (NA) antibodies (anti-NA Abs). With the presence of influenza viruses, antigen interactions occurred on their surface, which along with adjacent Au NPs triggered MEF of QDs, as shown in Fig. 9B. Detection limits of 0.03 and 0.4 pg mL−1 were obtained for influenza H1N1 viruses in deionized water and human serum respectively. And the detection of the clinically isolated H3N2 was also accomplished with a detection limit of 10 PFU mL−1.
As there may be more than one definitive biomarker that can reliably diagnose early stages of many diseases, simultaneous assays with high specificity and sensitivity are necessary.128 Moreover, driven by demands for cost efficiency, there are also increasing needs to acquire more information from a single experiment. Multiplexed assays can be used to measure multiple target analytes in a single run of the assay, which includes protein and nucleic acid-based multiplexing.161,162
Considering the perfect specificity of immunoassays, multiplex detection of different biomarkers can be realized by conjugating plasmonic NPs with different capture antibodies. Yuan and his co-workers reported a kind of size-encoded plasmonic magnetic microbead (PMMB)-based multiplexed suspension array for simultaneous detection of multiple biomarkers, see Fig. 10. These PMMBs realized 60-fold fluorescence enhancement, and have improved the detection limit by 2-orders of magnitude toward 100 fM for biomarkers.160 The multiplexing ability of the as-prepared PMMB platform is particularly attractive for simultaneous detection of multiple targets with high output efficiency in complex samples. And we predict that this MEF-based PMMB could be employed as the next generation probe for biomarker detection and disease diagnosis in a multiplexed manner.
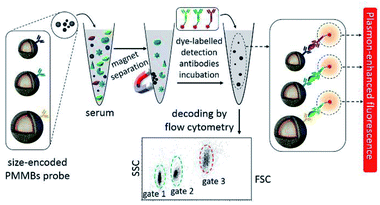 | ||
| Fig. 10 Schematic showing the experimental design: PMMBs of different sizes were conjugated with different capture antibodies for simultaneous detection of multiple targets with great sensitivity via MEF. Reprinted Scheme 1 with permission from Chao Yuan, Yunte Deng, Xuemeng Li, Chengfei Li, Zhidong Xiao and Zhuang Liu, Anal. Chem., 2018, 90, 8178–8187 (ref. 160). Copyright 2018 American Chemical Society. | ||
As plasmon nanostructures can effectively enhance emission, the fluorescence can be modulated via assembly of various plasmon structures.75 Using the Ag NP-gold nano film assembly via biorecognition binding, an over 800 fold dequenched fluorescence signal was observed by Cao and his co-workers.75 As shown in Fig. 11a, the sensing of target antigens can be conveniently confirmed by the intense fluorescence signal. As this Ag NP-gold nano film assembly works in an ‘off–on’ mode with a neglectable initial background signal, it may have limitless potential applications in biosensing. Their study may pave ways for plasmonic coupling assembly and application.
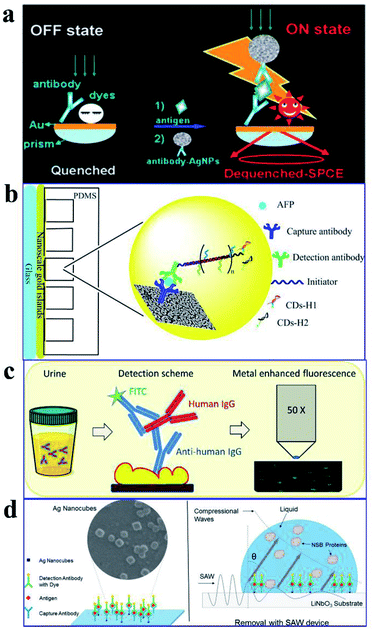 | ||
| Fig. 11 (a) Schematic illustration of the as-assembled sandwich structure for the immunoassay via dequenching. Reproduced from ref. 75 with permission from the Royal Society of Chemistry. (b) Schematic detection mechanism of AFP with the immuno-HCR and CD MEF. Reprinted TOC figure with permission from Dang-Dang Xu, Cui Liu, Cheng-Yu Li, Chong-Yang Song, Ya-Feng Kang, Chu-Bo Qi, Yi Lin, Dai-Wen Pang and Hong-Wu Tang, ACS Appl. Mater. Interfaces 2017, 9, 37606–37614 (ref. 38). Copyright 2017 American Chemical Society. (c) Schematic illustration of the detection mechanism for IgGs in urine: antibodies tethered to the Au NP substrate to recognize the antigen (human IgG), then secondary antibodies tagged by FITC bound to the human IgG in a sandwich configuration for fluorescence imaging measurements. Reprinted TOC figure with permission from Bartolomeo Della Ventura, Monica Gelzo, Edmondo Battista, Alessandro Alabastri, Andrea Schirato, Giuseppe Castaldo, Gaetano Corso, Francesco Gentile and Raffaele Velotta, ACS Appl. Mater. Interfaces, 2019, 11, 3753–3762 (ref. 95). Copyright 2019 American Chemical Society. (d) Schematic showing (left) the sensing mechanism for CEA using the Ag nanocube-based plasmon substrate, and (right) removal of nonspecifically bound (NSB) proteins with SAW devices. Reprinted TOC figure with permission from Jun Liu, Shuangming Li and Venkat R. Bhethanabotla, ACS Sens., 2018, 3, 222–229 (ref. 61). Copyright 2018 American Chemical Society. | ||
By incorporating immune hybridization chain reaction (HCR) and CD MEF, Xu and his co-workers constructed a dual amplification fluorescence sensor for alpha fetal protein (AFP).38 With the help of the capture-antibody coated plasmonic slide of gold island films (Fig. 11b) and the detection antibody-conjugated oligonucleotide initiator, HCR was triggered after the introduction of CD-tagged DNA hairpins, which are complemented to the oligonucleotide initiator. In this cleverly designed AFP sensor, CD emission was greatly enhanced by the gold nano island film, HCR provided secondary fluorescence amplification simultaneously, and the two together resulted in a 17.2-fold total signal amplification. A wide linear detection range of over 5 orders of magnitude between CD emission and AFP concentration (0.0005–5 ng mL−1) was obtained, with a low detection limit of 94.3 fg mL−1. They also realized detection of real samples using this dual amplification fluorescence assay method.38
An immunosensor for immunoglobulins (IgGs), with the fluorescence signal enhanced by patterned Au NPs and specificity realized via biological functionalization (see Fig. 11c), was developed.95 The as-prepared device can directly detect IgGs from a drop of a patient's urine without any pretreatments, and a detection limit of 10 μg L−1 was realized with a linear response range of 10–100 μg L−1. Further experiments proved its excellent specificity rarely interfered by other biomolecules and reliable analysis results comparable with those obtained using standard techniques.
Liu and his co-workers developed an immunofluorescence probe by combining MEF with the surface acoustic wave (SAW) technique to lower the detection limit for the carcinoembryonic antigen (CEA),61 which is a prognostic biomarker of colorectal cancer (see Fig. 11d). By incubating with 50 nm silver nanocubes (AgNCs) on a SAW device with an optimal surface density, emission was plasmon enhanced, which improved sensitivity to antigens by a factor of 6 and lowered the detection limit down to below 1 ng mL−1. Moreover, nonspecifically bound proteins were much more effectively removed and incubation times was tremendously reduced by the introduction of acoustic streaming. Overall, clinical levels of colorectal cancer biomarkers can be detected using this AgNC-based MEF probe.
Deng and his co-workers constructed another core–shell Ag@SiO2@SiO2-RuBpy nanocomposite for the detection of prostate specific antigen (PSA) using the target-triggered MEF ‘turn-on’ strategy, with RuBpy acting as the donor and BHQ-2 as the acceptor. BHQ-2 was brought to close proximity to the surface of the RuBpy-doped silica shell after hybridization occurred (‘off’ state). However, with the addition of target PSA, the BHQ-PSA aptamer could be dissociated from the RuBpy-doped silica shell (‘on’ state). Thus PSA quantitative analysis can be realized by recording fluorescence intensity, and a detection limit of 0.20 ng mL−1 was obtained under current experimental conditions.28
3.2 RNA and DNA detection
MicroRNAs (miRNAs), as noncoding RNAs, play crucial roles in regulating diverse physiological functions. Expression levels of tumor-related miRNAs may predict tumor growth and invasiveness, and thus their accurate detection is important. However, as a result of their low expression levels, miRNA detection remains a challenge. And MEF has also been applied for RNA and DNA analysis for its much lower detection limit (see Table 5).| MEF sensors | Fluorophores used | Target analytes | Relative merits (LOD refers to the limit of detection) |
|---|---|---|---|
| Au NRs98 | Cy5 | miRNA | LOD of 97.2 × 10⁻¹⁸ M; dual-amplification of the fluorescence signal was realized via combining MEF and a strand displacement amplification (SDA) reaction |
| Ag film/Ag zigzag nanorod array multilayer film | alex488 | DNA | LOD of 0.01 pm |
| Au NPs118 | QDs | DNA | LOD of 19.6 pg |
| GNR array100 | Fluorophore | ssDNA | A linear range from 10 pM to 10 nM |
| ORA-enabled molecular beacons152 | CDs | DNA | LOD of 300 fM; with four orders of sensitivity improvement |
As reported, a stronger electromagnetic field can be generated in the gap regions of two neighboring particles, which will result in a much more dramatic fluorescence enhancement.163 Thus a gold nanogap antenna through target-triggered assembly of Au NRs was constructed by Peng and her co-workers. Dual-amplification of the fluorescence signal was realized via combining the MEF effect of nanogap antennas and a strand displacement amplification (SDA) reaction, see Fig. 12. In the presence of target miRNA, fluorophores can be settled into the gap region of the gradually formed end-to-end Au NR dimers. Thus quenched fluorescence induced by the Au NRs exhibited a dramatic enhancement by the MEF of the nanogap antennas, and a ‘turn on’ fluorescence signal was observed. The SDA reaction resulted in secondary fluorescence amplification simultaneously. A low detection limit of 97.2 × 10⁻¹⁸ M miRNA was realized by combining this method with the single-molecule counting technique.98 Moreover, this proposed method has potential in monitoring expression levels for low-abundance nucleic acid biomarkers via miRNA imaging.
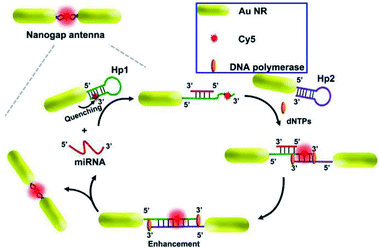 | ||
| Fig. 12 Schematic showing the assembly of nanogap antennas and sensing mechanisms for miRNA detection. Reprinted from ref. 98 with permission. | ||
Protein and DNA detections are important steps for biological and diagnostic assays. Thus Ji and her co-workers developed a Ag film/Ag zigzag nanorod array multilayer film for DNA detection (as shown in Fig. 13A). With a folding number of 7, a 14-fold fluorescence enhancement of alex488 was obtained, and the detection limit was determined to be 0.01 pm. Moreover, another study by Li and his co-workers using Au NP-enhanced QD emission for detection of DNA was developed, and a high sensitivity of 19.6 pg was established by controlling the distance between the QDs and Au NPs using different numbers of oligonucleotides.118 Mei and his co-workers developed an innovative gold nanorod (GNR) array biochip with vertical standing arrays of ordered GNR on a glass surface, as shown in Fig. 13B.100 As shown in Fig. 13B, the initial fluorescence of the biochip is minimal when the hairpin-structured ssDNA probe is conjugated to the array, as a result of quenching induced by nearby GNRs. However, the hairpin loop could be opened up with the formation of duplex DNA via hybridization, which brought the fluorophore away from the GNR array (45-nucleotide-long). And this process can induce a dramatically intensified fluorescence signal, which could be used for quantitative ssDNA detection with a linear range from 10 pM to 10 nM. Further, Kannegulla and his co-workers reported an Ag open-ring nanoarray (ORA)-enabled molecular beacon (MB) probe for DNA detection (see Fig. 13C), which yielded a detection limit of ∼300 fM (equivalent subattomoles), four orders of improvement compared with that using a plane Ag substrate.152 The ultrahigh sensitivity resulted from both the intensified fluorescence signal due to MEF of the ORA-enabled MB platform and the reduced background signal level.
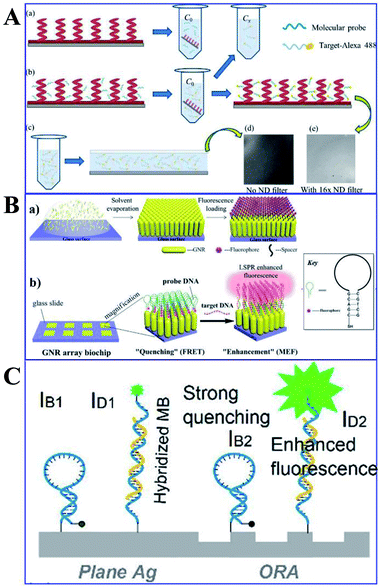 | ||
| Fig. 13 (A) Schematic of the (a) molecular probe binding to AgZNRs and (b) fluorophore labelled target oligonucleotide hybridizing with the molecular probe, with its fluorescence image in (e). (c) A drop of the target-alexa488 is sandwiched between the Si wafer and a piece of cover slip for fluorescence measurement, with the fluorescence image shown in (d). Reprinted from ref. 118 with permission. (B) Schematic showing (a) the fabrication processes of the ordered standing GNR, and (b) practical applications of the GNR array chip for DNA detection. Reprinted TOC figure with permission from Zhong Mei and Liang Tang, Anal. Chem., 2017, 89, 633–639 (ref. 100). Copyright 2017 American Chemical Society. (C) Schematic showing MBs anchored on the ORAs and plane silver surfaces respectively. IB1/IB2: quenched background intensities on plane silver/ORAs, ID1/ID2: fluorescence signals of hybridized MBs on plane silver/ORA surfaces, respectively. Reprinted TOC figure with permission from Akash Kannegulla, Ye Liu, Bo Wu and Li-Jing Cheng, J. Phys. Chem. C, 2018, 122, 770–776 (ref. 152). Copyright 2018 American Chemical Society. | ||
3.3 Enzyme detection
Acetylcholinesterase (AChE) in human blood is considered to be a biomarker of neurotoxin exposure, which inhibits AChE. Thus its trace detection in human blood is important. So far, scientists have also developed various MEF-based sensors for enzyme detection (see Table 6). For example, Ma and his co-workers designed a new kind of Ag@SiO2 core–shell NP based in situ probe for AChE by combining the AChE catalytic reaction with MEF.94 The surface of Ag@SiO2 NPs is negatively charged, while AChE can catalyze acetylthiocholine (ATCh) hydrolysis to positively charged thiocholine (TCh), and thus the negatively surface charge of the core–shell Ag@SiO2 NPs can be reversed as a result of electrostatic adsorption of TCh. Then the negatively charged fluorescent dye (8-hydroxypyrene-1,3,6-trisulfonic acid, HPTS) was confined to the Ag@SiO2 NP surface, which resulted in an enhanced fluorescence signal. A dynamic range of 0–0.005 U mL−1 AChE was detected via this mechanism, with a detection limit of 0.05 mU mL−1.94 This work provides a new way of design for MEF-based probes for biomolecules.| MEF sensors | Fluorophores used | Target analytes | Relative merits (LOD refers to the limit of detection) |
|---|---|---|---|
| Ag@SiO2 NPs94 | HPTS | ATCh | Combining the AChE catalytic reaction with MEF; a detection range of 0–0.005 U mL−1; LOD of 0.05 mU mL−1 |
| Au NBPs92 | Cy5.5 | Telomerase | LOD of 23 HeLa cells with a dynamic range of 40–1200; potential in clinical diagnosis |
| Nano-silvered 96-well plate96 | FITC | Trypsin | LOD of 1.89 ng; however, the present work needs lengthy incubation times and washing steps |
Moreover, Xu and his co-workers developed a novel solution-based nanoprobe for in situ fluorescence visualized ‘turn on’ detection of telomerase in live cells,92 which is one of the most common biomarkers for cancer diagnosis and pathogenesis. In this work, gold nanobipyramids (Au NBPs) were used as both the fluorescence resonance energy-transfer (FRET) quencher and MEF signal enhancement substrates of Cy5.5. After being conjugated to the Au NBPs, as a result of FRET, the fluorescence of Cy5.5 was totally quenched, while with the addition of deoxyribonucleotide triphosphates (dNTPs) and telomerase, the hairpin loop was opened, followed by the dequenching of Cy5.5. The best MEF factor can be obtained by adjusting the number of oligonucleotide bases. Thus this kind of nicked molecular beacon-functionalized Au NBP is a dual-functional substrate, and a low detection limit of 23 HeLa cells with a dynamic range of 40–1200 was obtained (Fig. 14A). In situ dynamic telomerase activity fluorescence imaging in live HeLa cells was realized as a result of its outstanding biocompatibility, stability and specificity. And cancer cells were also successfully distinguished from co-cultured normal ones, proving its potential in clinical diagnosis.92 This work undoubtedly demonstrated a new pathway for designing sensitive and specific MEF based probes for cancer-related biomolecules.
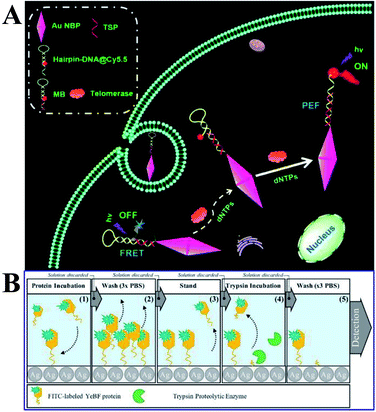 | ||
| Fig. 14 (A) Schematic showing the MEF-based telomerase nanoprobe, which can realize in situ analysis of telomerase activity in live cells. Reprinted TOC figure with permission from Shenghao Xu, Liping Jiang, Yongyin Nie, Jun Wang, Haiming Li, Yuanyuan Liu, Wei Wang, Guiyun Xu and Xiliang Luo, ACS Appl. Mater. Interfaces, 2018, 10, 26851–26858 (ref. 92). Copyright 2018 American Chemical Society. (B) Schematic showing experimental procedures and assay methods. Reprinted from ref. 96 with permission. | ||
Proteases are recognized as biomarkers of various diseases. Lucas and his co-workers reported a MEF-based ‘turn-off’ assay for proteolytic enzymes using a nano-silvered 96-well plate. And the use of fluorescein isothiocyanate-labeled YebF protein as a coating layer for the enzymatic activity assay using trypsin as the model enzyme was demonstrated (as shown in Fig. 14B).96 A detection limit of 1.89 ng was achieved, corresponding to 10% fluorescence quenching. However, the present work needed lengthy incubation times and washing steps, and they also put forward that the overall assay time might be shortened via a microwave-accelerated MEF technology in the future assay design.
3.4 ATP detection
Adenosine triphosphate (ATP), as a typical energy storage molecule, can transport chemical energy for cellular metabolism processes. It is an important biomarker for disease diagnosis. Compared to electrochemical and colorimetric methods, fluorescent sensors exhibit the ability to measure ATP in real-time. However, lower detection limits of the present fluorescence methods for ATP are still at ranges of millimolar to micromolar. Developing ATP fluorescent sensors with high sensitivity and stability is highly desirable, which can be realized by combining MEF with fluorescence methods (as summarized in Table 7). And we will review these advances in this part.| MEF sensors | Fluorophores used | Target analytes | Relative merits (LOD refers to the limit of detection) |
|---|---|---|---|
| Ag@SiO2 NPs core–shell structure120 | PG | ATP | LOD of 14.2 nM; a wide detection range |
| Gold nanorods164 | IR dye 800CW | ATP | LOD of 10 and 0.634 nM; successfully applied to detect ATP in rat brain |
| Silver island films (SIFs)151 | PG | ATP and thrombin | LOD of 1.3 and 0.073 nM, and linear detection ranges from 10 nM to 100 μM and 0.1 nM to 100 nM in the logarithmic scale for ATP and thrombin respectively |
Song and his co-workers presented a label-free aptasensor by using the Ag@SiO2 NPs core–shell structure and the common nucleic acid stain PicoGreen (PG) as a fluorescent indicator, for highly sensitive and selective detection of ATP in aqueous solutions (see Fig. 15A).120 A significant fluorescence reduction was observed in the presence of ATP, as a result of the aptamer release from the complementary DNA (cDNA)/aptamer duplexes confined on the Ag@SiO2 NP surface.120 And this aptasensor achieved a wide linear detection range for ATP with a detection limit of 14.2 nM, exhibiting its excellent assay performances. This work may provide new avenues for assembly of MEF-based label-free biosensors.
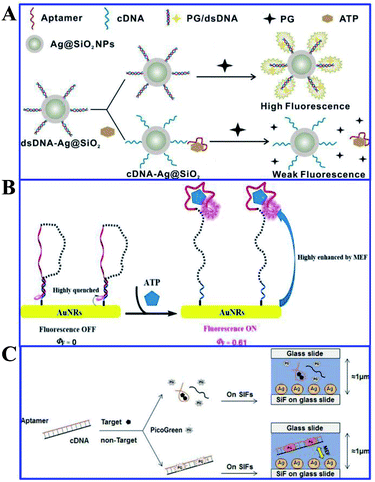 | ||
| Fig. 15 (A) Schematic illustration of the sensing procedure for ATP detection. Reprinted from ref. 120 with permission. (B) Schematic illustration of the MEF-based NIR fluorescence detection of ATP. Reprinted TOC figure with permission from Manli Yu, Yishan Yao, Bo Cui, Changjiao Sun, Xiang Zhao, Yan Wang, Guoqiang Liu, Haixin Cui and Zhanghua Zeng, ACS Appl. Nano Mater., 2019, 2, 48–57 (ref. 164). Copyright 2019 American Chemical Society. (C) Schematic illustration of the universal and label-free sensing mechanisms via target-induced aptamer conformational changes and MEF effects of SIFs. Reprinted from ref. 151 with permission. | ||
| MEF sensors | Fluorophores used | Target analytes | Relative merits (LOD refers to the limit of detection) |
|---|---|---|---|
| Au@SiO2 based core–shell nanostructures56 | TCPP | PPi | LOD of 8.20 × 10⁻⁷ M; cell imaging |
| Au NBPs + SiO2 (ref. 62) | NIR dyes | PPi and microRNA | LOD of 80 nM and 8.4 pM respectively |
| ZnSa NW–Ag NP 1D hybrid nanostructure51 | DA | DA | LOD of 3 nM; excellent selectivity and long-term stability |
| Molecularly imprinted core–shell Ag@SiO2 NPs99 | RF | RF | Molecular imprinting combined with MEF |
| Au@SiO2 NPs106 | BSNVA | PrPSc | LOD of 10 pM; monitoring protein conformational conversion in human serum samples |
Near-infrared fluorescence (NIR) is extensively used in biological fields for its high penetration, low photothermal damage and immunity from autofluorescence. However, common NIR fluorophores suffer from low quantum efficiency. As optical antennas with anisotropic nanostructures have been widely used in the field of MEF, Yu and her co-workers developed a NIR based MEF platform of functionalized gold nanorods for the bioassay of ATP.164 As shown in Fig. 15B, in the absence of ATP, the self-hybridized DNA sequence brought the IR dye 800CW close to the AuNR surface, which resulted in a ‘fluorescence off’ state, while the presence of ATP could disrupt this self-hybridization and push IR dye 800CW away from the AuNR surface, as a result of its higher specific affinity with the aptamer moiety. A low detection limit of 0.634 nM was obtained for ATP as a result of the greatly enhanced quantum efficiency of IR dye 800CW from 0 to 0.61. The biosensor was also successfully applied to detect low levels of ATP in rat brain, demonstrating its applicability for monitoring intracellular ATP.
Aptamers are a kind of recognition molecule composed of single-stranded nucleic acid that folds into special 3-D structures, and can specifically bind to targets with high affinity.165 They have advantages of low molecular weight, high stability and ease of chemical synthesis compared to antibodies. Thus Song and his co-workers developed a label-free fluorescence aptasensor for highly sensitive and selective detection of ATP and thrombin, with PicoGreen (PG) used as a signal molecule and silver island films (SIFs) as MEF substrates for signal enhancers.120 PG fluorescence can be magnified by SIFs without ATP or thrombin, as shown in Fig. 15C. However, with the presence of ATP or thrombin, as the aptamers underwent structure switching, PG fluorescence intensity was reduced. And detection limits of 1.3 nM and 0.073 nM were obtained for ATP and thrombin respectively using this method. ATP and thrombin could be linearly detected in ranges from 10 nM to 100 μM and 0.1 nM to 100 nM in the logarithmic scale, respectively. And this aptamer can also be reliably used for ATP measurements in biological samples.
3.5 Detection of other biomolecules
Besides applications in immunoassays, RNA/DNA, enzyme and ATP detection, fluorescence detection of other biomolecules such as PPi, dopamine (DA) and riboflavin (RF) using MEF has rapidly developed, and we will summarize these recent reports in this section (Table 8).Based on a similar sensing mechanism for Cu2+, PPi and PPase previously referred to in ref. 56, another two Au@SiO2 based core–shell nanostructures composed of Au nanorods (NRs) and elongated gold nanobipyramids (Au NBPs) encapsulated by SiO2 were reported and used for NIR detection of PPi,60,62 which is closely related to the DNA replication process and the genetic information expression. As shown in Fig. 16A, meso-tetra(4-carboxyphenyl)porphyrin (TCPP) molecules were covalently immobilized onto the outer shell surface of the AuNR@SiO2.60 As a result of the strong affinity between Cu2+ and PPi, the turn-off state of TCPP-Cu2+ can be disassembled, and fluorescence was recovered. Combined with the MEF imparted by AuNRs, a detection limit of 8.20 × 10⁻⁷ M PPi was realized. Cell imaging using this sensor was also realized, proving its potential applications in biological mechanism studies.
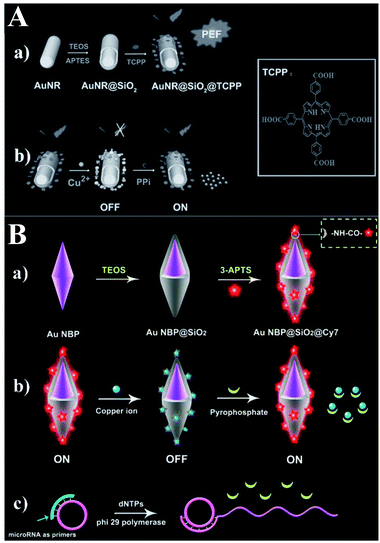 | ||
| Fig. 16 (A) Schematic showing the (a) preparation processes of PEF-based core–shell AuNR@SiO2@TCPP NPs, and (b) the sensing mechanism of the MEF-based core–shell AuNR@SiO2@TCPP NPs for PPi. Reprinted from ref. 60 with permission. (B) Schematic showing (a) the synthesis processes of Au NBP@SiO2@Cy7 NPs and the detection mechanisms for (b) PPi and (c) microRNA. Reprinted Scheme 1 with permission from Caixia Niu, Quanwei Song, Gen He, Na Na and Jin Ouyang, Anal. Chem., 2016, 88, 11062–11069 (ref. 62). Copyright 2016 American Chemical Society. | ||
Both experiments and theoretical simulations indicate that Au NBPs can induce signal enhancement several times higher than that of Au NRs with similar longitudinal plasmon resonance wavelength. Thus Niu and her co-workers demonstrated a novel NIR MEF system composed of an elongated gold nanobipyramid (Au NBP) antenna core, a silica shell and a NIR dye (see Fig. 16B).62 The largely enhanced fluorescence could be quenched by Cu2+ and further recovered by PPi, owing to the stronger affinity between Cu2+ and PPi. And this provided a method for ‘switch-on’ detection of PPi with a limit of 80 nM in aqueous solutions.
Furthermore, the probe was used for microRNA detection with a low detection limit of 8.4 pM.62
Dopamine (DA) acting as an important neurotransmitter has always been a bioresearch focus. Yang and his co-workers fabricated a novel zinc–salophen (ZnSa) complex nanowire (NW)–Ag NP 1D hybrid nanostructure. Narrow gaps between the Ag NPs, acting as optical antennas that can produce a largely enhanced electrical field for signal amplification, are shown in Fig. 17a. Thus sensing occurring at these nanogaps can realize improved performance. The specific binding of DA with ZnSa NWs realized DA selective detection, while the introduction of Ag NPs induced a substantially improved performance for DA detection via remarkable fluorescence enhancements. And a detection limit as low as 3 nM was obtained. Excellent selectivity and long-term stability of the hybrid nanostructure were also predicted in the article.51
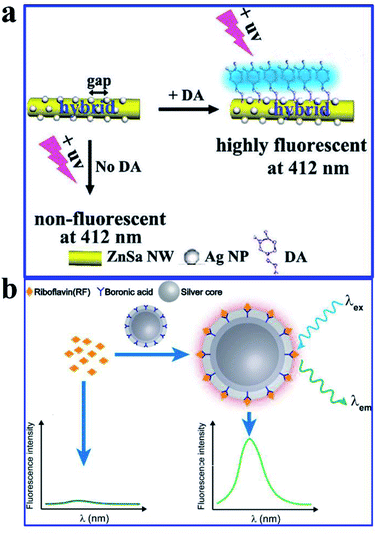 | ||
| Fig. 17 (a) Schematic illustration of the hybrid that can improve DA fluorescence detection, λem = 350 nm. Reproduced from ref. 51 with permission from the Royal Society of Chemistry. (b) Schematic showing the preparation processes and sensing mechanisms of the molecularly imprinted core–shell Ag@SiO2 NPs for the fluorescence assay. Reprinted from ref. 99 with permission. | ||
Molecularly imprinted polymers (MIPs) are a kind of biomimetic receptor, synthesized through polymerization reactions in the presence of a template molecule. They are tailor-made for target molecules, and have antibody-like specific binding properties.166 Herein, He and his co-workers reported a molecularly imprinted core–shell Ag@SiO2 NP for sensitive and specific MEF assay of riboflavin (RF),99 as shown in Fig. 17b. Their work might pave the way for sensitive and specific MEF assays based on molecularly imprinted plasmonic nanostructures.
Aggregation-induced emission (AIE) molecules, which are non-emissive in the dissolved state while highly fluorescent in the aggregated state, have advantages of a large Stokes' shift, excellent photostability, and high signal-to-noise ratio.167 Thus Cui and her co-workers developed a MEF sensor based on AIE molecules for monitoring protein conformational changes.106 A water-miscible sulfonate salt of 9,10-bis(2-(6-sulfonaphthalen-2-yl)vinyl)anthracene (BSNVA) with excellent AIE properties was introduced into the MEF system to prepare the MEF-AIE sensor, using a PrP aptamer as the bridge (as schematically shown in Fig. 18). When mixed with cellular prion protein (PrPc), the MEF-AIE sensor is almost non-emissive, while brightly fluorescent when mixed with disease-associated prion protein (PrPSc). Thus protein conformational conversion can be monitored through this PEF–AIE sensor. And a detection limit of 10 pM lower than that of the traditional AIE probe has been achieved in human serum samples.106 This work realized signal amplification without labeling, and also provided new insights for protein detection and conformational monitoring.
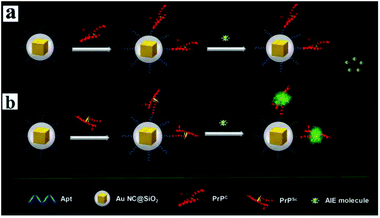 | ||
| Fig. 18 Schematic illustration of the MEF sensor based on AIE molecules for the detection of (a) PrPC and (b) PrPSc. Reprinted from ref. 106 with permission. | ||
4 Conclusions and prospects
In this review, we summarized the recent key advances of MEF-based fluorescence sensing, including design, synthesis, assembly and applications of both solution-based colloidal NPs and plasmonic chip platforms. So far, applications of MEF-based fluorescence sensing are at varying degrees of progress. In general, both environmental detection and bioanalysis of special target analytes using plasmonic MEF have been extensively studied, and much lower detection limits and more reliable results have been achieved. Future work may focus on improving the selectivity and anti-interference performance of sensors, which could be realized by combining MEF-based fluorescence with other techniques including SERS, colorimetric methods, molecular imprinting and even immunoassays or aptasensor techniques. In particular, especially for bioassays, as there are usually more than one biomarker that can diagnose early stages of special diseases, we forecast that multiplexed assays using protein and nucleic acid could be a promising development direction. Furthermore, by preparing heteronanocomposite plasmonic nanostructures, owing to the synergistically enhanced optical properties of individual components and new features arising from the integrated systems, unexpected or improved sensing performances may be realized.168 Lastly, integration of plasmonic MEF fluorescence sensing with portable platforms, such as wearable devices and microfluidics has always been the goal of current research, which would greatly accelerate transformations from conventional benchtop assays to powerful point-of-care tests. However, challenges still remain for its implementation, and we expect that this goal can be achieved in the near future.Conflicts of interest
There are no conflicts to declare.Acknowledgements
This work was supported by the National Natural Science Foundation of China (Grant No. U19A2093) and the open fund for Discipline Construction, Institute of Physical Science and Information Technology, Anhui University.Notes and references
- S. Eustis and M. A. El-Sayed, Chem. Soc. Rev., 2006, 35, 209 RSC
.
- C. D. Geddes and J. R. Lakowicz, J. Fluoresc., 2002, 12, 2 Search PubMed
.
- Y. Zhang, L. Zhang, L. Yang, C. I. Vong, K. F. Chan, W. K. K. Wu, T. N. Y. Kwong, N. W. S. Lo, M. Ip and S. H. Wong,
et al.
, Sci. Adv., 2019, 5, eaau9650 CrossRef PubMed
.
- A. Camposeo, L. Persano, R. Manco, Y. Wang, P. Del Carro, C. Zhang, Z. Y. Li, A. Pisignano and Y. Xia, ACS Nano, 2015, 9, 10047 CrossRef CAS PubMed
.
- D. Kim, K. Jeong, J. E. Kwon, H. Park, S. Lee, S. Kim and S. Y. Park, Nat. Commun., 2019, 10, 3089 CrossRef
.
- F. A. Cheng, D. Johnson, Y. Tsai, P. H. Su, S. Hu, J. G. Ekerdt and C. K. Shih, ACS Photonics, 2017, 4, 1421 CrossRef CAS
.
- R. Berera, I. H. M. van Stokkum, J. T. M. Kennis, R. van Grondelle and J. P. Dekker, Chem. Phys., 2010, 373, 65 CrossRef CAS
.
- M. Wang, G. Meng and Q. Huang, Sens. Actuators, B, 2015, 209, 237 CrossRef CAS
.
- M. Wang and G. Meng, Sens. Actuators, B, 2017, 243, 1137 CrossRef CAS
.
- J. Langer, S. M. Novikov and L. M. Liz-Marzán, Nanotechnology, 2015, 26, 322001 CrossRef PubMed
.
- H. Chen, G. C. Schatz and M. A. Ratner, Rep. Prog. Phys., 2012, 75, 096402 CrossRef PubMed
.
- H. Malekzad, P. S. Zangabad, H. Mirshekari, M. Karimi and M. R. Hamblin, Nanotechnol. Rev., 2017, 6, 301 CAS
.
- M. Li, S. K. Cushing and N. Wu, Analyst, 2015, 140, 140386 Search PubMed
.
- A. K. Tobias and M. Jones, J. Phys. Chem. C, 2019, 123, 1389 CrossRef CAS
.
- Y. Jeong, Y. Kook, K. Lee and W. Koh, Biosens. Bioelectron., 2018, 111, 102 CrossRef CAS PubMed
.
- W. Deng, F. Xie, H. T. M. C. M. Baltar and E. M. Goldys, Phys. Chem. Chem. Phys., 2013, 15, 15695 RSC
.
- W. Gan, C. Tserkezis, Q. Cai, A. Falin, S. Mateti, M. Nguyen, I. Aharonovich, K. Watanabe, T. Taniguchi and F. Huang,
et al.
, ACS Nano, 2019, 13, 12184 CrossRef CAS PubMed
.
- Y. Yan, L. Meng, W. Zhang, Y. Zheng, S. Wang, B. Ren, Z. Yang and X. Yan, ACS Sens., 2017, 2, 1369 CrossRef CAS PubMed
.
- J. R. Lakowicz, K. Ray, M. Chowdhury, H. Szmacinski, Y. Fu, J. Zhang and K. Nowaczyk, Analyst, 2008, 133, 1308 RSC
.
- C. D. Geddes, Phys. Chem. Chem. Phys., 2013, 15, 19537 RSC
.
- O. G. Tovmachenko, C. Graf, D. J. van den Heuvel, A. van Blaaderen and H. C. Gerritsen, Adv. Mater., 2006, 18, 91 CrossRef CAS
.
- P. M. R. Paulo, D. Botequim, A. Jóskowiak, S. Martins, D. M. F. Prazeres, P. Zijlstra and S. M. B. Costa, J. Phys. Chem. C, 2018, 122, 10971 CrossRef CAS
.
- S. Derom, A. Berthelot, A. Pillonnet, O. Benamara, A. M. Jurdyc, C. Girard and G. Colas des Francs, Nanotechnology, 2013, 24, 495704 CrossRef CAS PubMed
.
- W. Deng and E. M. Goldys, Langmuir, 2012, 28, 10152 CrossRef CAS PubMed
.
- J. Xu, B. Zhang, L. Jia, N. Bi and T. Zhao, J. Hazard. Mater., 2020, 386, 121630 CrossRef CAS PubMed
.
- W. Deng, D. Jin, K. Drozdowicz-Tomsia, J. Yuan, J. Wu and E. M. Goldys, Adv. Mater., 2011, 23, 4649 CrossRef CAS PubMed
.
- H. Li, J. Yang, Q. Deng, S. Dou, W. Zhao, C. Lin and X. Liu, Sci. China Mater., 2018, 61, 401 CrossRef CAS
.
- Y. L. Deng, D. D. Xu, D. W. Pang and H. W. Tang, Nanotechnology, 2017, 28, 065501 CrossRef PubMed
.
- Y. Liu, C. Liu, Z. Zhang, W. Yang and S. Nie, J. Mater. Chem. C, 2015, 3, 2881 RSC
.
- K. Munechika, Y. Chen, A. F. Tillack, A. P. Kulkarni, I. J. L. Plante, A. M. Munro and D. S. Ginger, Nano Lett., 2010, 10, 2598 CrossRef CAS PubMed
.
- C. M. Cobley, S. E. Skrabalak, D. J. Campbell and Y. Xia, Plasmonics, 2009, 4, 171 CrossRef CAS
.
- K. Ray, R. Badugu and J. R. Lakowicz, J. Am. Chem. Soc., 2006, 128, 8998 CrossRef CAS PubMed
.
- B. C. Marin, S. W. Hsu, L. Chen, A. Lo, D. W. Zwissler, Z. Liu and A. R. Tao, ACS Photonics, 2016, 3, 3526 CrossRef
.
- L. Zhang, Y. Song, T. Fujita, Y. Zhang, M. Chen and T. H. Wang, Adv. Mater., 2014, 26, 1289 CrossRef CAS PubMed
.
- Y. Fu, J. Zhang and J. R. Lakowicz, Chem. Commun., 2009, 313–315 RSC
.
- Y. Zhang and H. Goncalves, Chem. Commun., 2011, 47, 5313 RSC
.
- H. Yina, J. Yia, Z. W. Yang, Z. Y. Xu, S. J. Xie, L. Li, C. Y. Li, J. Xu, H. Zhang and S. J. Zhang,
et al.
, Nano Energy, 2017, 42, 232 CrossRef
.
- D. D. Xu, C. Liu, C. Y. Li, C. Y. Song, Y. F. Kang, C. B. Qi, Y. Lin, D. W. Pang and H. W. Tang, ACS Appl. Mater. Interfaces, 2017, 9, 37606 CrossRef CAS
.
- K. T. Shimizu, W. K. Woo, B. R. Fisher, H. J. Eisler and M. G. Bawendi, Phys. Rev. Lett., 2002, 89, 117401 CrossRef CAS PubMed
.
- K. Ray, R. Badugu and J. R. Lakowicz, J. Am. Chem. Soc., 2006, 128, 8998 CrossRef CAS PubMed
.
- K. Ray, R. Badugu and J. R. Lakowicz, Langmuir, 2006, 22, 8374 CrossRef CAS PubMed
.
- J. Chen, D. Wang, J. Xi, L. Au, A. Siekkinen, A. Warsen, Z. Y. Li, H. Zhang, Y. Xia and X. Li, Nano Lett., 2007, 7, 1318 CrossRef CAS PubMed
.
- K. Takemura, O. Adegoke, N. Takahashi, T. Kato, T. C. Li, N. Kitamoto, T. Tanaka, T. Suzuki and E. Y. Park, Biosens. Bioelectron., 2017, 89, 998 CrossRef CAS PubMed
.
- G. Hong, S. M. Tabakman, K. Welsher, H. Wang, X. Wang and H. Dai, J. Am. Chem. Soc., 2010, 132, 15920 CrossRef CAS PubMed
.
- J. K. Kim and D. Jang, J. Mater. Chem. C, 2017, 5, 6037 RSC
.
- D. D. Xu, B. Zheng, C. Y. Song, Y. Lin, D. W. Pang and H. W. Tang, Sens. Actuators, B, 2019, 282, 650 CrossRef CAS
.
- H. Zhang, Y. Li, I. A. Ivanov, Y. Qu, Y. Huang and X. Duan, Angew. Chem., Int. Ed., 2010, 49, 2865 CrossRef CAS PubMed
.
- H. Li, X. Huang, M. M. Hassan, M. Zuo, X. Wu, Y. Chen and Q. Chen, Microchem. J., 2020, 154, 104563 CrossRef CAS
.
- W. M. E. Mu, M. Daniyal, Y. W. Fen, N. A. A. Anas, N. A. S. Omar, N. S. Md Ramdzan, H. Nakajima and M. A. Mahdi, RSC Adv., 2019, 9, 41729 RSC
.
- T. Jin, Y. Zhang, Y. Li, W. Jing, Y. Li, L. Fan and X. Li, Talanta, 2019, 200, 242 CrossRef CAS PubMed
.
- Y. Chen, J. Yang, X. Ou and X. Zhang, Chem. Commun., 2012, 48, 5883 RSC
.
- H. Rajbongshi, A. Sarkar, P. Phukan, S. Bhattacharjee and P. Datta, J. Mater. Sci.: Mater. Electron., 2019, 30, 5580 CrossRef CAS
.
- Q. Zeng, L. Ye, L. Ma, W. Yin, T. Li, A. Liang and Z. Jiang, Luminescence, 2015, 30, 303 CrossRef CAS PubMed
.
- H. Wang, X. Si, T. Wu and P. Wang, Open Chem., 2019, 17, 884 CAS
.
- H. Li, Q. Chen, M. M. Hassan, Q. Ouyang, T. Jiao, Y. Xu and M. Chen, Anal. Chim. Acta, 2018, 1018, 94 CrossRef CAS PubMed
.
- D. D. Xu, B. Zheng, C. Y. Song, Y. Lin, D. W. Pang and H. W. Tang, Sens. Actuators, B, 2019, 282, 650–658 CrossRef CAS
.
- K. Kołątaj, J. Krajczewski and A. Kudelski, Chem. Lett., 2020, 18, 529 CrossRef
.
- Z. Bai, R. Chen, P. Si, Y. Huang, H. Sun and D. H. Kim, ACS Appl. Mater. Interfaces, 2013, 5, 5856 CrossRef CAS PubMed
.
- Y. l. Liu, N. Kang, X. Ke, D. Wang, L. Ren and H. Wang, RSC Adv., 2016, 6, 27395 RSC
.
- L. Wang, Q. Song, Q. Liu, D. He and J. Ouyang, Adv. Funct. Mater., 2015, 25, 7017 CrossRef CAS
.
- J. Liu, S. Li and V. R. Bhethanabotla, ACS Sens., 2018, 3, 222 CrossRef CAS PubMed
.
- C. Niu, Q. Song, G. He, N. Na and J. Ouyang, Anal. Chem., 2016, 88, 11062 CrossRef CAS PubMed
.
- N. Sui, K. Wang, L. Wang, F. Xie, T. Li, Q. Bai, D. Zhang, M. Liu and W. W. Yu, Sens. Actuators, B, 2017, 245, 568–573 CrossRef CAS
.
- S. Xiong, Y. Deng, Y. Zhou, D. Gong, Y. Xu, L. Yang, H. Chen, L. Chen, T. Song and A. Luo, Anal. Methods, 2018, 10, 5468 RSC
.
- Y. P. Huang, S. C. Huang, X. J. Wang, N. Bodappa, C. Y. Li, H. Yin, H. S. Su, M. Meng, H. Zhang and B. Ren,
et al.
, Angew. Chem., Int. Ed., 2018, 57, 7523–7527 CrossRef CAS
.
- K. Aslan, I. Gryczynski, J. Malicka, E. Matveeva, J. R. Lakowicz and C. D. Geddes, Curr. Opin. Biotechnol., 2005, 16, 55 CrossRef CAS PubMed
.
- K. Tawa, S. Yamamura, C. Sasakawa, I. Shibata and M. Kataoka, ACS Appl. Mater. Interfaces, 2016, 8, 29893 CrossRef CAS PubMed
.
- K. Tawa, C. Yasui, C. Hosokawa, H. Aota and J. Nishii, ACS Appl. Mater. Interfaces, 2014, 6, 20010 CrossRef CAS PubMed
.
- Q. Hao, F. Yang, Y. Yin, L. Si, K. Long, Z. Xiao, T. Qiu and P. K. Chu, J. Phys. D: Appl. Phys., 2013, 46, 495302 CrossRef
.
- H. Zhang, Y. Wang, H. Zhong, J. Li and C. Ding, ACS Appl. Bio Mater., 2019, 2, 5012 CrossRef CAS
.
- L. Jing, C. Yang, P. Zhang, J. Zeng, Z. Li and M. Gao, View, 2020, 1, e19 Search PubMed
.
- J. Dostálek and W. Knoll, Biointerphases, 2008, 3, FD12 CrossRef PubMed
.
- H. K. Naa, J. S. Wia, H. Y. Sonb, J. G. Okc, Y. M. Huhb and T. G. Lee, Biosens. Bioelectron., 2018, 113, 39 CrossRef PubMed
.
- B. J. Yun, J. E. Kwon, K. Lee and W. G. Koh, Sens. Actuators, B, 2019, 284, 140 CrossRef CAS
.
- S. H. Cao, W. P. Cai, Q. Liu, K. X. Xie, Y. H. Weng and Y. Q. Li, Chem. Commun., 2014, 50, 518 RSC
.
- E. Matveeva, Z. Gryczynski, J. Malicka, I. Gryczynski and J. R. Lakowicz, Anal. Chim. Acta, 2018, 1018, 94 CrossRef
.
- Y. Q. Li, L. Y. Guan, H. L. Zhang, J. Chen, S. Lin, Z. Y. Ma and Y. D. Zhao, Anal. Chem., 2011, 83, 4103 CrossRef CAS
.
- W. Deng, K. Drozdowicz-Tomsia, D. Jin and E. M. Goldys, Anal. Chem., 2009, 81, 7248 CrossRef CAS PubMed
.
- G. Hawaa, L. Sonnleitnera, A. Missbichlera, A. Prinzb, G. Bauerb and C. Mauracher, Anal. Biochem., 2018, 549, 39–44 CrossRef PubMed
.
- K. Tawa, F. Kondo, C. Sasakawa, K. Nagae, Y. Nakamura, A. Nozaki and T. Kaya, Anal. Chem., 2015, 87, 3871–3876 CrossRef CAS PubMed
.
- M. Toma and K. Tawa, ACS Appl. Mater. Interfaces, 2016, 8, 22032 CrossRef CAS PubMed
.
- Y. Wang, A. Brunsen, U. Jonas, J. Dostálek and W. P. Knoll, Anal. Chem., 2009, 81, 9625 CrossRef CAS
.
- K. Tawa, F. Kondo, C. Sasakawa, K. Nagae, Y. Nakamura, A. Nozaki and T. Kaya, Anal. Chem., 2015, 87, 3871 CrossRef CAS PubMed
.
- K. Tawa, M. Umetsu, H. Nakazawa, T. Hattori and I. Kumagai, ACS Appl. Mater. Interfaces, 2013, 5, 8628 CrossRef CAS
.
- K. Tawa, M. Satoh, K. Uegaki, T. Hara, M. Kojima, H. Kumanogoh, H. Aota, Y. Yokota, T. Nakaoki and M. Umetsu,
et al.
, Jpn. J. Appl. Phys., 2013, 52, 06GK01 CrossRef
.
- M. Tsuneyasu, C. Sasakawa, N. Naruishi, Y. Tanaka, Y. Yoshida and K. Tawa, Jpn. J. Appl. Phys., 2014, 53, 06JL05 CrossRef CAS
.
- A. Scholten, B. Menges, M. Juebner, M. A. Rothschild and K. Bender, Analyst, 2013, 138, 1705 RSC
.
- C. J. Huang, J. Dostalek, A. Sessitsch and W. Knoll, Anal. Chem., 2011, 83, 674 CrossRef CAS PubMed
.
- Y. F. Chang, K. C. Tsao, Y. C. Liu, Y. C. Chen, P. C. Yu, Y. C. Huang and C. Chou, J. Virol. Methods, 2015, 213, 151 CrossRef CAS PubMed
.
- Y. Wang, J. Dostalek and W. Knoll, Biosens. Bioelectron., 2009, 24, 2264 CrossRef CAS
.
- H. Park, A. Germini, S. Sforza, R. Corradini, R. Marchelli and W. Knoll, Biointerphases, 2006, 1, 113–122 CrossRef CAS
.
- S. Xu, L. Jiang, Y. Nie, J. Wang, H. Li, Y. Liu, W. Wang, G. Xu and X. Luo, ACS Appl. Mater. Interfaces, 2018, 10, 26851 CrossRef CAS PubMed
.
- N. Pourreza and M. Ghomi, Sens. Actuators, B, 2017, 251, 609 CrossRef CAS
.
- K. Ma, L. Lu, Z. Qi, J. Feng, C. Zhuo and Y. Zhang, Biosens. Bioelectron., 2015, 68, 648 CrossRef CAS PubMed
.
- B. D. Ventura, M. Gelzo, E. Battista, A. Alabastri, A. Schirato, G. Castaldo, G. Corso, F. Gentile and R. Velotta, ACS Appl. Mater. Interfaces, 2019, 11, 3753 CrossRef PubMed
.
- E. Lucas, R. Knoblauch, M. Combs-Bosse, S. E. Broedel Jr and C. D. Geddes, Spectrochim. Acta, Part A, 2020, 228, 117739 CrossRef CAS PubMed
.
- N. H. T. Tran, K. T. L. Trinh, J. H. Lee, W. J. Yoon and H. Ju, Small, 2018, 14, 1801385 CrossRef PubMed
.
- M. Peng, F. Sun, N. Na and J. Ouyang, Small, 2020, 16, 2000460 CrossRef CAS PubMed
.
- H. Muhammad, P. He, Z. Guo, Q. Peng, H. Lu and Z. Liu, Biosens. Bioelectron., 2019, 146, 111733 CrossRef PubMed
.
- Z. Mei and L. Tang, Anal. Chem., 2017, 89, 633 CrossRef CAS PubMed
.
- Y. Miron, P.
G. Charette and M. Grandbois, Biosens. Bioelectron., 2013, 50, 125 CrossRef PubMed
.
- V. Chabot, C. M. Cuerrier, E. Escher, V. Aimez, M. Grandbois and P. G. Charette, Biosens. Bioelectron., 2009, 24, 1667 CrossRef CAS PubMed
.
- K. Lee, L. D. Hahn, W. W. Yuen, H. Vlamakis, R. Kolter and D. J. Mooney, Adv. Mater., 2011, 23, H101 CrossRef CAS PubMed
.
- S. G. Roh, A. I. Robby, P. T. M. Phuong, I. Park and S. Y. In, Mater. Sci. Eng., C, 2019, 97, 613 CrossRef CAS PubMed
.
- E. Mauriz, P. Dey and L. M. Lechuga, Analyst, 2019, 144, 7105 RSC
.
- Y. Cui, C. Yuan, H. Tan, Z. Zhang, Y. Jia, N. Na and J. Ouyang, Adv. Funct. Mater., 2019, 29, 1807211 CrossRef
.
- F. D. Stefani, K. Vasilev, N. Bocchio, N. Stoyanova and M. Kreiter, Phys. Rev. Lett., 2005, 94, 023005 CrossRef CAS PubMed
.
- C. Valsecchi and A. G. Brolo, Langmuir, 2013, 29, 5638 CrossRef CAS PubMed
.
- N. S. Abadeer, M. R. Brennan, W. L. Wilson and C. J. Murphy, ACS Nano, 2014, 8, 8392 CrossRef CAS
.
- A. R. Guerrero and R. F. Aroca, Angew. Chem., Int. Ed., 2011, 50, 665 CrossRef CAS PubMed
.
- J. S. Pang, I. G. Theodorou, A. Centeno, P. K. Petrov, N. M. Alford, M. P. Ryan and F. Xie, ACS Appl. Mater. Interfaces, 2019, 11, 23083 CrossRef CAS
.
- P. K. Jain, X. Huang, I. H. El-Sayed and M. A. El-Sayed, Plasmonics, 2007, 2, 107 CrossRef CAS
.
- S. Ali, A. S. Sharma, W. Ahmad, M. Zareef, M. M. Hassan, A. Viswadevarayalu, T. Jiao, H. Li and Q. Chen, Crit. Rev. Anal. Chem., 2020, 1 CrossRef PubMed
.
- B. Yang, N. Lu, D. Qi, R. Ma, Q. Wu, J. Hao, X. Liu, Y. Mu, V. Reboud, N. Kehagias, C. M. S. Torres, F. Y. C. Boey, X. Chen and L. Chi, Small, 2010, 6, 1038 CrossRef CAS PubMed
.
- W. Li, J. Zhang, Y. Zhou and P. Zhang, Chem. Commun., 2011, 47, 5834 RSC
.
- K. Ray, R. Badugu, H. Szmacinski and J. R. Lakowicz, Chem. Commun., 2015, 51, 15023 RSC
.
- M. L. Viger, D. Brouard and D. Boudreau, J. Phys. Chem. C, 2011, 115, 2974 CrossRef
.
- X. Ji, C. Xiao, W. F. Lau, J. Li and J. Fu, Biosens. Bioelectron., 2016, 82, 240 CrossRef CAS PubMed
.
- Z. Shang, M. Wang, S. Pan, X. Sun, G. Shi, X. Yan, W. Ma and T. Jiao, Opt. Commun., 2019, 451, 345 CrossRef CAS
.
- Q. Song, M. Peng, L. Wang, D. He and J. Ouyang, Biosens. Bioelectron., 2016, 77, 237 CrossRef CAS
.
- W. Li, K. Ren and J. Zhou, TrAC, Trends Anal. Chem., 2016, 80, 486–494 CrossRef CAS
.
- S. Sarkar, B. Kanchibotla, J. D. Nelson, J. D. Edwards, J. Anderson, G. C. Tepper and S. Bandyopadhyay, Nano Lett., 2014, 14, 5973 CrossRef CAS PubMed
.
- K. Sugawa, T. Tamura, H. Tahara, D. Yamaguchi, T. Akiyama, J. Otsuki, Y. Kusaka, N. Fukuda and H. Ushijima, ACS Nano, 2013, 7, 9997 CrossRef CAS PubMed
.
- Y. Zhang, K. Aslan and M. J. R. Previte, Appl. Phys. Lett., 2007, 90, 173116 CrossRef
.
- J. Jiang, X. Wang, S. Li, F. Ding, N. Li, S. Meng, R. Li, J. Qi, Q. Liu and G. L. Liu, Nanophotonics, 2018, 7, 1517 CAS
.
- Y. Zhang, A. Dragan and C. D. Geddes, J. Phys. Chem. C, 2009, 113, 15811 CrossRef CAS
.
- R. Pribik, K. Aslan, Y. Zhang and C. D. Geddes, J. Phys. Chem. C, 2008, 112, 17969–17973 CrossRef CAS
.
- S. M. Fothergill, C. Joyc and F. Xie, Nanoscale, 2018, 10, 20914 RSC
.
- M. Bauch, K. Toma, M. Toma, Q. Zhang and J. Dostalek, Plasmonics, 2014, 9, 781–799 CrossRef CAS
.
- J. Krajczewski, K. Kolataj and A. Kudelski, RSC Adv., 2017, 7, 17559 RSC
.
- D. Darvill, A. Centeno and F. Xie, Phys. Chem. Chem. Phys., 2013, 15, 15709 RSC
.
- J. R. Lakowicz, Anal. Biochem., 2005, 337, 171 CrossRef CAS
.
- M. Achermann, J. Chem. Phys., 2010, 1, 2837 CAS
.
- C. W. Huang, H. Y. Lin, C. H. Huang, K. H. Lo, Y. C. Chang, C. Y. Liu, C. H. Wu, Y. Tzeng and H. C. Chui, Appl. Phys. Lett., 2013, 102, 053113 CrossRef
.
- J. Dong, Z. Zhang, H. Zheng and M. Sun, Nanophotonics, 2015, 4, 472 CAS
.
- Q. Cui, F. He, L. Li and H. Möhwald, Adv. Colloid Interface Sci., 2014, 207, 164 CrossRef CAS PubMed
.
- K. B. Jinesh, J. L. van Hemmen, M. C. M. van de Sanden, F. Roozeboom, J. H. Klootwijk, W. F. A. Besling and W. M. M. Kessels, J. Electrochem. Soc., 2011, 158, G21 CrossRef CAS
.
- K. Aslan, J. R. Lakowicz, H. Szmacinski and C. D. Geddes, J. Fluoresc., 2004, 14, 677 CrossRef CAS PubMed
.
- C. Hanske, M. N. Sanz-Ortiz and L. M. Liz-Marzán, Adv. Mater., 2018, 30, 1707003 CrossRef PubMed
.
- M. Saboktakin, X. C. Ye, S. J. Oh, S. H. Hong, A. T. Fafarman, U. K. Chettiar, N. Engheta, C. B. Murray and C. R. Kagan, ACS Nano, 2012, 6, 8758 CrossRef CAS PubMed
.
- M. Yi, D. Zhang, X. Wen, Q. Fu, P. Wang, Y. Lu and H. Ming, Plasmonics, 2011, 6, 213 CrossRef CAS
.
- T. Murakami, Y. Arima, M. Toda, H. Takiguchi and H. Iwata, Anal. Biochem., 2012, 421, 632 CrossRef CAS PubMed
.
- V. Srinivasan, A. U. Andar, Y. Kostov and G. Rao, Plasmonics, 2019, 14, 731 CrossRef
.
- S. Venkatesh, P. K. Badiya and S. S. Ramamurthy, Chem. Commun., 2015, 51, 7809 RSC
.
- F. Yu, B. Persson, S. Löfås and W. Knoll, Anal. Chem., 2004, 76, 6765 CrossRef CAS PubMed
.
- L. Zhou, F. Ding, H. Chen, W. Ding, W. Zhang and S. Y. Chou, Anal. Chem., 2012, 84, 4489 CrossRef CAS PubMed
.
- Z. Zhou, H. Huang, Y. Chen, F. Liu, C. Z. Huang and N. Li, Biosens. Bioelectron., 2014, 52, 367 CrossRef CAS
.
- W. Gan, C. Tserkezis, Q. Cai, A. Falin, S. Mateti, M. Nguyen, I. Aharonovich, K. Watanabe, T. Taniguchi and F. Huang,
et al.
, ACS Sens., 2016, 1, 826 CrossRef
.
- T. Yu and Q. Wei, Nano Res., 2018, 11, 5439 CrossRef PubMed
.
- J. Cao, T. Sun and K. T. V. Grattan, Sens. Actuators, B, 2014, 195, 332 CrossRef CAS
.
- K. Wang, J. Liao, X. Yang, M. Zhao, M. Chen, W. Yao, W. Tan and X. Lan, Biosens. Bioelectron., 2015, 63, 172 CrossRef CAS PubMed
.
- A. Kannegulla, Y. Liu, B. Wu and L. J. Cheng, J. Phys. Chem. C, 2018, 122, 770 CrossRef CAS
.
- W. Q. Lim and Z. Q. Gao, Nano Today, 2016, 11, 168 CrossRef CAS
.
- E. Bagheri, L. Ansari, E. Sameiyan, K. Abnous, S. M. Taghdisi, M. Ramezani and M. Alibolandi, Biosens. Bioelectron., 2020, 153, 112054 CrossRef CAS PubMed
.
- M. Wang and G. Meng, Sens. Actuators, B, 2017, 243, 1137 CrossRef CAS
.
- R. A. Alvarez-Puebla, N. Pazos-Perez and L. Guerrini, Appl. Mater. Today, 2018, 13, 1 CrossRef
.
- K. Golberg, A. Elbaz, Y. Zhang, A. I. Dragan, R. Marks and C. D. Geddes, J. Mater. Chem., 2011, 21, 6179 RSC
.
- L. Liang, F. Lan, S. Ge, J. Yu, N. Ren and M. Yan, Anal. Chem., 2017, 89, 3597 CrossRef CAS PubMed
.
- D. D. Xu, Y. L. Deng, C. Y. Li, Y. Lin and H. W. Tang, Biosens. Bioelectron., 2017, 87, 881 CrossRef CAS PubMed
.
- C. Yuan, Y. Deng, X. Li, C. Li, Z. Xiao and Z. Liu, Anal. Chem., 2018, 90, 8178 CrossRef CAS PubMed
.
- M. F. Elshal and J. P. McCoy, Methods, 2006, 38, 317 CrossRef CAS PubMed
.
- M. Schena, D. Shalon, R. W. Davis and P. O. Brown, Adv. Sci., 1995, 270, 467 CAS
.
- A. B. Zrimsek, N. Chiang, M. Mattei, S. Zaleski, M. O. McAnally, C. T. Chapman, A. Henry, G. C. Schatz and R. P. Van Duyne, Chem. Rev., 2017, 117, 7583 CrossRef CAS PubMed
.
- M. Yu, Y. Yao, B. Cui, C. Sun, X. Zhao, Y. Wang, G. Liu, H. Cui and Z. Zeng, ACS Appl. Nano Mater., 2019, 2, 48 CrossRef CAS
.
- A. D. Ellington and J. W. Szostak, Nature, 1992, 355, 850 CrossRef CAS PubMed
.
- L. X. Chen, X. Y. Wang, W. H. X. Lu, Q. Wu and J. H. Li, Chem. Soc. Rev., 2016, 45, 2137 RSC
.
- Y. Gao, G. Feng, T. Jiang, C. Goh, L. Ng, B. Liu, B. Li, L. Yang, J. Hua and H. Tian, Adv. Funct. Mater., 2015, 25, 2857 CrossRef CAS
.
- M. Ha, J. H. Kim, M. You, Q. Li, C. Fan and J. M. Nam, Chem. Rev., 2019, 119, 12208 CrossRef CAS PubMed
.
| This journal is © The Royal Society of Chemistry 2021 |

