On-chip determination of spermatozoa concentration using electrical impedance measurements
Loes I.
Segerink
*,
Ad J.
Sprenkels
,
Paul M.
ter Braak
,
Istvan
Vermes
and
Albert
van den Berg
BIOS - the Lab-on-a-Chip group, MESA+ Institute of Nanotechnology, University of Twente, P.O. box 217, 7500, AE Enschede, The Netherlands. E-mail: l.i.segerink@utwente.nl
First published on 4th February 2010
Abstract
In this article we describe the development of a microfluidic chip to determine the concentration of spermatozoa in semen, which is a main quality parameter for the fertility of a man. A microfluidic glass-glass chip is used, consisting of a microchannel with a planar electrode pair that allows the detection of spermatozoa passing the electrodes using electrical impedance measurements. Cells other than spermatozoa in semen also cause a change in impedance when passing the electrodes, interfering with the spermatozoa count. We demonstrate that the change in electrical impedance is related to the size of cells passing the electrodes, allowing to distinguish between spermatozoa and HL-60 cells suspended in washing medium. In the same way we are able to distinguish between polystyrene beads and spermatozoa. Thus, by adding a known concentration of polystyrene beads to a boar semen sample, the spermatozoa concentrations of seven mixtures are measured and show a good correlation with the actual concentration (R2-value = 0.97). To our knowledge this is the first time that the concentration of spermatozoa has been determined on chip using electrical impedance measurements without a need to know the actual flow speed. The proposed method to determine the concentration can be easily applied to other cells. The described on-chip determination of the spermatozoa concentration is a first step towards a microfluidic system for a complete quality analysis of semen.
Introduction
A first step in the treatment of a couple with an unfulfilled desire to have children is the assessment of the semen quality. One of the parameters assessed with a semen analysis is the spermatozoa concentration, whereby the generally accepted lower limit for fertile men is 20 × 106 mL−1.1 Visually counting the spermatozoa in semen by putting the semen into a counting chamber is the gold standard for this determination. This labor intensive method is replaced by a computer assisted semen analysis system in larger hospitals. The results of the manual test are often subjective and can hardly be compared between different laboratories,2 while the computer assisted semen analysis system is expensive and needs comprehensive quality control. In addition, only reliable results are obtained after analysis of at least three consecutive samples.3 To overcome the above mentioned problems of the current procedure, we present here a microfluidic chip that can be used by the man himself at convenient moments at home.In general, glass-based microfluidic chips are very well suited to analyze cells4,5 and for disposable diagnostic systems for medical purposes.6 In this paper we will focus on the detection of spermatozoa and the determination of spermatozoa concentration on chip using electrical impedance measurements. In order to determine the concentration of cells in suspensions electrical impedance measurements on chip have already been reported,7,8 however for a reliable result the volume fraction of the cells in the suspension needs to be high.9 Since the volume fraction of spermatozoa is low (0.1% for 20 × 106 mL−1), the cells need to be analyzed in a small measurement volume, also known as single cell analysis. One of the earliest reported single cell impedance measurements were performed by Coulter about 50 years ago.10 Later, Brotherton and Barnard used a so-called Coulter counter to estimate the human spermatozoa concentration, but it was only applicable for concentrations above 5 × 10⁶ mL−1.11
The need for analyzing smaller sample volumes and cost reduction resulted in the development of a microfabricated version of the Coulter counter. Previous studies showed that with two electrode pairs in a microchannel it is possible to discriminate among bead sizes, different cells and various phytoplankton, if the differential impedance variation between the two pairs was measured at two frequencies.12–15 Systems with top–bottom electrodes, measuring at only a single frequency, were also able to distinguish between bead sizes, even at a higher throughput.16 However, in none of these approaches concentrations larger than 2 × 10⁶ mL−1 were used12,14,16 and none of the reported systems was able to determine the concentration of the specimens in the fluid.
In some of the approaches micro-Coulter counters were used in combination with fluorescent detection.14,15 This miniaturized flow cytometer requires fluorescence labeling of the sample and thus additional preprocessing steps. With a classical flow cytometer, several semen parameters can be determined among which the spermatozoa concentration.17,18 By measuring the ratio of spermatozoa to added fluorospheres of a known concentration, the spermatozoa concentration can be calculated. In this paper we use a comparable method to determine the concentration of spermatozoa by using electrical impedance measurements. For a reliable result a significant difference in electrical impedance signal for the added beads and spermatozoa is required, but also for spermatozoa and the other cells, like leukocytes, present in semen. Without differentiation between leukocytes and spermatozoa, it gives rise to an overestimated concentration of spermatozoa, since it interferes with the count of spermatozoa. Furthermore, a high leukocyte concentration (>1 × 10⁶ mL−1) is an indication of infection and poor sperm quality1 and it is useful to obtain this additional information as well.
In this paper a microfluidic chip is described that is able to calculate the concentration of spermatozoa using electrical impedance measurements without knowing the actual flow speed. The electrical impedance is measured between two planar electrodes at a single frequency, enabling differentiation between polystyrene beads, spermatozoa and leukemia white blood cells (HL-60). First a theoretical description of the measurement cell is given, followed by a description of the chip design, the measurement setup and the various samples that have been used. Next the measurement results are described and discussed into detail. Finally some conclusions are given.
Theory
In Fig. 1(a) a simplified equivalent circuit model for the microfluidic device is given, consisting of two double layer capacitances (Cdl), an electrolyte resistance (Rel), a parasitic capacitance (Cpar) and the total lead resistance (Rlead). A typical bode plot of the equivalent circuit model is shown in Fig. 1(b). The interface phenomena at the electrodes can be simplified with a double layer capacitance, that influences the spectrum signal mainly at low frequencies13,15 as can be seen in the bode plot. For intermediate frequencies, a plateau is observed in the bode plot predominantly caused by the electrolyte resistance13 and for a smaller part by the lead resistance. The drop at high frequencies arises from the parasitic capacitance of the system, mainly caused by direct coupling between the two electrodes.19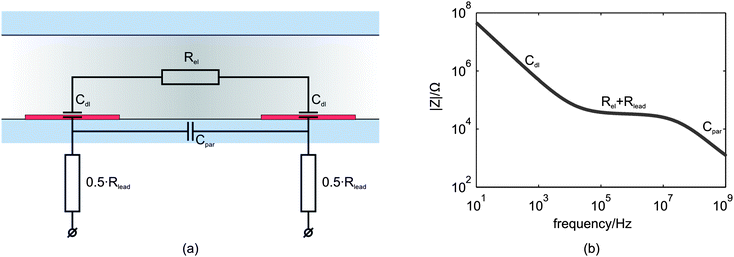 | ||
| Fig. 1 (a) The simplified equivalent circuit model of the microfluidic device without a particle or cell in the channel. The interface between the two planar electrodes and the electrolyte is represented by the double layer capacitance (Cdl). Rel is the electrolyte resistance, Rlead the lead resistance and Cpar is the parasitic capacitance. (b) Typical frequency response of the real electrical impedance of the equivalent circuit model. | ||
When a cell or particle enters the volume between the two electrodes, parts of the equivalent circuit model change. Such a particle or cell can also be represented with an equivalent circuit model consisting of linear elements, containing capacitances representing the cell membrane and a resistance corresponding to the cytoplasmatic conductivity.15,20 At frequencies below 1–3 MHz,9,12 cells and particles can be represented solely by the membrane capacitance, such that they behave like isolating spheres, resulting in a change in the effective electrolyte resistance as a particle or cell enters the measurement volume. This change is dependent on the cell size.12,21 Besides spermatozoa, semen also contains other cells, like leucocytes and macrophages.22 These cells are larger than spermatozoa; consequently a larger change in the electrical impedance may be measured at the resistive plateau making differentiation in cell size possible.
If the differentiation between beads and spermatozoa is possible, it can be used to calculate the concentration of spermatozoa (S) by adding a known concentration of beads (B) to the sample. Therefore the values of the measured electrical impedance changes need to be classified as ‘bead’ and ‘spermatozoon’. By counting the number of spermatozoa and beads in a sample, the concentration of spermatozoa can be calculated with the following expression:
 | (1) |
Method
Chip design and fabrication
A schematic diagram of the microfluidic chip is shown in Fig. 2. The glass-glass chip consists of a microchannel that tapers to a channel width of 38 μm at the electrode area. The change in electrical impedance caused by a cell or particle passing the electrodes is related to the volume at the electrode area. Therefore the depth of the channel is 18 μm, such that the volume is as small as possible without the risk of clogging of cells or particles. At the electrode area, two 200 nm thick and 20 μm wide platinum electrodes cross the channel with an interelectrode distance of 30 μm. Since the chip has planar electrodes, the fabrication process is rather easy. The microfluidic chips were made of two 500 µm 4′′ Borofloat glass substrates and the fabrication process is schematically shown in Fig. 3. In the top wafer, the microchannel was isotropically etched with HF using a chromium/gold mask and access holes were powder blasted from the backside. In the bottom wafer the (embedded) electrodes were formed by lift-off technique. First a 200 nm recess was etched with BHF using a photoresist mask. Then a 15 nm thick tantalum (Ta) adhesion layer and 180 nm thick platinum (Pt) layer was sputtered. At last the photoresist was stripped in acetone in an ultrasonic bath and the electrodes were formed. Finally the two glass wafers were bonded together using fusion bonding and annealed at 625 °C before dicing them into separate chips.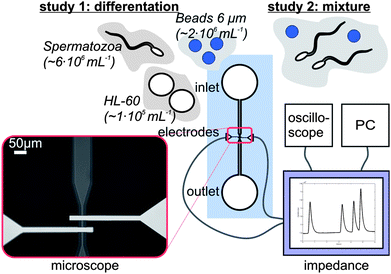 | ||
| Fig. 2 A schematic picture of the measurement set-up. The microfluidic chip is connected to the home-made impedance analyzer, which is connected to a PC and an oscilloscope. Visual inspection of the set-up is possible using an inverted microscope. Different samples are used for the two studies. | ||
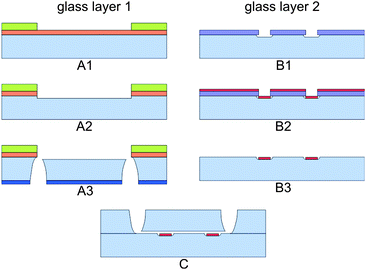 | ||
| Fig. 3 Schematic diagram of the fabrication process. Glass layer 1 is firstly sputtered with Cr and Au, which is subsequently coated with a resist. After several lithography steps (A1), the microchannel is made by isotropically etching (A2). Access holes were powder blasted (A3). On glass layer 2 first a lithography step is done (B1). Subsequently platinum is sputtered (B2) and the electrodes are created by lift-off (B3). Bonding of the two glass wafers (C) creates the chip. | ||
To determine the frequency behavior of the microfluidic chip filled with background electrolyte, a bode plot from 100 Hz to 40 MHz was made using a HP impedance/gainphase analyzer type HP4194A, controlled by LabVIEW (7 Express, version 7.0, 2003, National Instruments). With this result, the optimal measurement frequency within the resistive plateau for the successive experiments was determined.
Measurement set-up
All chips were measured in a chipholder that provides reliable electrical and fluidic connections to the chip. The samples were introduced by pipetting the sample in the inlet and outlet. By adjusting the heights of the fluid columns in both the inlet and outlet, a fluid flow was generated and controlled in the microchannel. The chip with chipholder was mounted on an inverted microscope (Leica DM IRM, Leica Microsystems, Wetzlar, GmbH, Germany) equipped with a computer controlled CCD camera, to make video images simultaneously with the electrical impedance measurements possible.The electrical impedance signal was measured at 96 kHz with a home-made measurement system, with a sampling rate of 400 Hz and a detection limit ((ΔR/R) below 0.005%. A simplified block diagram is given in Fig. 4. A sine wave signal of 96 kHz was created for the excitation of the sensor. A pick-up amplifier in the transimpedance mode converted the sensor current to a voltage, which was successively fed to a synchronous detector, a low-pass filter and an amplifier with an offset facility to suppress a possible DC bias and amplify the signal to increase the overall sensitivity. The final signal was fed to a PC for data capture and analysis using Matlab (R2007B, version 7.5.0.342, 2007, the Mathworks Inc). All detector electronics were contained in a small metal box in order to suppress noise. In the Matlab program all signals were converted into electrical impedance values, next the peaks in the signal were detected and their heights were calculated. The peak height is calculated as the maximum value minus the mean of the start and end point values of the peak (see Fig. 5(b)), such that the drift of the signal does not influence the analysis.
 | ||
| Fig. 4 A simplified electric block diagram of the home-made impedance measurement system. | ||
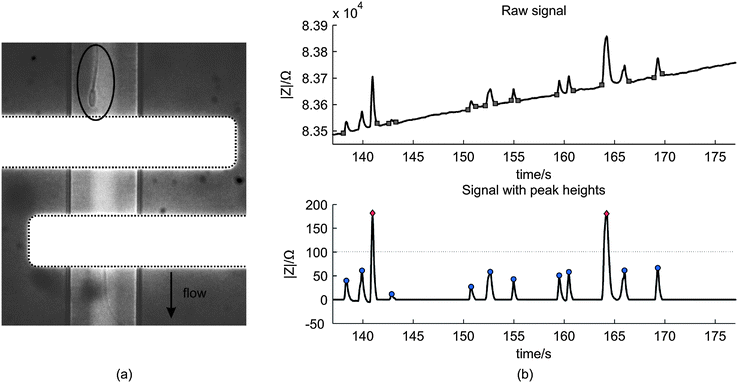 | ||
| Fig. 5 (a) A microscopic image of a spermatozoon passing the electrode pair (white horizontal stripes) (b) The above image shows an example of a raw impedance signal of the measurement with a spermatozoa concentration of 3.8 × 10⁶ mL−1. The squares indicate the start and end of the peaks and are used to calculate the peak heights. The image below shows the processed signal with the peak heights. For this measurement, the threshold was 100 Ω such that two peaks are classified as ‘beads’ (rhombus) and ten as ‘spermatozoon’ (circle). | ||
Samples
As background electrolyte Ferticult™ Flushing medium (chemically balanced salt solution, HEPES buffered with 0.4% HSA, purchased from Fertipro NV (Beernem, Belgium)) with a specific electrical conductivity of 1.4 S m−1 was used. This medium is generally used in hospitals to keep the spermatozoa after the necessary pre-processing steps. Polybead Polystyrene Blue Dyed beads with a diameter of 6 μm were used, obtained from Polysciences Inc (Warrington, Pennsylvania USA). Human promyelocytic leukaemia HL-60 cells of 10–15 μm were obtained from the German Collection of Microorganisms (Braunschweig, Germany) and were used as a substitute for the other cells present in semen. Equipment for tissue culture was obtained from Greiner Bio-One (Alphen a/d Rijn, the Netherlands). RPMI-1640 medium supplemented with 10% heat-inactivated Foetal Bovine Serum, 100 IU mL−1 penicillin, 100 μg mL−1 streptomycin, 2 mM L-glutamine and 0.4 μg mL−1 fungizone was used for cell culture and both medium, supplements as antibiotics were purchased from Lonza Group Ltd (Basel, Switzerland). Cell cultures were sustained in a 5% CO2 humidified atmosphere at 37 °C. Every 3–4 days the medium was refreshed and only exponentially growing cells were used for the experiments. From a local insemination centre of pigs, boar spermatozoa kept in Beltsville Thawning Solution (BTS) were obtained. This boar semen had some advantages with respect to human spermatozoa, since it can be stored for several days and it has certainly a good quality. Before the experiments, the semen was centrifuged at 600 g for 15 min. The supernatant was removed and the background electrolyte was added, such that it replaced the BTS. Typically the head of a boar spermatozoon has a length and width of 8 and 4 μm respectively.23 The head of a human spermatozoon is slightly smaller; it has a length of about 5–6 μm and a width of 2.5–3.5 μm.24 The volume of boar spermatozoa and human spermatozoa are between 20–29 μm3 and 15–25 μm3 respectively, that is in correspondence with the difference in dimensions.25 By comparison, the volume of polystyrene beads and HL-60 cells are 63–156 μm3 and 524–1767 μm3 respectively.Study 1: Differentiation of beads, spermatozoa and HL60 cells
In the first experiment HL-60 cells, diluted in washing medium with a concentration of about 1 × 10⁶ mL−1, were guided along the two electrodes and the electrical impedance change was measured. Subsequently the same experiment was done with boar spermatozoa (concentration of 6 × 10⁶ mL−1) and finally with 6 μm polystyrene beads (concentration of 2 × 10⁶ mL−1).Study 2: Determination of the concentration of spermatozoa
In the second study seven mixtures of polystyrene beads and spermatozoa, diluted in washing medium were made. The goal was to have a polystyrene bead concentration in every mixture of about 1 × 10⁶ mL−1 and a spermatozoa concentration varying from 2 × 10⁶–60 × 106 mL−1. Before the concentration of spermatozoa with help of the bead concentration could be determined, the actual concentrations needed to be known. Therefore 20 μL of both solutions was put into a Bürker counting chamber. However, since spermatozoa are motile, it was difficult to count cells immediately using a microscope. Therefore four images of different areas of the counting chamber were made and from these images both concentrations were calculated.Results and discussion
The frequency behavior of the microfluidic chip was investigated to ensure that the electrical impedance measurements were done at a frequency within the resistive plateau and below 1 MHz, since cells and beads act then as insulating particles.9,12Fig. 6 shows the averaged results of 50 impedance measurements of a chip filled with the background electrolyte for frequencies from 100 Hz to 40 MHz. Clearly, the influences of the double layer capacitance, electrolyte resistance and parasitic capacitance can be seen. Furthermore the measurement frequency of 96 kHz is in the resistive plateau and thus a good choice for detecting particles or cells passing the electrodes.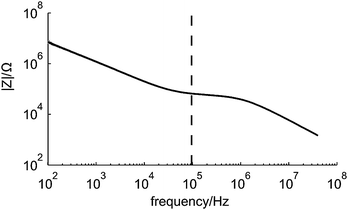 | ||
| Fig. 6 The measured frequency behaviour of the microfluidic chip. The black line in the graph is the average of 50 measurements obtained with the impedance/gainphase analyzer. The dashed line indicates the measurement frequency used during all subsequent experiments. | ||
Study 1: Differentiation of beads, spermatozoa and HL60 cells
A cell or bead passing the electrodes causes a change in the electrical impedance signal as observed from the results of the synchronization of the video images with the measurement data. As expected this change is an increase in the measured impedance, since the cells and beads acts as isolating particles at the used measurement frequency.9,12 In Fig. 5(a) a picture of a spermatozoon passing the electrode pair is given. Fig. 7 gives typical examples of the processed impedance signals (the drift is removed) when a HL-60 cell, a spermatozoon or a bead passes the electrodes. The peak heights of 52 HL-60 cells, 33 spermatozoa and 47 polystyrene beads have been determined. The average electrical impedance change and standard deviation have been calculated as 1730 ± 620 Ω, 240 ± 60 Ω and 27 ± 13 Ω for HL-60 cells, polystyrene beads and spermatozoa respectively, resulting in the 95% confidence intervals shown in Fig. 8. The measured impedance changes are in correspondence with the calculated changes for insulating particles with comparable dimensions as HL-60 cells, spermatozoa and 6 μm polystyrene beads in a measurement volume of 16.1 pL. Despite of the large distribution in peak height, the 95% confidence interval of the 6 μm beads lies well between the confidence limits of spermatozoa and HL-60 cells (dashed lines), as expected by their size. Since the confidence intervals do not overlap, it is possible to classify the cells and beads based on their respective measured peak heights. The large distribution can be decreased by using parallel electrodes instead of planar one, which will be investigate in future work. There is a trade off between the size difference of spermatozoa and polystyrene beads, but also between polystyrene beads and the other cells present in semen. Larger beads will improve the distinction between beads and spermatozoa, leading to less wrong classified peaks. However, if a semen sample contains leucocytes, larger beads will deteriorate the distinction between beads and these cells.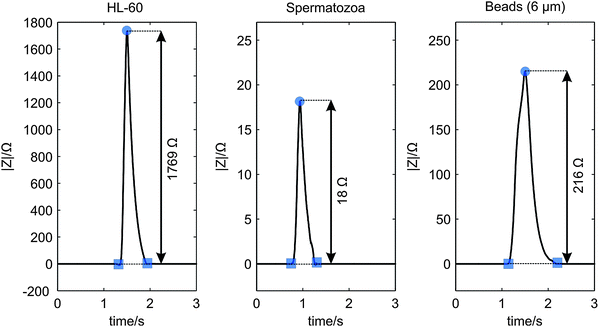 | ||
| Fig. 7 Measured examples of the processed impedance signal |Z| showing the peak heights, when a HL-60 cell (left), a spermatozoon (middle) and a 6 μm polystyrene bead (right) passed the electrode pair. | ||
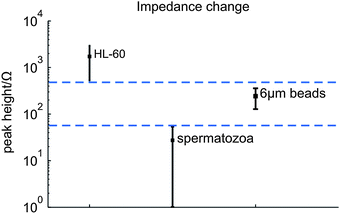 | ||
| Fig. 8 The averaged peak heights when HL-60 cells, spermatozoa and 6 μm polystyrene beads passed the electrode pair. The dashed lines show the higher and lower point of the 95% confidence intervals of HL-60 and spermatozoa respectively. | ||
Study 2: Determination of the concentration of spermatozoa
The concentrations of polystyrene beads and spermatozoa determined with the counting chamber ranged from 1.1 × 10⁶–2.7 × 10⁶ mL−1 and 2.1 × 10⁶–61.4 × 10⁶ mL−1 respectively. Assuming a random distribution of the cells and particles in the background electrolyte, the exact number of cells and particles in the volume follows a Poisson distribution.1 The standard deviation of this distribution is the square root of the number of beads or cells counted. Using this, the 95% confidence intervals were calculated for the concentrations of spermatozoa in the seven mixtures. The occurrence of two cells or beads in the measurement volume can also be estimated with the Poisson distribution.16 For a concentration of 27 × 106 mL−1 and a measurement volume of 16.1 pL, the probability of two cells or beads in the measurement volume is lower than 6.1%. Therefore, we did not take this into account for the calculation of the spermatozoa concentration using the microfluidic chip. Nonetheless, a spermatozoa concentration of 61.4 × 10⁶ mL−1 was also put into the chip. According to the Poisson distribution about 18% of the events counted should be two cells. However, during the measurements, this was not observed and the spermatozoa concentration calculated with the chip (59.3 × 10⁶ mL−1) is in agreement with the actual concentration. This can possibly be explained by a lower effective measurement volume than the calculated one as a result of the planar electrode configuration, resulting in a lower occurrence of two cells in the measurement volume. Additionally, the parabolic velocity profile can also have an effect, lowering the effective measurement volume.For every mixture, a threshold was chosen such that the sensitivity and specificity were the highest. Above the threshold, the peak is classified as bead and below as spermatozoon. The specificity and sensitivity for the seven mixtures was larger than 0.91 and 0.89 respectively. The flow rates during the measurements of the different mixtures ranges from 5–143 pL s−1. The thresholds were slightly different for the seven mixtures, caused by differences in flow velocity: at higher flow velocities, the threshold was lower. This can be explained by the low pass filter in the measurement system. At higher flow velocities the length of stay in the measurement volume is shorter, such that the peaks contain more high frequency components. With a low pass filter, high frequency components are suppressed, resulting in a lower measured peak value.
In Fig. 9 the results of the determination of the concentration of spermatozoa using the known concentration of polystyrene beads are given. Clearly the estimation of a spermatozoa concentration of 42 × 106 mL−1 is underestimated. During this measurement some clogging of spermatozoa was observed, leading to false classified peaks, since the peak heights of clogged spermatozoa were comparable with the peak heights of beads. Increasing the bead concentration decreases the influence of false detected beads. Another possible solution is to dilute the semen sample before the measurement. Since beads need to be added anyhow, this is easy and will decrease the clogging.
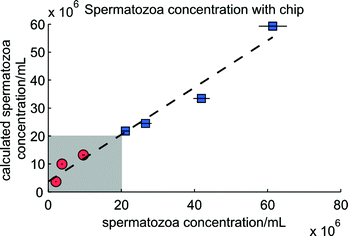 | ||
| Fig. 9 The determination of the concentration using the microfluidic chip. The circles and squares are the seven mixtures analyzed and the horizontal black lines are the 95% confidence intervals of the actual spermatozoa concentration. The expression of the dashed line is y = 0.84x + 3.70 × 10⁶ (R2 = 0.97). The grey area is the subfertile region, containing three mixtures (circles). The fertile area is above 20 × 106 mL−1, containing the other four mixtures (squares). | ||
In the seven experiments an average of 686 events in each experiment (spermatozoa + beads) were counted and classified for the calculation. There is a tendency in the amount of counted spermatozoa and counted events to the relative difference between both spermatozoa concentrations. The more counted events and spermatozoa, the better the estimation. The amount of counted beads does not show this relation, but a higher concentration of beads give better estimates of the concentration of spermatozoa (data not shown). Moreover, the determination of higher concentrations of spermatozoa with the microfluidic chip is better than for lower concentrations, in accordance with results obtained with the conventional flow cytometer.17
Currently, at least 200 spermatozoa are counted with the gold standard, leading to a percentage error of 7.7%,1 so for a concentration of 20 × 106 mL−1 the 95% confidence interval is 17 × 106 mL−1–23 × 106 mL−1. To achieve the same confidence level, the amount of beads that needs to be counted is calculated by taking the error propagation into account. For a spermatozoa and bead concentration of respectively 20 × 106 mL−1 and 2 × 10⁶ mL−1, at least 210 beads need to be counted with the chip. At bead concentrations comparable to the spermatozoa concentration, a minimum amount of events needs to be counted to obtain the same error, resulting in the lowest measurement time. With the conventional flow cytometry superimposable results for normal sperm concentrations were obtained when at least 10000 spermatozoa or 2000 fluorospheres were counted.17 The number of events counted with the chip is lower, due to the recording of video images and visual inspection afterwards. However the determination of the concentration agrees with the concentration determined with the counting chamber, and increasing the counted events will improve it. During the experiments the throughput was relatively slow (∼1.0 s−1), due to visual inspection. Theoretically up to 200 particles per second can be measured with the system. In case of a spermatozoa concentration of 20 × 106 mL−1 and a bead concentration of 2 × 10⁶ mL−1, the measurement takes minimally 12 s which is faster than the gold standard or computer assisted semen analysis systems that still require visual inspection by the lab technician.
The concentration determination is independent of the flow velocity. However, during the measurements at lower flow rates, it was observed that beads and spermatozoa tend to stick in the microchannel. This did not influence the calculation of the spermatozoa concentration in our case, but in future work it will be better to avoid this.
Conclusions
A microfluidic chip for the determination of spermatozoa concentration has been developed, based upon electrical counting of spermatozoa related to the counting of beads added in a known concentration to the semen sample. With this internal calibration method, there is no need to accurately measure the fluid flow through the chip, making the measurement easier. To our knowledge this is the first time that the concentration of spermatozoa is determined on chip by using electrical impedance measurements in combination with internal calibration. Determination the concentration of other cells, such as HL-60 cells, in suspension is also possible; the only condition is the necessity to be able to distinguish particles and cells by their change in impedance when passing the electrode pair. Future work will focus on using the developed chip to measure the spermatozoa and leucocyte concentration in human semen of fertile and subfertile men.Acknowledgements
Financial support from Stichting Toegepaste Wetenschappen (STW), chip fabrication by Jan van Nieuwkasteele, Johan Bomer and Daniel Wijnperlé and the electronic support from Stefan Lenk are gratefully acknowledged. We thank “KI station Twenthe” for providing the boar semen samples.Notes and references
- WHO, in WHO Laboratory manual for the examination of human semen and sperm-cervical mucus interaction, Cambridge University Press, Cambridge, 4th edn, 1999 Search PubMed.
- B. A. Keel, P. Quinn, C. F. Schmidt Jr, N. T. Serafy Jr, N. T. Serafy Jr and T. K. Schalue, Hum. Reprod., 2000, 15, 680–686 CrossRef CAS.
- B. A. Keel, Fertil. Steril., 2006, 85, 128–134 CrossRef.
- A. Valero, F. Merino, F. Wolbers, R. Luttge, I. Vermes, H. Andersson and A. van den Berg, Lab Chip, 2005, 5, 49–55 RSC.
- H. Andersson and A. van den Berg, Lab Chip, 2006, 6, 467–470 RSC.
- E. X. Vrouwe, R. Luttge and A. Berg van den, Electrophoresis, 2004, 25, 1660–1667 CrossRef CAS.
- E. Gheorghiu, Bioelectrochem. Bioenerg., 1996, 40, 133–139 CrossRef CAS.
- E. E. Krommenhoek, J. G. E. Gardeniers, J. G. Bomer, A. Van den Berg, X. Li, M. Ottens, L. A. M. van der Wielen, G. W. K. van Dedem, M. Van Leeuwen, W. M. van Gulik and J. J. Heijnen, Sens. Actuators, B, 2006, 115, 384–389 CrossRef.
- K. Asami, J. Non-Cryst. Solids, 2002, 305, 268–277 CrossRef CAS.
- W. H. Coulter, Proc. Natl. Electron. Conf., 1956, 12, 1034–1040 Search PubMed.
- J. Brotherton and G. Barnard, J. Reprod. Fertil., 1974, 40, 341–357 CrossRef CAS.
- S. Gawad, L. Schild and P. Renaud, Lab Chip, 2001, 1, 76–82 RSC.
- K. Cheung, S. Gawad and P. Renaud, Cytometry, Part A, 2005, 65a, 124–132 CrossRef CAS.
- G. Benazzi, D. Holmes, T. Sun, M. C. Mowlem and H. Morgan, IET Nanobiotechnol., 2007, 1, 94–101 Search PubMed.
- D. Holmes, D. Pettigrew, C. H. Reccius, J. D. Gwyer, C. Berkel van, J. Holloway, D. E. Davies and H. Morgan, Lab Chip, 2009, 9, 2881–2889 RSC.
- D. K. Wood, M. V. Requa and A. N. Cleland, Rev. Sci. Instrum., 2007, 78, 104301 CrossRef CAS.
- F. Eustache, P. Jouannet and J. Auger, J. Androl., 2001, 22, 558–567 CAS.
- S. Perticarari, G. Ricci, M. Granzotto, R. Boscolo, C. Pozzobon, S. Guarnieri, A. Sartore and G. Presani, Hum. Reprod., 2006, 22, 485–494 CrossRef.
- G. R. Langereis, Ph.D. Thesis, University of Twente, 1999.
- H. Morgan, T. Sun, D. Holmes, S. Gawad and N. G. Green, J. Phys. D: Appl. Phys., 2007, 40, 61–70 CrossRef CAS.
- S. Gawad, K. Cheung, U. Seger, A. Bertsch and P. Renaud, Lab Chip, 2004, 4, 241–251 RSC.
- E. Johanisson, A. Campana, R. Luthi and A. de Agostini, Hum. Reprod. Update, 2000, 6, 404–412 CrossRef CAS.
- M. C. Gil, M. García-Herreros, F. J. Barón, I. M. Aparicio, A. J. Santos and L. J. García-Marín, Theriogenology, 2009, 71, 254–263 CrossRef CAS.
- H. Obara, H. Shibahara, H. Tsunoda, A. Taneichi, H. Fujiwara, S. Takamizawa, S. Idei and I. Sato, Int. J. Androl., 2001, 24, 102–108 CrossRef CAS.
- M. R. Curry, J. D. Millar, S. M. Tamulie and P. F. Watson, Biol. Reprod., 1996, 55, 1325–1332 Search PubMed.
| This journal is © The Royal Society of Chemistry 2010 |
