
Bacteria-responsive functional electrospun membrane: simultaneous on-site visual monitoring and inhibition of bacterial infection†
Min
Wang
a,
Yuanzhang
Jiang
a,
Kaiwen
Zhuang
 *b and
Lin
Tan
*ac
*b and
Lin
Tan
*ac
aCollege of Biomass Science and Engineering, Key Laboratory of Biomass Fibers for Medical Care in Textile Industry, State Key Laboratory of Polymer Materials Engineering, Sichuan University, Chengdu 610065, China. E-mail: tanlinou@scu.edu.cn
bDepartment of Dermatovenereology, West China Hospital, Sichuan University, Chengdu, 610041, China. E-mail: kaiwenzhuang@163.com
cYibin Institute of Industrial Technology/Sichuan University, Yibin Park, Yibin 644000, China
First published on 16th July 2024
Abstract
Skin infections are a major threat to human health. Early diagnosis of bacterial infections is of great significance for implementing protective measures on the skin. Therefore, in this study, we designed an electrospun membrane (PPBT) for visual monitoring of colonized bacteria and responsive antibacterial ability. Specifically, the acidity of the microenvironment caused by bacterial metabolism was applied to drive the color change of bromothymol blue (BTB) on the PPBT membrane from green to yellow, thereby facilitating the early warning of infection and timely treatment. Within 4 h, different concentrations of Staphylococcus aureus (∼105 CFU mL−1), Escherichia coli (∼105 CFU mL−1), Pseudomonas aeruginosa (∼105 CFU mL−1) and Candida albicans (∼104 CFU mL−1) were visually monitored. Moreover, as the local acidity was enhanced via microbial metabolism, ZIF-8 nanoparticles loaded with TCS (TCS@ZIF-8) on the PPBT membrane could release TCS in an acid-responsive manner. At the same time, ROS were generated under 405 nm irradiation to achieve synergistic antibacterial ability. Experiments confirmed that the PPBT membrane has ideal and controllable antibacterial features based on acid responsive release and a synergistic photocatalytic antibacterial mechanism after monitoring. Therefore, the PPBT membrane developed in this work provides a feasible solution for bacterial monitoring and inactivation devices. More importantly, it can be beneficial for meeting the needs of clinical diagnosis and timely treatment of bacterial infection.
 Kaiwen Zhuang | Dr Kaiwen ZHUANG is an attending doctor at the West China Hospital, Sichuan University. He obtained his MD and PhD degrees from Sichuan University, West China Medical College. He isolated a new pathogenic actinomycete from the skin and named it Nocardia huaxiensis sp. nov. His current research focuses on photodynamic and sonodynamic therapy combined with nano-materias on pathogenic fungus and bacteria. His group has engineered a recyclable and light-triggered nanofibrous membrane against the emerging fungal pathogen Candida auris. |
Introduction
Skin and soft tissue infections caused by bacteria, fungi, and viruses are among the most common health threats worldwide.1,2 Furthermore, they vary in depth and severity from mild infections to being life-threatening.3–5 Early diagnosis of bacterial infection is a necessary prerequisite for the selection of treatment options.6 Based on this, real-time monitoring of skin microbial concentration is helpful to understand the skin health status, take timely measures, and reduce the burden on patients. Nevertheless, traditional monitoring methods are time-consuming and limited by complex instrumentation or skilled operator requirements.7,8 Therefore, the development of a functional material to achieve on-site bacterial sensing and effective killing is of great significance for skin care in people's daily life.9With the growing demand for personalized medicine in healthcare, some smart devices integrating real-time monitoring and on-demand treatment have gained more attention. For example, advanced flexible bandages and various sensors have been developed to monitor and treat wound infections.10,11 However, many of them remain at the level of sensor integration and require additional power, which in turn increases the complexity of the device and limits the convenience of real-time monitoring.12 Accordingly, in response to the World Health Organization (WHO) global action plan, portable and inexpensive devices to monitor and treat bacterial infections, such as film-based devices, have been widely used in artificial intelligence to detect and screen human health owing to their unique advantages, such as biosafety, high efficiency, portability, visualization, and low cost.13,14
Regarding the monitoring of bacterial infection, the unique microenvironment of bacteria (pH, toxins, enzymes, etc.) is conducive to researchers’ exploration.15,16 Among them, pH is a particularly interesting parameter as its change is related to the growth and metabolism of bacteria. Many bacteria decompose organic nutrients and metabolize acids, which causes the pH value of the microenvironment to decrease, which is widely used for the monitoring of bacterial infections.17 Considering that color is an important visual factor and can be easily monitored, many materials have been developed for bacteria monitoring devices.13,18,19 Attractively, hydrogel-based discolored wound dressings have shown advantages in visually monitoring wound infections.6,9 As the nanoporous material ZIF-8 possesses the characteristics of acid-induced disintegration and antibacterial activity, it has the potential to be applied to sense an acidic environment.20 In addition, electrospun nanofibers exhibit high surface-to-volume ratio and high porosity to achieve drug release under a specific environment and stimulus, showing great potential as pH monitoring sensors.19,21–24 At present, there are still few relevant studies and reports on electrospun membranes that integrate the performances of visual bacterial monitoring and inactivation.
Therefore, in this study, an electrospun PPBT membrane (Fig. 1) for visual monitoring of bacterial infection as well as responsive antibacterial ability was prepared. Bromothymol blue (BTB) was incorporated in the PPBT membrane to sense the acidity of the microenvironment caused by bacterial metabolism with color variation from green to yellow. On the other hand, with the increase of acidic substances metabolized by bacteria, the TCS@ZIF-8 on the PPBT membrane was triggered to release the loaded TCS. Moreover, ROS produced under photocatalytic conditions can further promote a synergistic antibacterial effect. Overall, the PPBT membrane developed in this work is expected to provide a new idea for the development of portable functional nanofibrous membrane equipment that integrates monitoring and antibacterial functions.
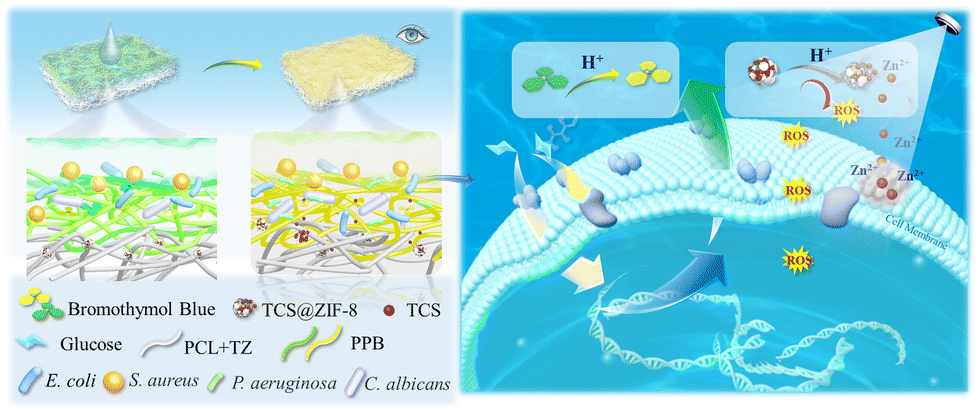 | ||
| Fig. 1 The route and mechanism of bacterial monitoring and responsive antimicrobial ability. | ||
Experimental section
Materials
PCL (Mw = 80![[thin space (1/6-em)]](https://www.rsc.org/images/entities/char_2009.gif) 000 g mol−1) was purchased from Sigma-Aldrich (St. Louis, MO, USA). 2-Methylimidazole and zinc nitrate hexahydrate were obtained from Aladdin. Triclosan (Triclosan, TCS), hexafluoroisopropanol (HFIP) and PEG (Mw = 10000 g mol−1) were purchased from J&K Scientific Ltd. In addition, potassium dihydrogen phosphate, sodium chloride, potassium chloride, agar powder, yeast leaching powder and methanol were obtained from Chengdu Chron Chemicals Co., Ltd. Trypsin was obtained from Beijing Aobox Biotechnology Co., Ltd. Escherichia coli (E. coli, ATCC 8739), Staphylococcus aureus (S. aureus, ATCC 6538), Pseudomonas aeruginosa (P. aeruginosa, ATCC 25619) and Candida albicans (C. albicans, ATCC 10231) were provided by Shanghai Luwei Technology Co., Ltd, China.
000 g mol−1) was purchased from Sigma-Aldrich (St. Louis, MO, USA). 2-Methylimidazole and zinc nitrate hexahydrate were obtained from Aladdin. Triclosan (Triclosan, TCS), hexafluoroisopropanol (HFIP) and PEG (Mw = 10000 g mol−1) were purchased from J&K Scientific Ltd. In addition, potassium dihydrogen phosphate, sodium chloride, potassium chloride, agar powder, yeast leaching powder and methanol were obtained from Chengdu Chron Chemicals Co., Ltd. Trypsin was obtained from Beijing Aobox Biotechnology Co., Ltd. Escherichia coli (E. coli, ATCC 8739), Staphylococcus aureus (S. aureus, ATCC 6538), Pseudomonas aeruginosa (P. aeruginosa, ATCC 25619) and Candida albicans (C. albicans, ATCC 10231) were provided by Shanghai Luwei Technology Co., Ltd, China.
Preparation of the double-layer electrospun PPBT membrane
20 g of PCL solution (8 wt%) added with 1 mL of ethanol solution (2 mg TCS@ZIF-8) was electrospun to obtain the membrane PCL + TZ. Another 20 g of electrospinning solution containing PCL (7.4 wt%) and PEG (7.4 wt%) was added with 1 mL of ethanol solution (containing 12 mg BTB) to prepare the PPB spinning solution. After the electrospinning of the PCL + TZ membrane, the PPB membrane was directly deposited on it to obtain the double-layer PPBT membrane. Besides, the PCL membrane was prepared with the 8 wt% PCL electrospinning solution, and the PCL + PEG membrane was obtained with the electrospinning solution containing PCL (7.4 wt%) and PEG (7.4 wt%).Characterization of TCS@ZIF-8 nanoparticles and fiber membranes
The microscopic morphology of TCS@ZIF-8 was characterized by SEM (Hitachi SU3500, Japan) and TEM (Talos F200S G2, America). XRD (Rigaku Ultima IV, Japan) was employed to analyze the crystal structures of TCS@ZIF-8. The morphology and structure of the electrospun membranes were characterized by SEM (Hitachi SU3500, Japan), FT-IR (NICOLET iS50, America) and XPS (Kratas AXIS SUPRA, Japan). Besides, the surface wettability of the fibrous membranes was measured using a water contact angle (WCA) tester (HKCA-40, China); five different points were tested using 3 μL of water droplets. A servo-controlled universal testing machine (AI-7000S, China) was operated to explore the mechanical property of the PPBT membrane.Loading content of TCS
ZIF-8 decomposes under acidic conditions with controllable drug release.25 In order to measure the drug loading capacity (DLC), 1 mg of TCS@ZIF-8 was weighed and completely dissociated with 1 μL of HCl solution (0.5 mol mL−1), and then diluted in 10 mL of DMSO. The absorbance at 280 nm was measured using a UV-vis spectrophotometer (UV2600A, China), and the amount of TCS was determined from its standard curve. Finally, the DLC value of TCS@ZIF-8 was calculated according to the following formula:| DLC (%) = (MTCS)/(MTCS@ZIF-8) × 100% | (1) |
The release of TCS from TCS@ZIF-8 and PPBT membrane
The standard curve of TCS at different pH (5.5, 6.5, and 7.4) was established with the assistance of UV spectroscopy. And the release kinetics of TCS from TCS@ZIF-8 (0.5 mg mL−1) and PPBT membrane were investigated in PBS at pH = 5.5, 6.5 and 7.4. The temperature was kept at 37 °C. After regular intervals, samples were collected and replaced by fresh PBS. Finally, the UV absorbance value of each sample was measured at 280 nm to evaluate the release of TCS from TCS@ZIF-8 and PPBT membrane.Antimicrobial properties of the PPBT membrane
Different concentrations of bacterial and fungal solutions cultured on the membrane for 24 h were rinsed with 900 μL of PBS. Next, 100 μL of the elution was extracted and coated on the medium for incubation. After 18–24 h, the number of colonies and the sterilization rate were calculated. Luria-Bertani (LB) agar medium was used for E. coli, S. aureus, and P. aeruginosa, while potato glucose medium was prepared for C. albicans. The antibacterial ratio was calculated based on the following equation:| (NC − NE)/NC × 100% | (2) |
Morphology of bacteria and fungi
After being co-cultured with bacteria and fungi, the membranes were soaked in 2.5% glutaraldehyde aqueous solution at 4 °C for about 6 h, respectively. After fixation, they were sequentially soaked in different alcohol concentration gradients (25%, 50%, 75%, and 100%) for dehydration. Each dehydration per gradient lasted for 15 min. And then the samples attached with bacterial cells were dried under cool and ventilated conditions. Finally, the dried sample was observed with SEM.Live/dead staining experiments of bacteria and fungi
The antibacterial effect of the PPBT membrane against E. coli, S. aureus, P. aeruginosa and C. albicans was detected with the live and dead staining kit (ThermoFisher, America). Briefly, after monitoring for 24 h, the membranes were incubated with PI and SYTO 9 fluorescent dyes for an additional 15 min at 37 °C under dark conditions. The suspension of the bacteria and fungi was washed three times with PBS to remove additional dyes mildly. Finally, confocal laser scanning microscopy was used to observe fluorescence on the membrane.1O2 detection of PPBT membranes
The 1O2 produced on the PPBT membrane is detected with 1,3-diphenylisobenzofuran (DPBF). Three sets of membranes (PPB, PPBT, and PPBT + Vis) were soaked in ethanol and irradiated with 405 nm visible light for 10 min. Then they were moved to 300 μL ethanol (0.6 mg mL−1 DPBF) and incubated for 15 min. The supernatant was collected and detected by multimode microplate reader measurement (Biotek, USA) for 1O2.Measurement of ROS and ATP levels in bacteria
After 24 h of co-culture with the membrane, the bacteria were stained with 10 μmol L−1 2′,7′-dichlorodihydrofluorescein diacetate (DCFDA, Beyotime, China) for 15 min in the dark after 10 min of irradiation.26 The stained bacteria were then visualized with a Leica fluorescence microscope and ROS levels in the bacterial cells were measured. Bacteria grown on the membrane without any intervention were used as the negative control (excitation/emission wavelengths of 488/525 nm, respectively). On the other hand, the bacteria co-cultured with the membrane for 24 h were rinsed and collected. Subsequently, the changes of intracellular ATP were measured with the ATP detection kit (Beyotime, Haimen, China).Stability test and degradation experiment of the PPBT membranes
Bacterial monitoring and antibacterial experiments were carried out on the membranes stored for 0 days, 14 days and 30 days, respectively, to verify the stability of color change and antibacterial ability. In addition, the bacterial monitoring experiments were conducted according to Section 1. 7 in ESI,† and the antibacterial experiments were carried out as described in the section of antimicrobial properties of the PPBT membrane. The degradation experiment of the PPBT membrane was conducted according to the literature27 with subtle modification. 10 mg of membranes were weighed and soaked in PBS containing lipase (20 U mL−1), and afterward, they were incubated in a shaking box with constant temperature (100 rpm, 37 °C) to observe the degradation.Statistical analysis
All data were averaged and expressed as mean ± standard deviation (SD). Origin2019 software was applied for statistical analysis. Values of P were calculated to determine the significant difference, and presented as P* < 0.05, P** < 0.01, and P*** < 0.001, respectively.Results and discussion
Structural characterization of TCS@ZIF-8 and PPBT membrane
The ZIF-8 and TCS@ZIF-8 nanoparticles were successfully synthesized as the following characterizations prove. SEM and TEM images (Fig. 2a and b) show that the synthesized TCS@ZIF-8 has a hexahedral structure with sharp edges. According to the TEM images (Fig. S1, ESI†), a significant size difference exists between TCS@ZIF-8 and ZIF-8, which may be due to the loading of triclosan (TCS) inside the nanoparticle, leading to an increase in the diameter of the particle. Besides, the ZIF-8 displays a hollow structure, while the TCS@ZIF-8 shows a solid structure. In the elemental distribution of the transmission image of TCS@ZIF-8 nanoparticles (Fig. 2c), the distribution of Zn, C, O, N, and Cl elements is uniform. Compared with ZIF-8, Fig. S2 (ESI†) shows a clear peak of Cl belonging to TCS@ZIF-8. Consequently, the results determined that TCS@ZIF-8 of core–shell structure was successfully synthesized with a regular and uniform morphology.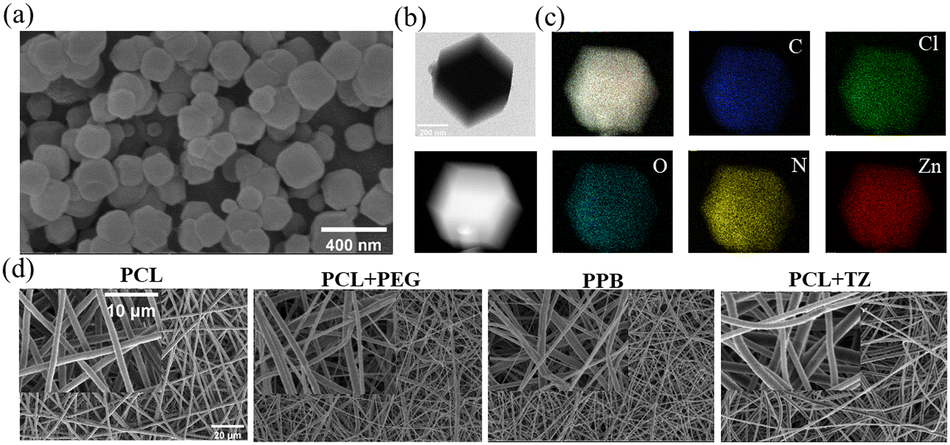 | ||
| Fig. 2 (a) SEM image of TCS@ZIF-8; (b) TEM images of TCS@ZIF-8; (c) element distribution of TCS@ZIF-8; (d) SEM images of electrospun membranes. | ||
On the other hand, EDS images (Fig. S3, ESI†) represent that Zn elements are evenly distributed on the PCL + TZ membrane, indicating that the electrospun nanofibers containing TCS@ZIF-8 nanoparticles with desirable morphologies were obtained. According to the morphology of electrospun membranes, the nanofibers of the PCL membrane are straight and uniform, and a similar morphology was observed on the PCL + TZ membrane (Fig. 2d). As for the nanofibers of PCL + PEG and PPB membranes, the diameter becomes much more disorderly (Fig. S4, ESI†).
Fig. S5 (ESI†) shows the FTIR spectra of different membranes. In the spectrum of the PCL membrane, the peaks at wavelengths of 2944 cm−1 and 2863 cm−1 correspond to the C–H asymmetric stretching and symmetric stretching of the PCL molecular chain.28,29 The spectra of the PCL + PEG membrane show that the peak enhancement at 1100 cm−1 after the addition of PEG is due to the enhanced C–O–C expansion vibration on the PEG backbone.30 According to the spectrum of the PPB membrane, the new peak appearing at 1163 cm−1 is attributed to the benzene ring C–O of bromothymol blue,31 and the peak at 1046 cm−1 is resulted by S–O–C.32,33 In addition, in the spectrum of TCS@ZIF-8, the peaks at 1309 cm−1, 1146 cm−1 and 758 cm−1 correspond to the planar bending of the imidazole ring in the TCS@ZIF-8 particle.34 According to the spectrum of the PCL + TZ membrane, the peak at 1149 cm−1 is brought by the imidazole ring of TCS@ZIF-8.
In the XRD spectrum (Fig. S6a, ESI†), characteristic peaks at 2θ = 7.2°, 12.6°, and 18° are observed from both ZIF-8 and TCS@ZIF-8 samples, corresponding to the sodalite structure of nanoparticles.35 At the same time, the peak of TCS@ZIF-8 (green line) is in good agreement with the diffraction peak of the original ZIF-8 nanoparticles (blue line), which is consistent with the literature.36,37 In addition, new peaks appear at 1022 eV and 1044 eV in the XPS spectra of the PCL + TZ membrane with comparison to the PCL membrane (Fig. S6b, ESI†), representing Zn 2p3/2 and Zn 2p1/2 of TCS@ZIF-8 respectively.38 Consequently, these results demonstrated the successful synthesis of TCS@ZIF-8 and uniform loading on the PCL + TZ membrane.
Drug release of nanoparticles and nanofibrous membranes
According to the absorbance corresponding to the standard curve of the TCS at 280 nm, the loading of TCS was calculated to be 5 wt% after the complete disintegration of TCS@ZIF-8 under strong acidic conditions. To evaluate the release rate of TCS under different acid conditions, in vitro release experiments for TCS@ZIF-8 and nanofibrous membranes were carried out at 37 °C in PBS under different pH values (5.5, 6.5, and 7.4). Fig. 3a shows that the release of TCS from TCS@ZIF-8 nanoparticles increases with time under pH 5.5 and pH 6.5. Specifically, 91.34% of TCS is released from TCS@ZIF-8 nanoparticles within 8 h at pH 5.5, but only 50.12% at pH 6.5. However, there is no evident release in PBS at pH 7.4. According to Fig. 3b, the release of TCS from the PPBT membrane at pH 5.5 and 6.5 is slower than that of TCS@ZIF-8 nanoparticles. The release of TCS takes more than 20 h to exceed 80% from the PPBT membrane. Accordingly, this experiment proves that the synthesized TCS@ZIF-8 nanoparticles and the PPBT membrane can release TCS with pH decreases gradually.39 Furthermore, the prolongation of the release time on the membrane is conducive to the antibacterial effect after monitoring of the membrane.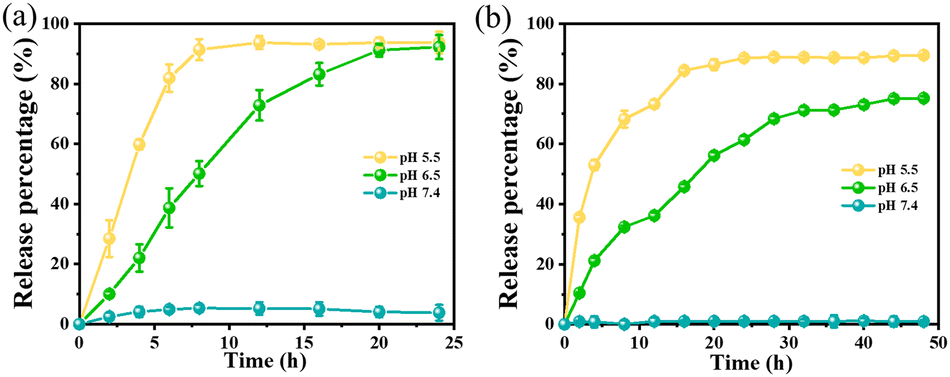 | ||
| Fig. 3 TCS release from TCS@ZIF-8 nanoparticles (a) and nanofibrous PPBT membrane (b). | ||
Antibacterial ability of TCS@ZIF-8 and ZIF-8
E. coli and S. aureus were employed to evaluate the antimicrobial properties of TCS@ZIF-8 and ZIF-8 nanoparticles. The results of the experiment are presented in Fig. S7 (ESI†). Both TCS@ZIF-8 and ZIF-8 have concentration-dependent antimicrobial activity: a few colonies were found at 25 μg mL−1 ZIF-8, while more colonies grew at 12.5 μg mL−1. In contrast, the TCS@ZIF-8 group shows the growth of a few colonies at 12.5 μg mL−1. Therefore, the antimicrobial ability of TCS@ZIF-8 is enhanced in comparison with ZIF-8, due to the loading of antibacterial TCS.Chromogenic pre-experiment of BTB
Fig. S8 (ESI†) shows the UV-vis scanning spectrum of BTB from 300 to 800 nm at different pH (8.0–5.5), and the BTB solution changes from blue to green and then to yellow gradually, which confirms the acid responsive color change characteristic of BTB. And the characteristic absorbance of BTB at 615 nm decreases as the pH declines from 8.0 to 5.5. Therefore, different concentrations of E. coli, S. aureus, P. aeruginosa, and C. albicans were incubated with BTB to explore the change of color and pH values within 4 h. The results declare that the color of the solution changes from green to yellow gradually with the increase of bacterial and fungal suspensions. Besides, the corresponding absorbance also decreases with the color changes (Fig. S9, ESI†), indicating that the pH drops with the growth of bacterial and fungal concentration. And the decrease in pH is caused by the weak acidic substances (such as carbonic acid and lactic acid) produced from the respiration and fermentation of bacteria and fungi.18 Therefore, these experiments verified the visually color indicating mechanism of BTB in response to acid, and preliminarily explored the sensitivity of BTB to different concentrations of bacterial and fungal suspensions.Surface wettability of the PPBT membrane
The surface wettability was tested to reveal the hydrophobicity and hydrophilicity of membranes. According to Fig. 4a, the WCA value of the PCL membrane is 134.5°, indicating that the PCL membrane has an obvious hydrophobic characteristic.40 The WCA value of the PCL + TZ membrane increases slightly compared to that of the PCL membrane. The probable reason is that the TCS@ZIF-8 nanoparticles increase the surface roughness of the PCL + TZ membrane, resulting in the decline of surface energy and enhancement of hydrophobicity. As for the PCL + PEG membrane, the WCA value is greatly reduced to 44.8° due to the introduction of hydrophilic PEG. Furthermore, the hydrophilicity of the PPB membrane is further enhanced after the loading of BTB on the PCL + PEG membrane with the WCA value of 17.7°.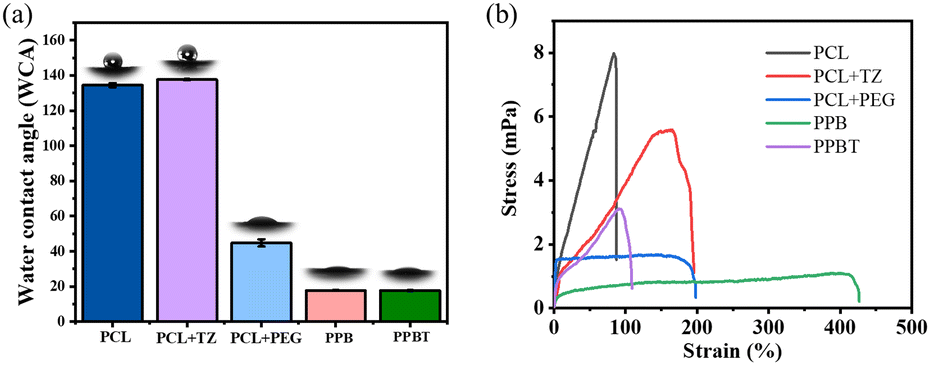 | ||
| Fig. 4 (a) Water contact angle of different membranes, contacting time is 10 s; (b) tensile properties of different membranes. | ||
Since in the bacterial monitoring experiment, the bacterial droplets are added to the PPB surface of the PPBT membrane, the WCA value of the PPBT membrane remains the same as the PPB membrane (17.6°). Consequently, there is a prominent differentiation of hydrophilicity and hydrophobicity between the double layers on the PPBT membrane. Considering that in practical application, the upper hydrophilic layer (PPB membrane) can absorb the bacterial solution and diffuse it to the entire PPB membrane quickly, the BTB is supposed to come into contact with the bacterial solution fully to facilitate acid response and discoloration, while the bottom hydrophobic PCL + TZ membrane may slow down the diffusion of the bacterial solution to the entire hydrophobic layer and delay the acid release of antimicrobial TCS@ZIF-8 nanoparticles. Subsequently, the PPBT membrane is confirmed with different hydrophilic and hydrophobic features to achieve the effect of quick monitoring and proper acid-responsive antibacterial ability.
Mechanical properties of the PPBT membrane
According to the tensile mechanical test (Fig. 4b), there are obvious distinctions in mechanical properties among the membranes. The breaking strength of the PCL membrane is 7.90 MPa, which displays a great mechanical performance. While the breaking strength of the PCL + TZ membrane decreases to 5.58 MPa, and the strain increases from 87% to 195%. On the other hand, the breaking strength of the PCL + PEG membrane decreases to 1.62 MPa, and a yield plateau appears as the strain is 51%. The stress is nearly unchanged as the strain increases until the maximum strain reaches 200%. Moreover, the breaking strength of the PPB membrane further reduces (1.07 MPa) and the yield plateau is extended as the deformation reaches 426%. The reason is the adjunction of BTB and PEG attributes to plasticize the PCL matrix and reduce the interactions between polymeric chains.41As a double-layer composite membrane, the mechanical properties of the PPBT membrane are influenced by the PCL + TZ membrane and PPB membrane simultaneously. The stress and strain curve displays that the breaking strength of the PPBT membrane is 3.1 MPa and the maximum strain reaches 110%. Subsequently, the results determine that the prepared PPBT membrane retains suitable mechanical properties to be used as a convenient device for bacterial monitoring, which are comparable with those of reported film-devices for visual bacterial diagnosis.16
Bacterial monitoring of the PPBT membrane
The increase in the number of bacterial infections has become a significant issue in the healthcare field, and a variety of inflammation-related diseases result from S. aureus.42 As burn injury has posed devastating burdens due to its inevitable damage to the skin structure resulting in the increased risk of infection, P. aeruginosa (particularly) and E. coli are commonly considered as the leading etiologic agents of burn infections.43,44 Besides, C. albicans is a kind of common microorganism on human skin and considered to be an opportunistic pathogen in immunosuppressed or immunocompromised persons.45 Therefore, S. aureus, E. coli, C. albicans, and P. aeruginosa were employed to verify the monitoring ability of the electrospun PPBT membrane. The bacterial monitoring of the PPBT membrane is derived from the acidic substances produced by bacterial metabolism which cause the color change of BTB on the PPBT membrane.As shown in Fig. 5a and b, as the concentration of bacteria grows, the yellowing and the color intensity are strengthened gradually on the membrane. Among them, the PPBT membrane with the concentration of 108 CFU mL−1 showed obvious yellow after 1 h of incubation, while the group with 105 CFU mL−1 bacteria showed a recognizable color change within 4 h. In addition, the fluorescence images of PPBT membranes (Fig. 5c) reflect the colonization of bacteria with different concentrations after monitoring, and the fluorescence area is denser as the bacterial concentration increases. These findings reveal that the PPBT membrane obtains the ability to monitor E. coli and S. aureus with the color variation of BTB.
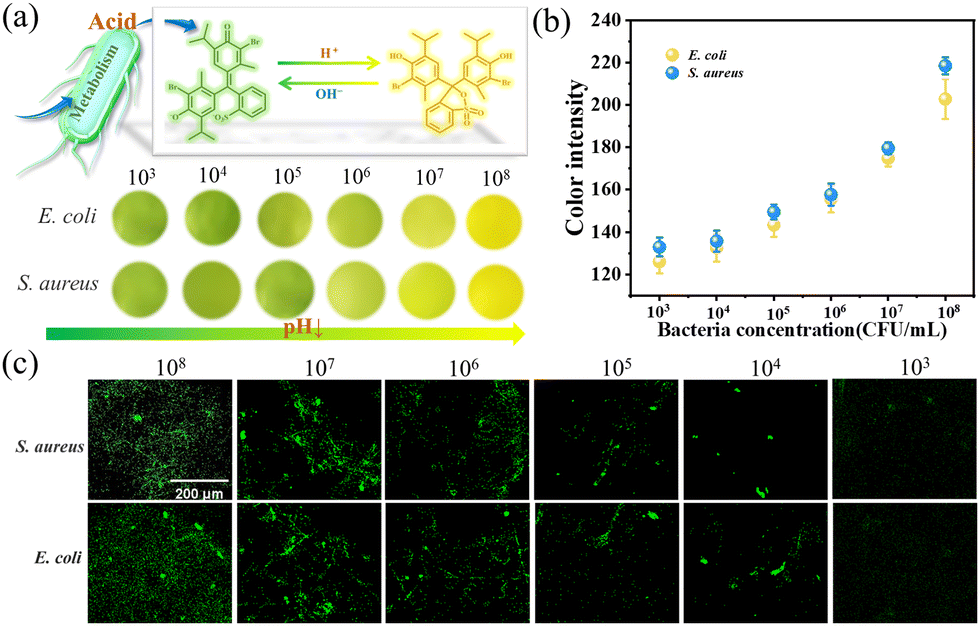 | ||
| Fig. 5 The monitoring ability of the PPBT membrane for E. coli and S. aureus: (a) the color change triggered by acid on the PPBT membrane; (b) color intensity changes of the PPBT membrane at 4 h; (c) fluorescent staining images of different concentrations of bacterial solution on the PPBT membrane. | ||
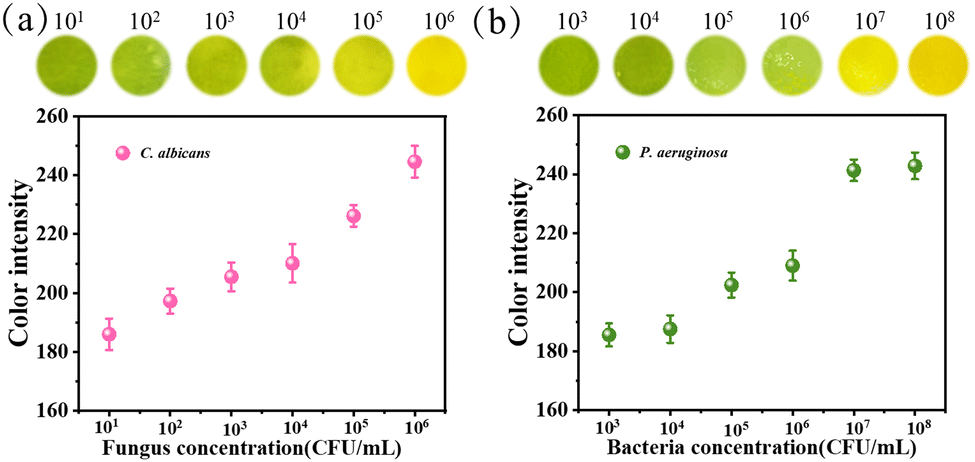
Apart from E. coli and S. aureus, the visual monitoring of C. albicans and P. aeruginosa was proceeded according to the previous experimental methods. In Fig. 6a, the color of the PPBT membrane turns obvious yellow after co-culture with C. albicans at the concentration of 106 CFU mL−1, and it still can be distinguished at the concentration of 104 CFU mL−1, while the monitoring limit for P. aeruginosa is 105 CFU mL−1 as displayed in Fig. 6b. Since C. albicans belongs to fungal yeast, which has a larger and more complex cell structure than bacteria like P. aeruginosa and can produce more acidic substances, the color change of C. albicans is more obvious under low concentrations. Finally, the presented results demonstrate that the PPBT membrane can monitor both C. albicans and P. aeruginosa.
 | ||
| Fig. 6 The monitoring ability of the PPBT membrane and color intensity changes of C. albicans (a) and P. aeruginosa (b). | ||
Antimicrobial ability of the PPBT membrane
TCS@ZIF-8 on the membrane may release the TCS and Zn2+ when exposed to the acidic environment.25 At the same time, the TCS@ZIF-8 is supposed to produce ROS under 405 nm light for synergistic antibacterial ability with TCS and Zn2+, which could achieve enhanced antibacterial effect after monitoring.35 The antibacterial activity of PPBT membranes against different concentrations of bacterial solution (E. coli and S. aureus) was detected after coculture for 24 h. As Fig. 7a, b and Fig. S10 (ESI†) reveal, there are nearly no bacteria surviving on the PPBT membrane with the concentration of 105 CFU mL−1 (the antibacterial rate is 99.98%). Furthermore, the colonies of 107 CFU mL−1 are reduced after irradiation (405 nm, 10 min), indicating the synergistic photocatalytic antimicrobial ability of TCS@ ZIF-8. The results indicate that antibacterial effect is achieved on the PPBT membrane after the bacterial monitoring. | ||
| Fig. 7 (a) Surviving colonies of E. coli and S. aureus; (b) colony growth images of S. aureus; (c) surviving colonies of C. albicans; (d) colony growth images of C. albicans after plating. | ||
As for the P. aeruginosa, Fig. S11 (ESI†) indicates that the PPBT membrane displays apparent antibacterial effect against P. aeruginosa at a concentration of 106 CFU mL−1, and the antibacterial effect is enhanced after irradiation at 405 nm at a concentration of 107 CFU mL−1 in the PPBT + Vis group, while there is faintish antibacterial effect of concentration 108 CFU mL−1. Therefore, the PPBT membrane achieves antibacterial ability against P. aeruginosa. According to the monitoring experiment of C. albicans, the concentration range from 106 to 101 CFU mL−1 was tested to determine the antifungal ability. And the results of Fig. 7c and d demonstrate that the PPBT membrane achieves obvious antifungal ability after coculture with a fungal concentration of 104 CFU mL−1 (96.61%). Besides, the PPBT + Vis group displays an enhanced antifungal effect with photocatalysis as the antifungal rate increases to 96.57% at a concentration of 105 CFU mL−1. In general, the PPBT membrane shows good antimicrobial effect against C. albicans after the monitoring.
Antimicrobial mechanism of the PPBT membrane
Zn2+ and TCS released from TCS@ZIF-8 can disrupt cell membranes with electrostatic interactions and inhibition of fatty acid biosynthesis on the cell membrane of bacteria.2 Besides, the generation of reactive oxygen species (ROS) membrane is another important factor.46 Therefore, the live and dead fluorescent dyes SYTO9/PI were used to observe the bacteria and fungi treated with different membranes. Among them, SYTO9 stains all cells and fluoresces green, while propidium iodide (PI) fluorescing red only labels cells with damaged walls and membranes.47According to Fig. 8, the staining of S. aureus, E. coli, P. aeruginosa, and C. albicans on membranes without TCS@ZIF-8 antimicrobial nanoparticles emits green fluorescence, indicating that the cell membrane and cell wall structure of bacteria and fungi are intact. In contrast, the evident red fluorescence of microorganisms on the PPBT membrane means that the cell membrane and cell wall are damaged and destroyed. As for the PPBT + Vis group, the red signal increases in comparison with that in the PPBT group.
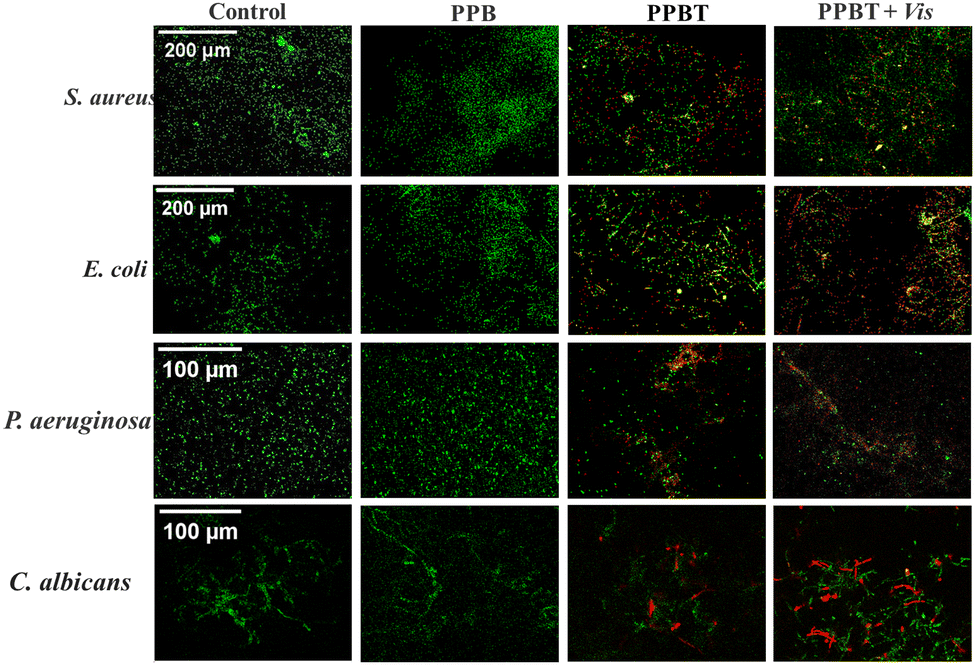 | ||
| Fig. 8 Fluorescence staining images of S. aureus, E. coli, P. aeruginosa and C. albicans after treatment. | ||
In addition, according to the SEM images of E. coli, S. aureus, P. aeruginosa and C. albicans (Fig. 9), the appearance of bacteria and fungi in the PPBT group is wrinkled and deformed, and the destruction in the PPBT + Vis group becomes more intense. The results are consistent with the consequence of fluorescence staining experiment, which proves that the PPBT membrane has synergistic photocatalytic antimicrobial effect with destruction of the cell membrane of bacteria and fungi.
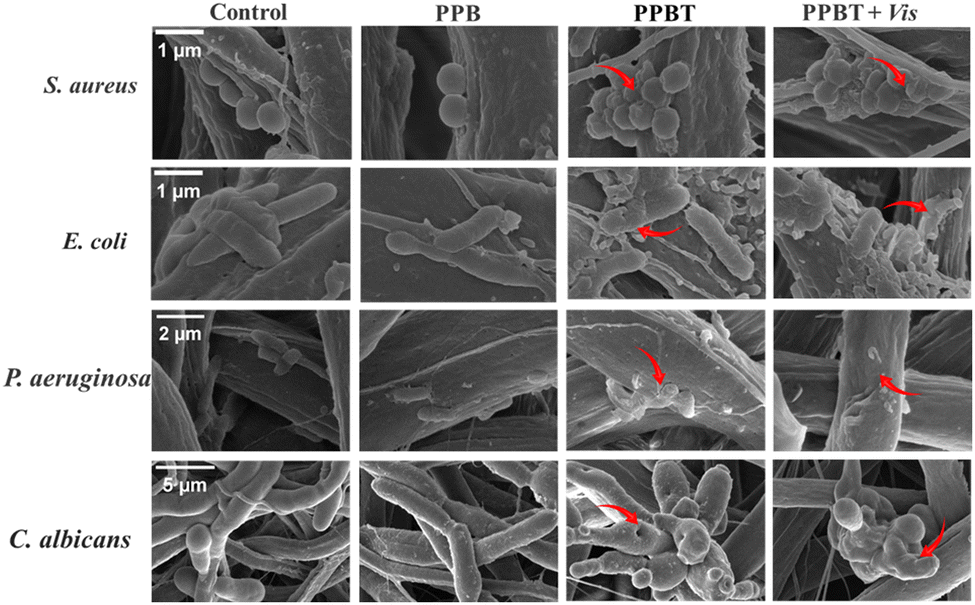 | ||
| Fig. 9 SEM images of S. aureus, E. coli, P. aeruginosa and C. albicans after treatment. | ||
To further evaluate the effect of antimicrobial TCS@ZIF-8 nanoparticles on bacterial cells, the permeability of bacterial cell membranes was assessed with β-galactosidase. β-Galactosidase is a tetrameric enzyme that can only be detected when the cell membrane is damaged. According to Fig. 10a, the level of β-galactosidase on the PPBT membrane is significantly higher than that in the control group, which is consistent with the results of PI staining and SEM morphology. And the result supports the mechanism of bacterial membrane dysfunction resulted by TCS@ZIF-8. In addition, changes in ATP levels within bacterial cells are explored as shown in Fig. 10b, and the intracellular ATP levels of E. coli and S. aureus are significantly reduced on the PPBT membrane, verifying that the cell metabolism is disturbed by TCS@ZIF-8.
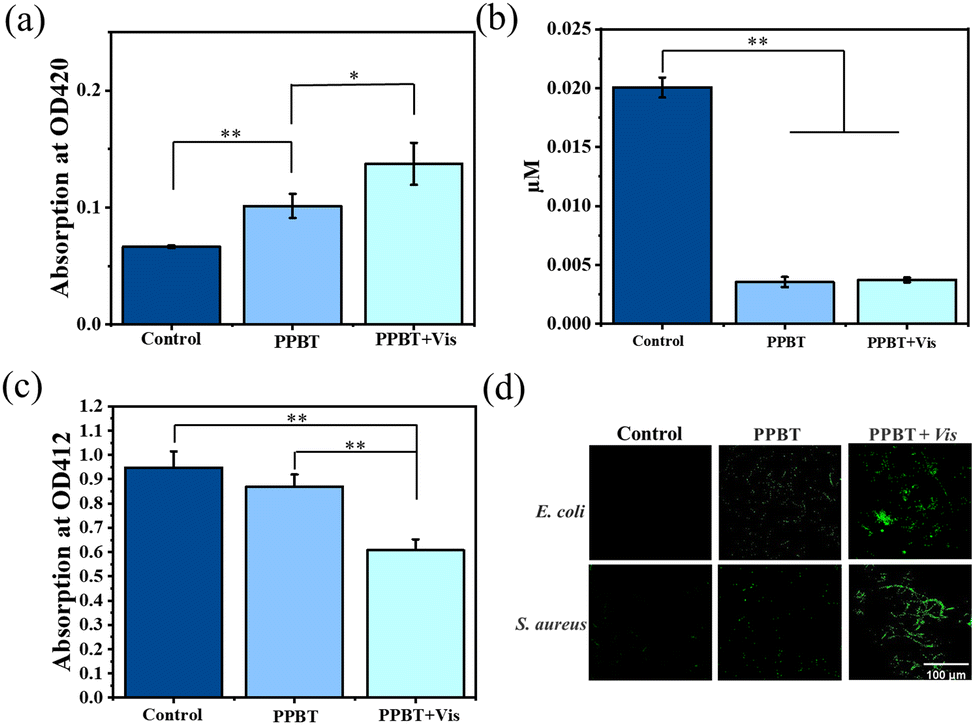 | ||
| Fig. 10 The measurement of β-galactosidase (a) and ATP levels (b); (c) the absorption of DPBF at 412 nm on the PPBT membrane; (d) the fluorescence images of intracellular ROS. | ||
Furthermore, as the production of ROS is the factor for effectively killing bacteria after the photocatalysis with ZIF-8.48 Therefore, the reagent 1,3-diphenylisobenzofuran (DPBF) is employed as a ROS probe to detect the 1O2 produced by the PPBT membrane after irradiation at 405 nm. The DPBF can be oxidized by 1O2 through Diels–Alder 1,4-cyclo reaction, resulting in a decrease of absorbance from the mixture at 412 nm. Hence the amount of 1O2 generated on the membrane can be evaluated. According to Fig. 10c, the signal attenuation of DFBF around 412 nm is stimulated, indicating that 1O2 is produced in the PPBT + Vis group. To further explore the intracellular ROS levels in bacteria, different membrane groups after incubation were further characterized with 2,7-dichlorodihydrofluorescein diacetate (DCFH-DA) dye. After irradiation, green fluorescence signals are clearly observed in the PPBT + Vis group (Fig. 10d), while few fluorescence signals are found in the PPBT group and the control group, indicating that the intracellular ROS level on the PPBT membrane significantly increases after photocatalysis. Therefore, the results determine that TCS@ZIF-8 on the PPBT membrane exhibits obvious photodynamic effect with the irradiation of 405 nm light. And the increased intracellular ROS level may further inhibit the growth of bacteria by attacking lipids, proteins, and DNA as the antimicrobial experiment describes.49
Collectively, the fluorescence staining experiment, morphological images, β-galactosidase detection, ATP evaluation and ROS assays proved that the PPBT membrane has the mechanisms of cell membrane damage, metabolism inhibition, ROS generation and enhanced synergistic antimicrobial abilities. Additionally, the prepared PPBT membrane is not only responsive to acid but also the irradiation of 405 nm.
Stability and degradability of the PPBT membrane
With the aim to explore the stability of the PPBT membrane at different storage times, the stability of bacterial monitoring and antibacterial ability was tested for storage for 0, 14 and 30 days. The results indicate that the PPBT membrane maintains a stable color change of bacterial monitoring after one month of storage (Fig. 11a) and retains potent antibacterial ability (Fig. 11b) at the same time. Additionally, the PPBT membrane soaked in PBS solution of lipase was completely degraded at 37 °C for only 3 h; this result confirms that the prepared nanofibrous PPBT membrane has an excellent biodegradable property.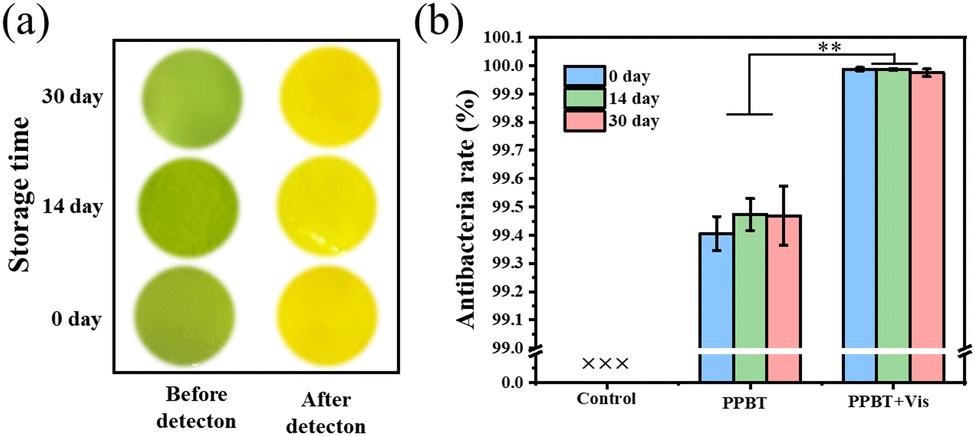 | ||
| Fig. 11 The stability of bacterial monitoring (a) and antibacterial ability (b) of the PPBT membrane after storing for 0, 14, and 30 days. | ||
Conclusions
In this work, an electrospun PPBT membrane with integrated visual monitoring of pathogenic microorganisms and responsive antimicrobial ability is successfully constructed. Bromothymol blue (BTB) is employed to sense the acidity caused by bacterial metabolism with color variation from green to yellow. Compared with the traditional bacterial monitoring strategy, the PPBT membrane achieves visual monitoring of S. aureus (∼105 CFU mL−1), E. coli (∼105 CFU mL−1), P. aeruginosa (∼105 CFU mL−1) and C. albicans (∼104 CFU mL−1) within 4 h, which is conducive to clinical diagnostics. Furthermore, TCS@ZIF-8 on the PPBT membrane is responsive to the triggers of acid and irradiation to release antimicrobial agents, thereby achieving an ideal antimicrobial effect. Overall, the prepared electrospun membrane is simple, easy to operate and portable, which provides a feasible scheme for bacterial monitoring and has application prospects in addressing skin infections.Author contributions
Min Wang: material preparation, experiment, data analysis, manuscript writing and review. Yuanzhang Jiang: data curation, writing and review. Kaiwen Zhuang, Lin Tan: supervision, experimental design, funding acquisition, writing – review & editing.Data availability
All relevant data are within the manuscript and it's additional files. The data that support the findings of this study are available from the authors upon reasonable requests.Conflicts of interest
All authors declare they have no competing or financial interests.Acknowledgements
This work was financially supported by the National Natural Science Foundation of China (52073186), Funding for Distinguished Young Scholars of Sichuan Province (23NSFJQ0001), Strategic Cooperation Projects of Yi Bin City and Sichuan University (No. 2020CDYB-6), Sichuan University Postdoctoral Interdisciplinary Innovation Fund (JXCK2231), and Funding of Engineering Characteristic Team, Sichuan University (2020SCUNG122).References
- Z. Zhu, Y. H. Liu, J. Y. Chen, Z. H. He, P. F. Tan, Y. He, X. B. Pei, J. Wang, L. Tan and Q. B. Wan, Adv. Sci., 2022, 9, 2204553 CrossRef CAS PubMed.
- M. Wang, F. Yang, H. Luo, Y. Z. Jiang, K. W. Zhuang and L. Tan, Biomacromolecules, 2023, 24, 4218–4228 CrossRef CAS PubMed.
- T. A. Harris-Tryon and E. A. Grice, Science, 2022, 376, 940 CrossRef CAS PubMed.
- K. T. Clebak and M. A. Malone, Primary Care, 2018, 45, 433–454 CrossRef PubMed.
- L. Cai, X. Zhu, H. Ruan, J. Yang, W. Wei, Y. Wu, L. Zhou, H. Jiang, M. Ji and J. Chen, J. Hazard. Mater., 2023, 452, 131290 CrossRef CAS PubMed.
- X. Xie, Y. Li, M. Zhang, Y. Lei, L. Luo, W. Zhang, J. Sun, N. Sattorov, K. Burkhonovich Makhmudov, M.-Q. Zhu and J. Wang, Chem. Eng. J., 2022, 443, 136437 CrossRef CAS.
- Y. R. Huang, W. J. Chen, J. Chung, J. Yin and J. Yoon, Chem. Soc. Rev., 2021, 50, 7725–7744 RSC.
- V. Velusamy, K. Arshak, O. Korostynska, K. Oliwa and C. Adley, Biotechnol. Adv., 2010, 28, 232–254 CrossRef CAS PubMed.
- C. Zhao, Y. Li, J. Zhao, H. Li, J. Xu, Z. Gao, C. Ding and Y.-Y. Song, ACS Appl. Nano Mater., 2023, 17, 13296–13309 CAS.
- M. Gong, P. Wan, D. Ma, M. Zhong, M. Liao, J. Ye, R. Shi and L. Zhang, Adv. Funct. Mater., 2019, 29, 1902127 CrossRef.
- P. Mostafalu, A. Tamayol, R. Rahimi, M. Ochoa and A. Khademhosseini, Small, 2018, 14, 1703509 CrossRef PubMed.
- Y. Song, H. Li, F. Lu, H. Wang, M. Zhang, J. Yang, J. Huang, H. Huang, Y. Liu and Z. Kang, J. Mater. Chem. B, 2017, 5, 6008–6015 RSC.
- Y. Sun, C. Zhao, J. Niu, J. Ren and X. Qu, ACS Cent. Sci., 2020, 6, 207–212 CrossRef CAS PubMed.
- L. Jia, W. Sun, W. Li, Y. Dong, L. Wu, M. D. A. Saldaña, Y. Gao, Y. Jin and W. Sun, Packag. Technol. Sci., 2023, 36, 549–556 CrossRef CAS.
- D. Pornpattananangkul, L. Zhang, S. Olson, S. Aryal, M. Obonyo, K. Vecchio, C.-M. Huang and L. Zhang, J. Am. Chem. Soc., 2011, 133, 4132–4139 CrossRef CAS PubMed.
- Y. Gao, W. Pei, Y. Yang, M. Li, H. Sun, M. Chen, X. Ma, H. Zhang, D. Qi and J. Wu, J. Mater. Chem. B, 2023, 11, 8046–8055 RSC.
- X. D. Wang, R. J. Meier and O. S. Wolfbeis, Angew. Chem., Int. Ed., 2013, 52, 406–409 CrossRef CAS PubMed.
- F. Wang, Y. Raval, H. Chen, T.-R. J. Tzeng, J. D. DesJardins and J. N. Anker, Adv. Healthcare Mater., 2014, 3, 197–204 CrossRef CAS PubMed.
- M. T. Arafat, M. M. Mahmud, S. Y. Wong and X. Li, J. Drug Delivery Sci. Technol., 2021, 61, 102297 CrossRef CAS.
- Z. Zhou, Q. Ke, M. Wu, L. Zhang and K. Jiang, ACS Mater. Lett., 2023, 5, 466–472 CrossRef CAS.
- M. Dong, X. Sun, L. Li, K. He, J. Wang, H. Zhang and L. Wang, J. Colloid Interface Sci., 2022, 610, 913–922 CrossRef CAS PubMed.
- M. L. Sun, Y. Liu, K. Jiao, W. Y. Jia, K. Z. Jiang, Z. Q. Cheng, G. M. Liu and Y. G. Luo, J. Mater. Chem. B, 2022, 10, 765–778 RSC.
- H. Luo, X.-Q. Yin, P.-F. Tan, Z.-P. Gu, Z.-M. Liu and L. Tan, J. Mater. Chem. B, 2021, 9, 2802–2815 RSC.
- Q. Xu, L. Zhang, Y. Liu, L. Cai, L. Zhou, H. Jiang and J. Chen, J. Nanostruct. Chem., 2024, 14, 137–151 CrossRef CAS.
- C. Tan, J. Wu and Z. Wen, ACS Omega, 2021, 6, 12977–12983 CrossRef CAS PubMed.
- P. Zhu, L. Z. Zhou, Y. Y. Song, L. Cai, M. H. Ji, J. Wang, G. Ruan and J. Chen, J. Mater. Chem. B, 2020, 8, 4899–4907 RSC.
- J. R. Dias, A. Sousa, A. Augusto, P. J. Bártolo and P. L. Granja, Polymers, 2022, 14, 3397 CrossRef CAS PubMed.
- F. Ahmed, S. Saleemi, Z. Khatri, M. I. Abro and I.-S. Kim, Carbohydr. Polym., 2015, 115, 388–393 CrossRef CAS PubMed.
- C. He, J. Sun, T. Zhao, Z. Hong, X. Zhuang, X. Chen and X. Jing, Biomacromolecules, 2006, 7, 252–258 CrossRef CAS PubMed.
- I. M. Deygen and V. Kudryashova, Colloids Surf., B, 2016, 141, 36–43 CrossRef CAS PubMed.
- G. Wang, H. He, J. Xu, X. Wang, T. Zhang, S. Huang, H. Li, P. Zhao and X. Liu, Sens. Actuators, B, 2022, 354, 131230 CrossRef CAS.
- S. Sutthasupa, C. Padungkit and S. Suriyong, Food Chem., 2021, 362, 130151 CrossRef CAS PubMed.
- R. T. Mogharbel, A. F. Al-Hossainy, A. Ibrahim, M. A. El-Aal, M. S. Zoromba, S. M. Ibrahim, A. Yahia and N. Farhan, J. Mater. Sci.: Mater. Electron., 2022, 33, 20556–20576 CrossRef CAS.
- G. Ren, Z. Li, W. Yang, M. Faheem, J. Xing, X. Zou, Q. Pan, G. Zhu and Y. Du, Sens. Actuators, B, 2019, 284, 421–427 CrossRef CAS.
- L. R. Qiu, C. C. Ouyang, W. Zhang, J. Liu, L. T. Yu, G. G. Chen and L. L. Ren, J. Nanobiotechnol., 2023, 21, 163 CrossRef CAS PubMed.
- C. Hang, Z. Wei, X. Jieyu, L. Man, Y. Ye, Z. Ling, W. Min, C. Danyang and G. Liang, ACS Appl. Nano Mater., 2023, 6, 15620–15631 CrossRef CAS.
- X. Hu, X. Yan, M. Zhou and S. Komarneni, Microporous Mesoporous Mater., 2016, 219, 311–316 CrossRef CAS.
- Z. Li, Z. Cao, C. Grande, W. Zhang, Y. Dou, X. Li, J. Fu, N. Shezad, F. Akhtar and A. Kaiser, RSC Adv., 2021, 12, 664–670 RSC.
- Z. Zou, S. Li, D. He, X. He, K. Wang, L. Li, X. Yang and H. Li, J. Mater. Chem. B, 2017, 5, 2126–2132 RSC.
- J. Xue, M. He, Y. Liang, A. Crawford, P. Coates, D. Chen, R. Shi and L. Zhang, J. Mater. Chem. B, 2014, 2, 6867–6877 RSC.
- I. Adala, J. Ramis, C. Ntone Moussinga, I. Janowski, M. H. Amer, A. J. Bennett, C. Alexander and F. R. A. J. Rose, J. Mater. Chem. B, 2021, 9, 4120–4133 RSC.
- L. Cao, X. Lin, X. Liu, M. Wu, S. Liu, T. Wang, D. Mao and B. Liu, Nano Lett., 2023, 23, 9769–9777 CrossRef CAS PubMed.
- L. Zhou, L. Cai, H. Ruan, L. Zhang, J. Wang, H. Jiang, Y. Wu, S. Feng and J. Chen, Int. J. Biol. Macromol., 2021, 183, 1145–1154 CrossRef CAS PubMed.
- M. Mirshekar, H. Afkhami, S. Razavi, F. Masjedian Jazi, D. Darban-Sarokhalil, E. Ohadi, M. M. Nezhad and R. Karimi, Burns, 2023, 49, 1944–1957 CrossRef PubMed.
- C. S. Y. Lim, R. Rosli, H.-F. Seow and P.-P. Chong, Int. J. Med. Microbiol., 2011, 301, 536–546 CrossRef CAS PubMed.
- J. He, W. Qu, Y. Feng, J. Jiang, J. Luo, Y. Wu and L. Peng, Chem. Eng. J., 2024, 493, 152453 CrossRef CAS.
- X. Liu, C. Guo, K. Zhuang, W. Chen, M. Zhang, Y. Dai, L. Tan and Y. Ran, PLoS Pathog., 2022, 18, e1010534 CrossRef CAS PubMed.
- B. Liu, Y. Yang, H. Wu, S. Wang, J. Tian, C. Dai and T. Liu, Small, 2023, 19, 2205682 CrossRef CAS PubMed.
- L. Cai, L. Zhang, J. Yang, X. Zhu, W. Wei, M. Ji, H. Jiang and J. Chen, ACS Appl. Mater. Interfaces, 2023, 15, 48978–48995 CrossRef CAS PubMed.
Footnote |
| † Electronic supplementary information (ESI) available: The synthesis, FTIR, XRD, and antibacterial ability of TCS@ZIF-8 nanoparticles; the chromogenic mechanism of BTB; the bacterial monitoring and antibacterial experiments of PPBT membrane. See DOI: https://doi.org/10.1039/d4tb00963k |
| This journal is © The Royal Society of Chemistry 2024 |