Charged species redistribution at electrochemical interfaces: a model system of the zirconium oxide/water interface†
Received
29th November 2022
, Accepted 25th January 2023
First published on 27th January 2023
Abstract
Quantifying the local distribution of charged defects in the solid state and charged ions in liquid solution near the oxide/liquid interface is key to understanding a range of important electrochemical processes, including oxygen reduction and evolution, corrosion and hydrogen evolution reactions. Based on a grand canonical approach relying on the electrochemical potential of individual charged species, a unified treatment of charged defects on the solid side and ions on the water side can be established. This approach is compatible with first-principles calculations where the formation free energy of individual charged species can be calculated and modulated by imposing certain electrochemical potential. Herein, we apply this framework to a system of monoclinic ZrO2(![[1 with combining macron]](https://www.rsc.org/images/entities/char_0031_0304.gif) 11)/water interface. The structure, defect chemistry and dynamical behavior of the electric double layer and space charge layer are analyzed with different pH values, water chemistry and doping elements in zirconium oxide. The model predicts ZrO2 solubility in water and the point of zero charge consistent with the experimentally-measured values. We reveal the effect of dopant elements on the concentrations of oxygen and hydrogen species at the surface of the ZrO2 passive layer in contact with water, uncovering an intrinsic trade-off between oxygen diffusion and hydrogen pickup during the corrosion of zirconium alloys. The solid/water interface model established here serves as the basis for modeling reaction and transport kinetics under doping and water chemistry effects.
11)/water interface. The structure, defect chemistry and dynamical behavior of the electric double layer and space charge layer are analyzed with different pH values, water chemistry and doping elements in zirconium oxide. The model predicts ZrO2 solubility in water and the point of zero charge consistent with the experimentally-measured values. We reveal the effect of dopant elements on the concentrations of oxygen and hydrogen species at the surface of the ZrO2 passive layer in contact with water, uncovering an intrinsic trade-off between oxygen diffusion and hydrogen pickup during the corrosion of zirconium alloys. The solid/water interface model established here serves as the basis for modeling reaction and transport kinetics under doping and water chemistry effects.
I. Introduction
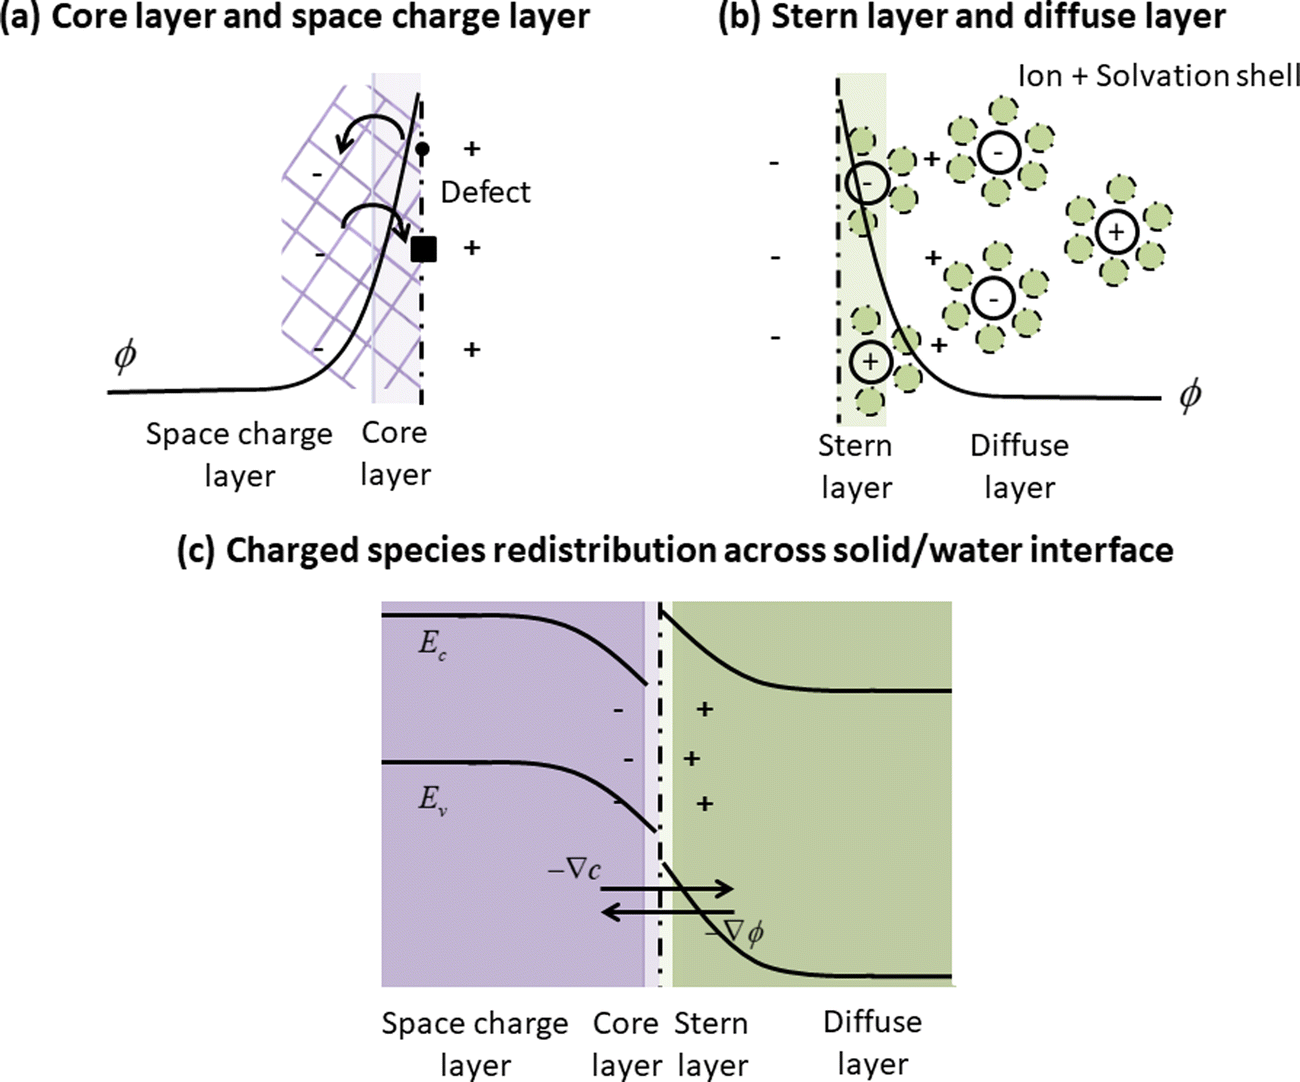
Redistribution of charged point defects in a space charge layer at oxide surfaces, interfaces, grain boundaries and dislocations has been shown to alter the magnetic, electronic, and transport properties of metal oxides.1–8 The formation of an electric double layer at an electrode/electrolyte interface has also been shown to influence the electrokinetics of such interfaces, which is important for engineering interfacial capacitance9–11 and catalytic activity.12–14 Both the space charge layer in the solid state and the electric double layer in the solution state come into play at an electrochemical interface. This interface poses significant challenges to the field of first-principles computational electrochemistry in terms of both accurately evaluating the interplay between the interfacial charged species and validating such results with macroscopically-measurable values.15 In recent studies there has been great momentum in applying novel first-principles based methods to obtain the electronic structures and ion dynamics of water and at the solid/water interface.16–18 While these methods are powerful in predicting the structures and kinetics locally, there are still important gaps towards a self-consistent model for charged species redistribution, which occurs on a scale beyond the capability of electronic structure methods. Multi-scale models that link atomistic simulations with macroscopic properties are required to address this challenge.19–22 So far, such a first-principles based thermodynamic framework has demonstrated the capability of predicting electrochemical phase diagrams at variable potential and pH.23–25 However, they have not yet been used to predict spatially-resolved charged species concentrations in the electric double layer including full description of solid defect chemistry. Having access to such redistribution profiles serves as a foundation for modeling electron- and ion-transfer reactions at solid/water interfaces, providing fundamental guiding principles for defect engineering in such systems.
In this work, we extend the established first-principles based framework for modeling defect redistribution across oxide hetero-interfaces (ref. 26 and the references therein) to the oxide/water interface. This advance is made possible by recognizing the similarity between the space charge layer structure in oxide materials and the electric double layer structure in liquid solution, as shown in Fig. 1. At an oxide surface (or interface), we consider a core layer, where charged defects have non-zero segregation energies due to structural relaxation and pose a net potential, and a space charge layer, where charged defects redistribute through the mechanism of drift-diffusion for compensating the charged core layer (Fig. 1(a)). For the electric double layer in the liquid, the Stern–Gouy–Chapman model27 defines a surface adsorption layer or a Stern layer, where ions adsorb specifically to the solid surface, and a diffuse layer, where ions redistribute under electrostatic forces and chemical gradients (Fig. 1(b)). In both cases, the space is separated into an interfacial layer with local segregation/adsorption and an extended redistribution region governed by the drift-diffusion model.1 Combining this insight with the unified grand canonical description of charged defects in solids and ion species in water solution,22 we are able to model an oxide/water interface (Fig. 1(c)) in the same way as an oxide/oxide interface, where now we treat water as an insulator with a wide electronic band gap.28
 |
| | Fig. 1 Schematics of (a) the core and space charge layer at a solid surface, (b) the Stern layer and the diffuse layer in liquid solution in contact with a solid surface, and (c) the unifying picture of charged species redistribution across a solid/water interface, where the core layer is analogous to the Stern layer, and space charge layer to the diffuse layer. By incorporating the grand canonical description of ion species in water, the framework for modeling charged species distribution across solid/solid interfaces26 is extended to the solid/water interface. Here ϕ represents the electrostatic potential. ∇ϕ and ∇c represent the gradient of electrostatic potential and charged species concentration, respectively, which are the two driving forces of charged species redistribution in the drift-diffusion model. | |
In the following sections, we first give a comprehensive introduction to the first-principles based framework for modeling charged species redistribution across an electrochemical interface. We demonstrate the capability of this model on a monoclinic-ZrO2/water interface system, which is of interest in the context of zirconium alloy corrosion in nuclear water reactors29 and degradation of bio-compatible ZrO2.30 In both cases, the kinetics of oxygen and hydrogen incorporation into the ZrO2 matrix is the key property to engineer. We first studied the change in water chemistry and interfacial electrostatic profiles as a function of the solution pH. We validate these results based on the consistency of the predicted ZrO2 solubility in water and point of zero charge (PZC) with the experimentally measured values. We also applied this model to ZrO2 with different dopants, aiming to provide doping strategies that minimize oxygen and hydrogen incorporation for mitigating corrosion reactions on ZrO2, which ultimately leads to the corrosion of the underlying zirconium metal. The results revealed an intrinsic trade-off between the desired bulk defect chemistry and the space charge chemistry. While doping with 5+ cations could suppress the concentration of positively-charged hydrogen interstitials in bulk ZrO2, it also promotes the local hydrogen concentration in the interfacial zone. On the other hand, doping with 3+ cations depletes hydrogen in the space charge layer, meanwhile increasing the hydrogen interstitial concentration in the bulk. These results show a complex interplay between the bulk and the interface defect chemistry at an electrochemical interface, and demonstrate the value of such a unified model, which links point defect chemistry with electrochemical properties.
II. Theoretical framework
In this section we provide a detailed description of our approach for linking water chemistry with oxide point defect chemistry and self-consistently predicting the redistribution profiles of ions and charged defects across the interface. First, we briefly review how to predict bulk defect equilibria in a bulk oxide material. Second, we discuss how to predict water chemistry in equilibrium with a dissolved oxide and validate our prediction by comparing to experimental observations. Finally, we present the formulism of the continuum level modeling of the space charge layer and electric double layer in a self-consistent way.
Density functional theory (DFT) calculations involved in this work were performed by Vienna Ab initio Simulation Package (VASP).31–34 Generalized gradient approximation (GGA) with the Perdew–Burke–Ernzerhof (PBE) functional is used throughout.35,36 We used pseudopotentials constructed using the projector augmented wave method which treat 4s24p64d25s2 electrons for zirconium and 2s22p4 for oxygen as valence electrons. The plane-wave cutoff energy was set to 450 eV. Details of obtaining defect chemistry of m-ZrO2 with metal dopants and hydrogen defects can be found in ref. 37. Details of establishing the continuum-level modeling framework for oxide/oxide interface systems can be found in ref. 26.
A. Predicting bulk defect chemistry of ZrO2
Predicting bulk defect equilibria of ZrO2 from first-principles has been well-established37,38 and validated.39,40 Here we briefly describe the grand canonical framework41 and will draw the analogy between point defects in a solid and ions in water22 in the next section. To predict point defect equilibria from first-principles calculation, we define the formation energy of each charged defect Dq with charge q as| |  | (1) |
Here EDFTdefective and EDFTperfect represent the DFT-calculated energy for the defective cell and perfect cell, respectively. μi is the chemical potential for each chemical species in the system and ΔNi is the relative number of atoms for element i with respect to the perfect cell. For example, ΔN0 = −1 for oxygen vacancy. EVBM denotes the valence band maximum and μe is the electron chemical potential or the Fermi level referenced to EVBM. Ecorr is the correction for finite-size effects of the charged defect calculations, and here we take the first-order Makov–Payne correction.42
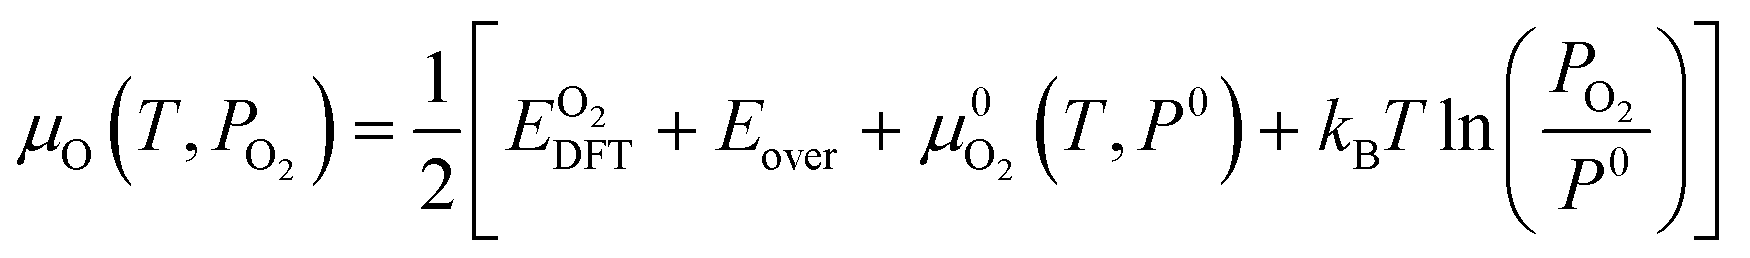
In the context of doped ZrO2 immersed in water solution, we define the chemical potential of each element as follows. The chemical potential of oxygen is determined by oxygen partial pressure PO2 and temperature T.
| |  | (2) |
Here

is the energy of oxygen molecule calculated by DFT.
Eover is the correction term for oxygen overbinding created by semilocal functionals. With the parameters used in this work,
Eover equals 1.12 eV.

represents the tabulated chemical potential of oxygen gas at a reference pressure
P0 = 0.1 MPa and a reference
T = 0 K.
37kB is the Boltzmann constant. With
μO defined,
μZr and
μH can be defined as follows.
| | 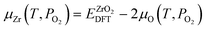 | (3) |
| |  | (4) |

and

represent the DFT calculated energy for one unit formula of ZrO
2 in the solid monoclinic phase and one water molecule in the gas phase, respectively.

is the reference free energy of liquid water from the NIST standard reference database.
43 Since the free energy change of crystalline solids with temperature and pressure is negligible,
μZr is approximated by the 0 K DFT energy without any finite temperature contribution. In other words,

is taken as 0. For doped ZrO
2, the dopant element
M is included as a fourth element. Here we consider that the dopant could either form an interstitial defect
Mi or a substitutional defect
MZr. We use a fixed concentration scheme for treating extrinsic doping, where
μM is tuned to satisfy the desired doping level given the chemical potential of all other elements.
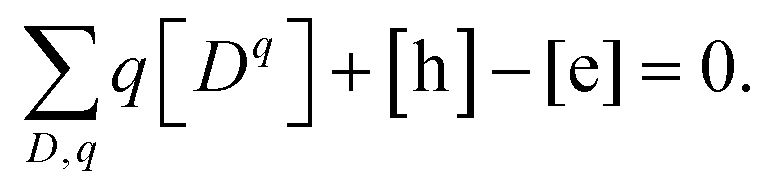
Now the only undetermined term in eqn (1) is the electron chemical potential μe. This term is solved for from the total charge neutrality constraint
| |  | (5) |
Here we are summing over all the charged defects and adding the charge of free electrons [e] and holes [h]. In this work, [
Dq] is expressed by
| | 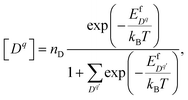 | (6) |
where
nD is the number of possible sites for the defect to reside per unit formula. In the denominator we sum over all defect species,
Dq, that could take the same site as
Dq. This expression is referred to as the Fermi-Dirac form, and is derived from minimizing total free energy of the system and the denominator arises because of the form of configurational entropy.
44 Here we use the Fermi-Dirac formalism instead of the simplified Boltzmann formalism, which assumes that defects do not interact except for the mean-field electrostatic force, because the latter produces unphysical concentrations in the Stern layer where the adsorbate coverage is high and the entropic term cannot be ignored.
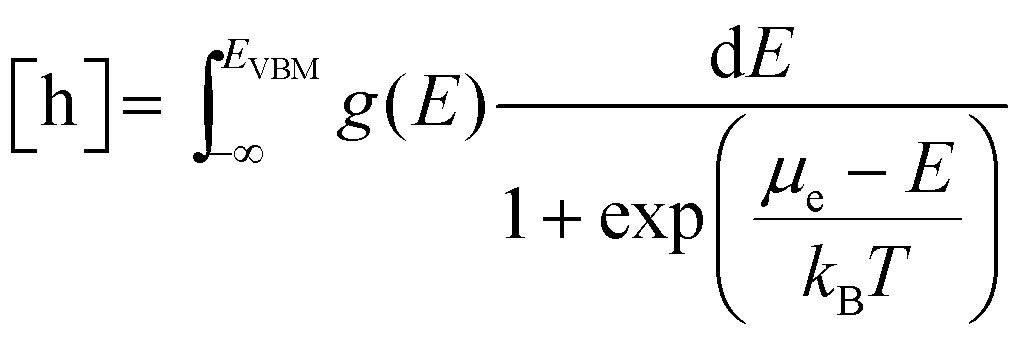
[e] and [h] can also be expressed as a function of μe as follows:
| |  | (7) |
| |  | (8) |
Here
g(
E) is the electronic density of states (DOS) calculated by DFT for bulk ZrO
2 without the dopant. This is under the assumption that dopant concentration is not large enough to form continuous bands perturbing the host (ZrO
2) original bands.
ECBM is the conduction band minimum and
EVBM the valence band maximum.
B. Quantifying ion concentration in water
The idea of treating liquid water as a large-band-gap amorphous semiconductor dates back to the 1970s and is widely acknowledged.28 Numerous attempts, both experimental and computational, have been made to measure the absolute band energy positions for liquid water.45–47 One commonly accepted value is from Coe48 with an electron affinity of −0.12 eV and an electronic band gap of 7.0 eV. With this description, ions in liquid water could be treated in similar ways as charged point defects in solids, which serves as a bridge between electrochemistry and semiconductor physics.22 We arrive at an expression for Gibbs free energies of ions, which is very similar to eqn (1):| | 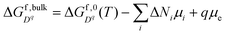 | (9) |
Here  is the standard Gibbs free energy of formation at temperature T, which is well-tabulated for common ion species.49 We should notice that the numerical values of μi are different in water and in solid. Because we are dealing with DFT-calculated values for defect formation energies previously, μi is referenced to 0 K conditions. In eqn (9), μi is referenced to standard conditions (T = 298.15 K, pO2 = 1 bar). A detailed formalism of how μH and μO are calculated with varying potentials and pH values can be found in ref. 22. In this paper, we use the oxygen-rich condition as in ref. 22 where the chemical potential of oxygen atom is calculated from oxygen molecules. In other words, μO = 0 (T = 298.15 K, pO2 = 1 bar). Under this condition, the Fermi level of water lies at −5.5 eV with respect to the vacuum level at pH = 7. The corresponding μH is calculated by μH = [G°(H2O) −μO]/2. A detailed comparison between oxygen-rich and hydrogen-rich conditions can be found in the ESI,† Section S1.
Analogous to extrinsic doping in semiconducting solids, we can also tune water chemistry with intentional additives. In this study we considered water chemistry with varying pH values, which is achieved by adding fictitious A+ or B− ions into the system. These ions could be Na+ and Cl−, simulating the process of adding NaOH or HCl to the solution, we assume that they do not interact with other ionic species except for the Coulombic effect. This representation could correspond to any base or acid given that they do not react actively with ZrO2.
With this formulation, the grand canonical approach described previously could also account for the equilibrium ion concentration in bulk water solution. We can solve for μe under the constraint of total ion charge neutrality as in eqn (5) and (6). In the case of water, electron and hole concentrations are set to zero because of the very wide band gap of water. After obtaining μe, we can calculate the equilibrium concentrations of all ionic species and the corresponding pH value pH = log10[H+]. The advantage of this approach compared to considering the dissociation reaction equilibrium is that it is much easier to include multiple ions into the system, as long as their standard formation energies are known. We will demonstrate the power of this scheme with the case of ZrO2 dissolved in water solution. In this work all results presented are at room temperature for benchmarking ZrO2 solubility data and point of zero charge. However, this solution scheme is transferrable to elevated temperatures provided that ion formation free energy data are available.
C. Continuum level modeling of the core/space charge layer in the solid and electric double layer in the liquid
By making the analogy between ions in water solution and charged defects in solid, we can now unify the concepts of the electrical double layer in the liquid and the core/space-charge zone in the solid. Previously defined segregation energy in the solid side in the vicinity of the interface is equivalent to the adsorption energy of ions attached to the solid surface from the water side. The core zone at the solid–solid interface is analogous to the compact layer (or Stern layer) in the electrical double layer and the space charge layer in the solid is analogous to the diffuse layer in the water. The advantage of this generalization is that the previously established modeling scheme for the solid–solid hetero-interface26 can now be easily applied to the solid–water interface, and serves as the basis of a universal treatment framework for interfaces between different phases of matter. In this section, we briefly review the continuum level modeling process to obtain profiles of the space-charge layer and electric double layer. The details of how the band positions of water and ZrO2 are aligned can be found in the ESI,† Section S2.
The formation free energies of charged species in bulk solid and liquid as described in eqn (1) and (9) can be extended to the interface by adding the electrostatic potential, the segregation energy, and the adsorption energy terms. The segregation and adsorption energies affect the core/Stern layer, and the electrostatic potential distribution arising from the core/Stern layer affects the rest of the system.
| |  | (10) |
| |  | (11) |
Here
z represents the one-dimensional axis perpendicular to the interface.

is the bulk defect formation energy as defined by
eqn (1) and

is the Gibbs free energy of ion species as defined in
eqn (9). Δ
ϕ =
ϕ(
z) −
ϕbulk is the electrostatic potential difference between the bulk and location
z.

and

represent the segregation energy of defect species to the core layer and the adsorption energy of ion species in the Stern layer, respectively. In this work, we considered the adsorption free energy only for H
+ and OH
− ions, which are the two dominating ion species in the related chemical environment. The adsorption free energies are 0.20 eV for H
+ and 0.15 eV for OH
− as found in our
ab initio molecular dynamics (AIMD) study of the ZrO
2(
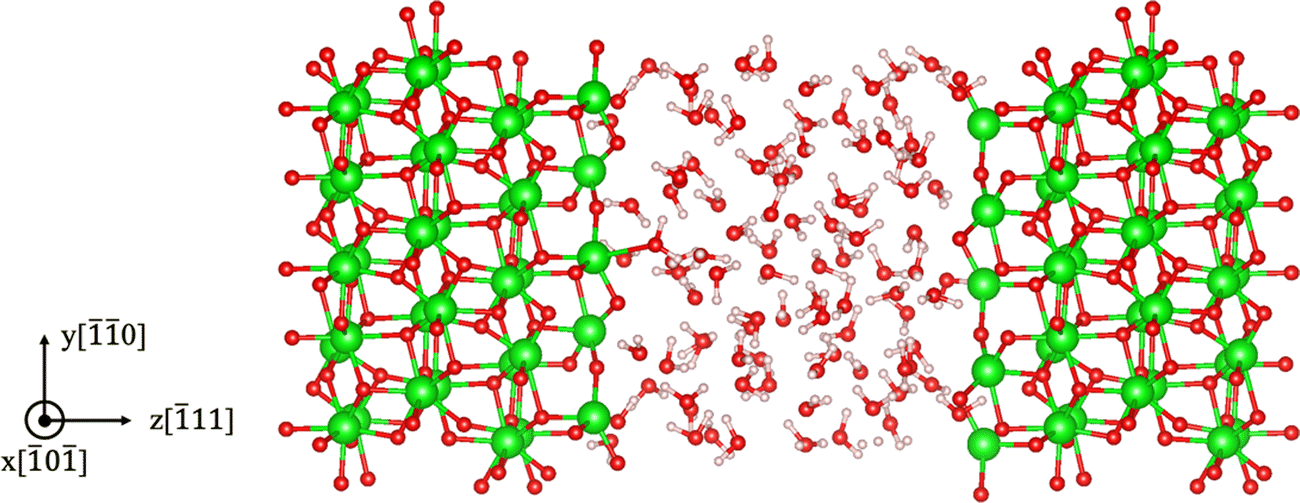
11)/water interface, and the Stern layer width is taken as 3 Å as read from the adsorption energy profiles from our previous work.
50 The atomistic model used for the AIMD calculation is shown in
Fig. 2. Defect segregation energy at the ZrO
2 surface is neglected given that defect concentrations in the solid are much lower compared to ion concentrations in the liquid, and so the core charge should be determined by the adsorbates from the liquid rather than charged defect segregation from the solid. In addition, there is no straightforward scheme for calculating the segregation energy of oxygen vacancies on the ZrO
2 surface immersed in water, as the vacancy site gets filled by water during the MD sampling. We also note that this definition of

and

is closely connected to the electrochemical potential of charged defects,
1,51 which should be constant throughout the system when equilibrium is reached. This connection has been discussed in detail in the ESI,
† Section S3 of our previous work.
26
 |
| | Fig. 2 m-ZrO2 (11)/water interface as modeled in ab initio molecular dynamics (AIMD) simulations for calculating the surface adsorption energies of H+ and OH− ions. The white, red, and green spheres represent hydrogen, oxygen, and zirconium atoms, respectively. | |
Eqn (10) and (11) can be plugged back into eqn (6) and produces the local charge density ρ
| |  | (12) |
where the [e] and [h] are taken as zero in water as there is no free electrons or holes in the water solution.
With these definitions, we can solve Poisson's equation that governs the electrostatic potential distribution.
| |  | (13) |
ε
0 and εr are the permittivity of vacuum and relative permittivity of the host material. Here εr of ZrO2 is taken as 2052 and εr of H2O as 80,53 respectively, assuming that the dielectric constant does not change spatially at the interfacial zone. Eqn (13) is solved with the boundary conditions
| |  | (14) |
| |  | (15) |
Here
z = 0 and
L represents the two ends of the simulation cell,
i.e. bulk oxide and bulk water. At the interface,
ϕboundary is determined by the global charge neutrality constraint
| |  | (16) |
while satisfying the continuity of the displacement field.
A detailed description of the solution scheme is provided in the ESI,† Section S3.
III. Results and discussion
In this section, we apply the described framework on the interface between doped-ZrO2 and water. This model system is of interest in ZrO2 passive films that form on zirconium alloys due to corrosion in water.54 In particular, we look into oxygen and hydrogen incorporation into the ZrO2 passive film as a function of varying pH values and doping concentrations. We divide this section into four parts. First, we show the predicted water chemistry with dissolved ZrO2 at varying pH values and benchmark the prediction with experimental measurements at room temperature. A good agreement is reached between the predicted and experimentally measured ZrO2 solubility. Second, we examine the electrostatic profiles across the ZrO2/water interface with changing pH. We compare the resulting point of zero charge with the experimentally measured values. Third, we discuss the implication of these results in the context of the kinetics of zirconium alloy corrosion by examining the effect of different alloying elements on the surface space charge layer. We conclude that by including surface space–charge effect, we can explain the experimentally observed inverse relationship between the hydrogen pickup fraction and oxidation kinetics observed for zirconium alloys55 and the effect of different dopant elements. Finally, we discuss the possible improvements and extensions of the current model.
A. Water chemistry with dissolved ZrO2
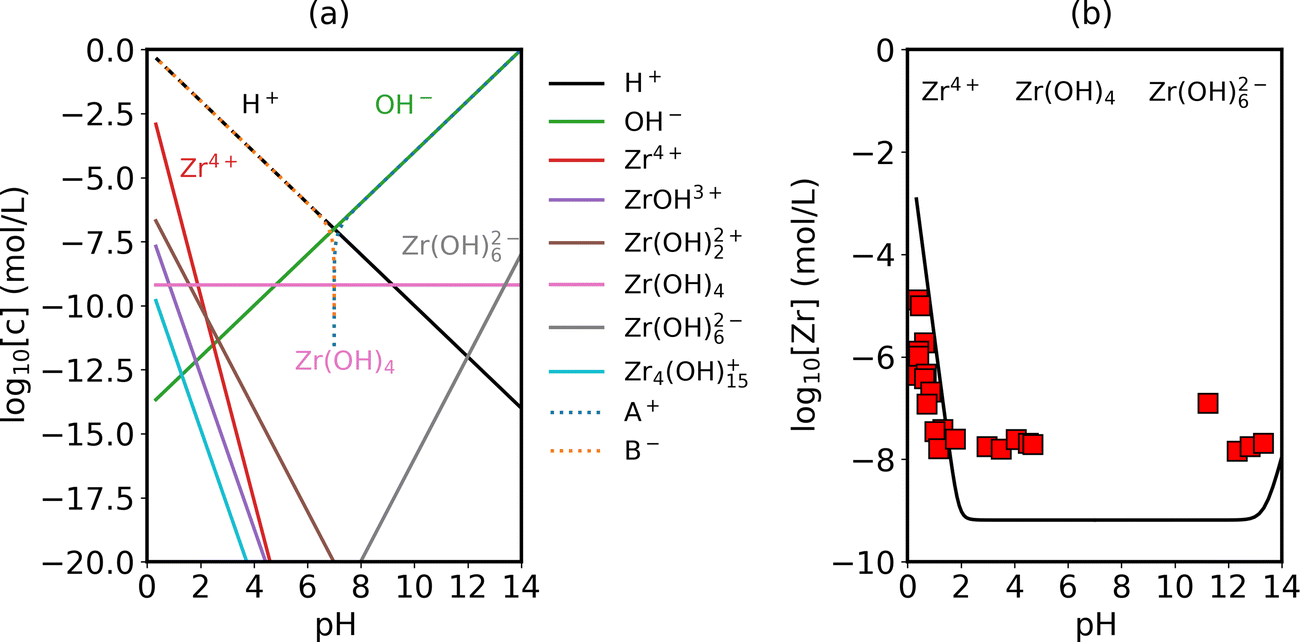
Following the method described in Part IIB, we predict the equilibrium ion concentrations in water with dissolved ZrO2. Here, Zr-related species are not predicted by considering any specific dissolution reaction equilibrium, but by including their formation free energies following the grand-canonical representation. In Fig. 3(a) we list the specific Zr-related species included in this work and plot their equilibrium concentrations with varying pH values. Looking closely at water chemistry, the dominant ion species across the pH range are either HB or AOH, with B+ and A− being the fictitious ion representing controlled additives (for example, Na+ and Cl−). With negligible B+ or A− additives (<10−7 mol L−1), The pH of water remains at 7. The value of this model is the ability to obtain the concentration of Zr-related ion species as a function of pH. In the intermediate pH range (2–13), ZrO2 does not dissolve significantly in water and the dominant dissolution species is Zr(OH)4. In the strong acidic regime, we observe a rise of solubility in the form of Zr4+ and in the strong alkali regime a rise of Zr(OH)62−.
 |
| | Fig. 3 (a) Predicted water chemistry in equilibrium with ZrO2 as a function of pH at room temperature. pH control is realized by adding fictitious A+ or B− ions into the system (for example, Na+ and Cl−). (b) Calculated zirconium solubility in water as a function of pH (black line) in comparison with experimental measurements (red squares).56 Concentrations below 10−8 mol L−1 are beyond the measurement precision. Transition in the slope of the curve corresponds to a change in the dominant Zr-related species in water, going from Zr4+ (acid conditions) to Zr(OH)4 (neutral conditions) to Zr(OH)62− (alkali conditions). | |
Adding up the concentrations of Zr-related species in Fig. 3(a), we arrive at Fig. 3(b), which predicts zirconium solubility in water as a function of pH. We compare our prediction with experimentally measured values.56 It should be noted that the detection limit of the experiment cited here is about 10−8 mol L−1 and the measured points around this value are likely to be over-estimating the solubility. Our key observation is that the predicted transition point in the acidic regime where ZrO2 begins to dissolve significantly matches well with the experiment. In this regime our predicted solubility also reaches quantitative agreement with the experimentally measured values. This predictive model is useful for a low-solubility material system where it takes months to reach equilibrium state and hard to get accurate measurements experimentally.56 In addition, it provides insight into the concentration of each dissolution product. With this validation of water chemistry with dissolved ZrO2, we can further combine this information with bulk defect chemistry of ZrO2 (details in ref. 37 and ESI,† Section S4) and obtain the redistribution of these charged species near the interface, which is presented in the following sections.
B. Electrostatic profile across ZrO2/water interface with changing pH
In this section we closely examine the resulting electrostatic profile across the ZrO2/water interface and look at how the profiles change with pH. A closely related validation criterion here is the predicted point of zero charge, the pH level at which the total charge density on the surface reaches zero. In Fig. 4, we first look at the redistribution profiles in water solution with pH = 7. We observe that there is a potential built-up of 0.7 V across the interface, accompanied by the enrichment of negatively charged defects on the ZrO2 side and positively charge ions (H+) on the water side. This is also reflected in Fig. 4(c), where we observe a negative charge built up in ZrO2 and positive charge built up in water near the interface. The negatively charged defect species in ZrO2 are mainly hydrogen-related defects, for example  and
and  . All other types of native defects have very low concentrations in the intrinsic, undoped ZrO2. In the Stern layer, the built-up effect is more significant given the higher adsorption energy of H+ compared to OH−. In this case of pH-neutral water, we observe an 8-order-of-magitude increase in the H+ concentration in the Stern layer compared to bulk water, which is consistent with previous AIMD observation, which also predicts significant H+ adsorption.50 The multi-scale model enables us to quantify the concentration of surface adsorbates and how they change with pH and solid defect chemistry.
 |
| | Fig. 4 (a) Electrostatic potential ϕ, (b) concentration of charged species [Dq] and (c) charge concentration ρ across the ZrO2/water interface at pH = 7 and oxygen-rich conditions. The interface is placed at z = 0 with the left side being ZrO2 and the right side being water. H+ and OH− concentrations in the Stern layer are explicitly marked with squares. | |
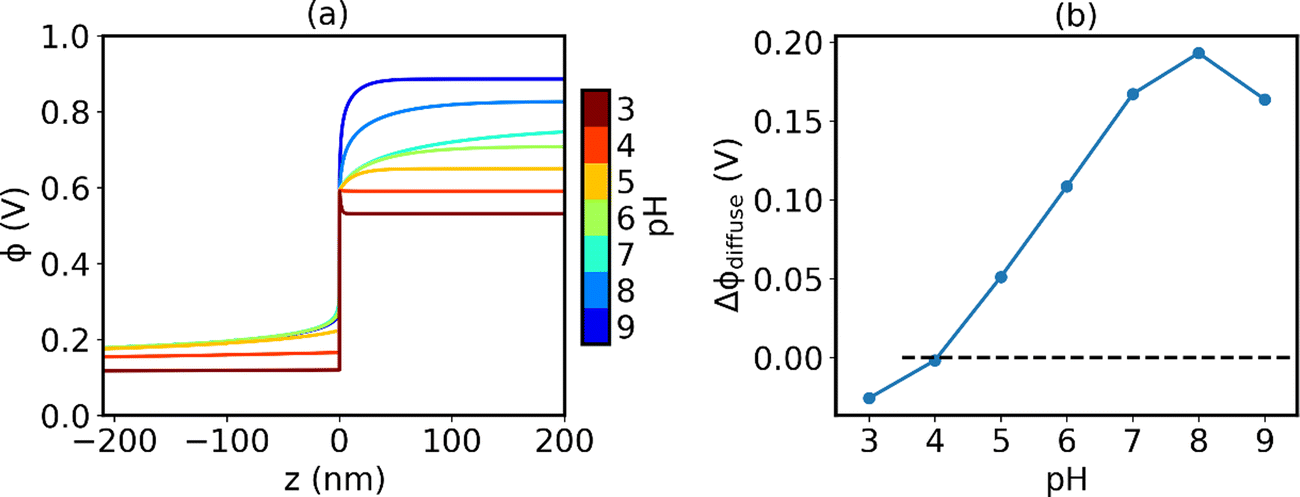
At the point of zero charge, there is no potential built-up in the diffuse layer. The space layer is negatively charged, which is compensated by surface adsorbates in the Stern layer alone. In other words, segregated defects and specifically-adsorbed ions add up to a charge-neutral ZrO2 surface. In Fig. 5(a) we show the electrostatic potential profile with varying pH values of the water solution. Changing pH influences the electrostatic profile in two ways. First, increasing pH corresponds to a higher Fermi level in water, and thus a larger potential difference on the two sides. This change is clearly demonstrated in Fig. 5(a) if we compare ϕ in the bulk region of the two sides. Second and more importantly, varying pH changes the total charge in the Stern layer. At lower pH and higher H+ concentration, the magnitude of H+ segregation is much greater compared to OH− and therefore the Stern layer could effectively screen the negative charge of ZrO2. The combination of both effects leads to a flip of sign in ϕdiffuse, the potential drop in the diffuse layer, at pH = 4. The potential drop in the diffuse layer as a function of water pH is plotted in Fig. 5(b). At the point where ϕdiffuse = 0, the negative charge on the ZrO2 side is completely compensated by the positive charge in the Stern layer and the surface is effectively charge neutral. In our model, this predicted PZC is at pH = 4.1.
 |
| | Fig. 5 (a) Electrostatic potential profile with varying pH values of water solution. (b) Potential drop in the diffuse layer Δϕdiffuse as a function of pH. The point where the potential drop reaches zero corresponds to PZC. | |
Experimentally, reported values of PZC of ZrO2 are somewhat scattered, ranging from 3.9 (303 K),57 5.5 (room temperature),58 6.5 (298 K),59 to 8.5 (measured at room temperature with high temperature treatment of the sample).60 One possible explanation of this scatter is that the measured PZC changes with the background electrolyte concentration.57 It has been observed that when using NaNO3 as the background electrolyte, PZC of ZrO2 increases with increasing NaNO3 concentration, from 3.6 with 0.001 M NaNO3 to 4.2 with 0.1 M NaNO3. This indicates a favored adsorption of NO3− compared to Na+. In the modeling framework of our work, we assume no specific adsorption of the background electrolyte species other than electrostatic interaction. Therefore, we expect that the predicted value is lower than the realistic values in the presence of adsorption of ions other than H+ and OH− in the Stern layer. Based on this discussion, we believe that it is reasonable that our predicted PZC value falls in the lower range of the experimentally measured values.
C. Effect of dopants and implication for zirconium alloy corrosion kinetics
In Section B, we have examined the influence of water chemistry on the interfacial potential and concentration profiles systematically. In this section, we investigate the effect of doping in the solid side. One key strength of using the grand canonical description of charged species is that it is straightforward to add defect species into the model without enumerating all possible defect reactions. To demonstrate this capability and to address the engineering problem of oxygen and hydrogen incorporation into zirconium alloys via the passive zirconium oxide film, we applied this model to differently-doped ZrO2 and examined the subsequent changes in the space charge layer profile. Four types of dopants are studied, Cr and Fe in a mixture of 3+, 4+ and 5+ oxidation states, Sn in dominantly 4 +, and Nb in dominantly 5+ state. These dopants are all common alloying elements in commercially used zirconium alloys54 and the bulk defect chemistry of ZrO2 doped with these elements has been carefully studied in our previous work37 and subsequently validated by the experiment.61 We fix the bulk doping concentration to be 10 ppm, which is representative of a realistic impurity concentration in ZrO2 grown natively on a zirconium alloy.55 After doping the bulk of the solid, the electric double layer and space charge layer profiles are solved self-consistently to achieve global charge neutrality. The resulting surface defect concentration profiles are shown in Fig. 6. The corresponding potential profiles can be found in the ESI,† Section S5.
 |
| | Fig. 6 Defect redistribution in the space charge layer of doped-ZrO2 in contact with water under standard hydrogen electrode (SHE) conditions. Various dopants are shown for comparison with (a) Cr-doped, (b) Fe-doped, (c) Sn-doped, and (d) Nb-doped. For each dopant, a fixed doping level of 10 ppm in bulk is considered. Defect M in each figure represents the corresponding metal dopant. | |
In all cases, the surface remains negatively charged at pH = 7, meaning that negatively charged defect species accumulate in the space charge region of the ZrO2 surface, while positively charged species deplete. In Sn-doped ZrO2, since Sn exists dominantly in the form of neutral Sn×Zr, the dopant has little effect on either the bulk defect chemistry or the charged defect redistribution. The effect of aliovalent dopants is more complicated. In the case of Cr and Fe, we observe a mixture of M•Zr (5+ valence state), M×Zr (4+ valence state), and  (3+ valence state). Under oxygen rich conditions at room temperature, chromium exists in ZrO2 in approximately equal concentration of Cr×Zr and
  , with a far lower contribution from Cr•Zr. Iron exists dominantly in the form of Fe×Zr, with less contribution from the 3+ valence state compared to chromium. In other words, despite that the dopant concentration is fixed to 10 ppm in bulk, Cr contributes more negatively charged doping species compared to Fe. This is reflected in both the length and the potential of the space charge layer profile. Because Cr contributes effectively more charged defect concentration, the space charge layer length is significantly shortened. The magnitude of space charge effect follows a monotonically decreasing trend going from Cr to Nb. Cr and Fe decrease the Fermi level of ZrO2 and therefore increases the Fermi level difference between ZrO2 and water. The converse is true for Nb where only about 0.2 eV built-up potential is found on the ZrO2 side.
To study the effect of these dopants on oxygen and hydrogen incorporation in ZrO2, in Fig. 7 we compare the concentration of related defect species in bulk (dashed line) and at surface (solid line) for differently doped ZrO2. In Fig. 7(a), we show the concentrations of H•i and  , which are representative of hydrogen and oxygen diffusion kinetics in ZrO2. Note that the concentration of oxygen vacancies under oxygen rich conditions is negligible, hence the focus is on oxygen interstitials. We observe a monotonic decrease in H•i and increase in
  going from acceptor dopants to donor dopants, which results from the corresponding increase in the Fermi level. A similar trend is observed for electrons and holes (Fig. 7(b)). Since the dominating electronic defect under this condition is always holes, 5+ dopants (Nb) contribute to decreasing electronic conductivity. Fig. 7(c) shows the total hydrogen solubility in bulk ZrO2 and local hydrogen solubility at the surface. In bulk we observe a valley shape curve as shown in our previous work.37 On the left branch of the valley the dominant charge compensation mechanism is
  with positively charged hydrogen defects, H•i and H5Zr•. On the right branch of the valley the dominant charge compensation mechanism is MZr with negatively charged hydrogen defects,
  and
and  . Due to the sign change of the dominant hydrogen defect species, the effect of the surface space charge layer on local hydrogen concentration is reversed. For Cr- and Fe-doped ZrO2, positively charged hydrogen defects are depleted in the space charge layer, leading to reduction in the surface hydrogen concentration. For Nb-doped ZrO2 the trend is reversed, and surface hydrogen concentration is increased. The H+ adsorption effect also follows a monotonic decreasing trend due to the decreasing magnitude of the built-up potential on the water side going from Cr to Nb (Fig. 7(d)). With varying dopant concentrations, these conclusions remain qualitatively unchanged. Results with a changing doping level can be found in the ESI,† Section S6.
 |
| | Fig. 7 Comparison of the surface (represented by the solid line and circles) and the bulk concentration (represented by the dashed line and squares) of species related to oxygen and hydrogen incorporation in the differently doped ZrO2: (a) H•i and  , (b) free electrons and holes, and (c) total concentration of hydrogen. (d) H+ and OH− in bulk water and at the interface. All calculations are carried out at pH = 7 and oxygen rich conditions. Dopant concentrations are fixed to 10 ppm in the bulk. Doping label Zr represents undoped ZrO2. , (b) free electrons and holes, and (c) total concentration of hydrogen. (d) H+ and OH− in bulk water and at the interface. All calculations are carried out at pH = 7 and oxygen rich conditions. Dopant concentrations are fixed to 10 ppm in the bulk. Doping label Zr represents undoped ZrO2. | |
The above analysis, though conducted at room temperature, provides implications to oxygen and hydrogen incorporation kinetics in ZrO2 at high-temperature (∼600 K) operating conditions. We predict that Nb decreases hydrogen diffusivity by decreasing the concentration of interstitial protons. Additionally, Nb increases the free electron concentration, which reduces the amount of hydrogen incorporated into the ZrO2 matrix.37 This effect is accompanied by increased oxygen diffusivity due to the increase in oxygen interstitials in Nb-doped ZrO2. This observation is consistent with the findings of corrosion experiments where high oxidation rate and low hydrogen pickup rate are observed in Zr–Nb alloys in comparison to pure zirconium and Nb-free zirconium alloys.55 For zirconium alloys containing Fe, Cr, and Sn, the situation is more complicated because these dopants can exist both in dissolved form and in precipitates. Experimental evidence has shown that these elements influence the degradation rate through a coupled chemical and mechanical mechanism.62,63 The space-charge profiles presented here contribute to the decoupling of these effects. Given the above analysis, we conclude that both the water chemistry and the solid-state defect chemistry contribute non-negligibly to the surface space charge effect. On one hand, the water pH determines the specific adsorption of H+ ions in the Stern layer, which is the major contributor for screening the surface charge, as shown in the point of zero charge analysis in Fig. 5. On the other hand, the bulk defect chemistry of ZrO2 controls the solubility of hydrogen as well as the concentrations of electronic charge carriers. Only by solving for the redistribution profiles self-consistently can one obtain a correct description for the surface potential and chemical composition, which governs the surface charge and ionic transport. In order to accurately predict the reaction and transport kinetics at a solid/water interface, it is important to consider the water chemistry and the solid-state defect chemistry in a holistic manner. While existing methods generally consider only one of the two factors, the current work provides a systematic approach for explicitly including both water chemistry and defect chemistry in predicting interfacial space charge profiles, which is an important step in establishing fully first-principles based models for electrochemical interfaces.
IV. Conclusion
In this work we present a first-principles based computational framework for modeling charged species redistribution at a solid/liquid electrochemical interface. The method uses a unified grand canonical description for ion species in water solution and charged defects in a solid oxide material. This approach allows for facile survey of different water and oxide chemistries. The application of this model on the monoclinic ZrO2/water model system yielded consistency with experimental measurements in terms of predicting the ZrO2 solubility limit in water and the point of zero charge of monoclinic ZrO2. We also investigate how the interfacial charged defect profiles change with various dopants in ZrO2 and examine their effect on the corrosion dynamics of zirconium alloys. By self-consistently considering both bulk defect chemistry and the space charge effect, we show that donor-type dopants, as exemplified by Nb, increases oxygen diffusivities while limiting hydrogen incorporation, leading to a trade-off between the oxidation rate and the hydrogen pickup fraction for passive layer growth. This framework allows for thermodynamic modeling of the oxide/water interface with varying defect chemistry and water chemistry and is useful for discovering engineering strategies of electrochemical interfaces.
Conflicts of interest
There are no conflicts to declare.
Acknowledgements
This work was supported by the Consortium for Advanced Simulation of Light Water Reactors (CASL), an Energy Innovation Hub for Modeling and Simulation of Nuclear Reactors under U.S. Department of Energy Contract No. DE-AC05-00OR22725. We acknowledge the Extreme Science and Engineering Discovery Environment (XSEDE) program for calculations performed under allocation No. TG-DMR120025.
References
-
J. Maier, Physical chemistry of ionic materials: ions and electrons in solids, John Wiley & Sons, 2004 Search PubMed.
- S. Kim, J. Fleig and J. Maier, Space charge conduction: Simple analytical solutions for ionic and mixed conductors and application to nanocrystalline ceria, Phys. Chem. Chem. Phys., 2003, 5, 2268–2273 RSC.
- F. Baiutti, G. Logvenov, G. Gregori, G. Cristiani, Y. Wang, W. Sigle, P. A. van Aken and J. Maier, High-temperature superconductivity in space-charge regions of lanthanum cuprate induced by two-dimensional doping, Nat. Commun., 2015, 6, 8586 CrossRef CAS PubMed.
- K. K. Adepalli, J. Yang, J. Maier, H. L. Tuller and B. Yildiz, Tunable oxygen diffusion and electronic conduction in SrTiO3 by dislocation-induced space charge fields, Adv. Funct. Mater., 2017, 27, 1700243 CrossRef.
- C.-C. Chen and J. Maier, Decoupling electron and ion storage and the path from interfacial storage to artificial electrodes, Nat. Energy, 2018, 3, 102–108 CrossRef CAS.
- A. Y. Borisevich, A. R. Lupini, J. He, E. A. Eliseev, A. N. Morozovska, G. S. Svechnikov, P. Yu, Y.-H. Chu, R. Ramesh, S. T. Pantelides, S. V. Kalinin and S. J. Pennycook, Interface dipole between two metallic oxides caused by localized oxygen vacancies, Phys. Rev. B: Condens. Matter Mater. Phys., 2012, 86, 140102(R) CrossRef.
- S. V. Kalinin and N. A. Spaldin, Functional ion defects in transition metal oxides, Science, 2013, 341, 858–859 CrossRef CAS PubMed.
- M. W. Swift, J. W. Swift and Y. Qi, Modeling the electrical double layer at solid-state electrochemical interfaces, Nat. Comput. Sci., 2021, 1, 212–220 CrossRef.
- J. Huang, B. G. Sumpter and V. Meunier, A universal model for nanoporous carbon supercapacitors applicable to diverse pore regimes, carbon materials, and electrolytes, Chemistry, 2008, 14, 6614–6626 CrossRef CAS PubMed.
- H. Wang and L. Pilon, Accurate simulations of electric double layer capacitance of ultramicroelectrodes, J. Phys. Chem. C, 2011, 115, 16711–16719 CrossRef CAS.
- L. Xing, J. Vatamanu, G. D. Smith and D. Bedrov, Nanopatterning of electrode surfaces as a potential route to improve the energy density of electric double-layer capacitors: Insight from molecular simulations, J. Phys. Chem. Lett., 2012, 3, 1124–1129 CrossRef CAS PubMed.
- G. S. Karlberg, J. Rossmeisl and J. K. Norskov, Estimations of electric field effects on the oxygen reduction reaction based on the density functional theory, Phys. Chem. Chem. Phys., 2007, 9, 5158–5161 RSC.
- E. M. Stuve, Ionization of water in interfacial electric fields: An electrochemical view, Chem. Phys. Lett., 2012, 519–520, 1–17 CrossRef CAS.
- Y. Kuan-Yu and M. J. Janik, Density functional theory-based electrochemical models for the oxygen reduction reaction: Comparison of modeling approaches for electric field and solvent effects, J. Comput. Chem., 2011, 32, 3399–3408 CrossRef PubMed.
- F. Calle-Vallejo and M. T. M. Koper, First-principles computational electrochemistry: Achievements and challenges, Electrochim. Acta, 2012, 84, 3–11 CrossRef CAS.
- F. Ambrosio, G. Miceli and A. Pasquarello, Structural, dynamical, and electronic properties of liquid water: A hybrid functional study, J. Phys. Chem. B, 2016, 120, 7456–7470 CrossRef CAS PubMed.
- T. S. Hofer and P. H. Hünenberger, Absolute proton hydration free energy, surface potential of water, and redox potential of the hydrogen electrode from first principles: QM/MM MD free-energy simulations of sodium and potassium hydration, J. Chem. Phys., 2018, 148, 222814 CrossRef PubMed.
- J. Cheng and M. Sprik, Alignment of electronic energy levels at electrochemical interfaces, Phys. Chem. Chem. Phys., 2012, 14, 11245–11267 RSC.
- J. Rossmeisl, K. Chan, R. Ahmed, V. Tripkovic and M. E. Bjorketun, pH in atomic scale simulations of electrochemical interfaces, Phys. Chem. Chem. Phys., 2013, 15, 10321–10325 RSC.
- M. H. Hansen and J. Rossmeisl, pH in Grand Canonical Statistics of an Electrochemical Interface, J. Phys. Chem. C, 2016, 120, 29135–29143 CrossRef CAS.
- X. Rong and A. M. Kolpak,
Ab Initio approach for prediction of oxide surface structure, stoichiometry, and electrocatalytic activity in aqueous solution, J. Phys. Chem. Lett., 2015, 6, 1785–1789 CrossRef CAS PubMed.
- M. Todorova and J. Neugebauer, Extending the concept of defect chemistry from semiconductor physics to electrochemistry, Phys. Rev. Appl., 2014, 1, 014001 CrossRef CAS.
- H. Liang-Feng and M. R. James, Electrochemical phase diagrams of Ni from ab initio simulations: role of exchange interactions on accuracy, J. Phys.: Condens. Matter, 2017, 29, 475501 CrossRef PubMed.
- L. F. Huang, M. J. Hutchison, R. J. Santucci, J. R. Scully and J. M. Rondinelli, Improved electrochemical phase diagrams from theory and experiment: The Ni–water system and its complex compounds, J. Phys. Chem. C, 2017, 121, 9782–9789 CrossRef CAS.
- F. Ambrosio, J. Wiktor and A. Pasquarello, pH-Dependent surface chemistry from first principles: Application to the BiVO4(010)–water interface, ACS Appl. Mater. Interfaces, 2018, 10, 10011–10021 CrossRef CAS PubMed.
- J. Yang, M. Youssef and B. Yildiz, Predicting point defect equilibria across oxide hetero-interfaces: model system of ZrO2/Cr2O3, Phys. Chem. Chem. Phys., 2017, 19, 3869–3883 RSC.
- J. Stahlberg, The Gouy—Chapman theory in combination with a modified Langmuir isotherm as a theoretical model for ion-pair chromatography, J. Chromatogr. A, 1986, 356, 231–245 CrossRef.
- F. Williams, S. P. Varma and S. Hillenius, Liquid water as a lone-pair amorphous semiconductor, J. Chem. Phys., 1976, 64, 1549–1554 CrossRef CAS.
- B. Cox, Some thoughts on the mechanisms of in-reactor corrosion of zirconium alloys, J. Nucl. Mater., 2005, 336, 331–368 CrossRef CAS.
- J. Chevalier, What future for zirconia as a biomaterial?, Biomaterials, 2006, 27, 535–543 CrossRef CAS PubMed.
- G. Kresse and J. Hafner,
Ab initio molecular dynamics for liquid metals, Phys. Rev. B: Condens. Matter Mater. Phys., 1993, 47, 558–561 CrossRef CAS PubMed.
- G. Kresse and J. Hafner,
Ab initio molecular-dynamics simulation of the liquid-metal-amorphous-semiconductor transition in germanium, Phys. Rev. B: Condens. Matter Mater. Phys., 1994, 49, 14251–14269 CrossRef CAS PubMed.
- G. Kresse and J. Furthmüller, Efficiency of ab-initio total energy calculations for metals and semiconductors using a plane-wave basis set, Comput. Mater. Sci., 1996, 6, 15–50 CrossRef CAS.
- G. Kresse and J. Furthmüller, Efficient iterative schemes for ab initio total-energy calculations using a plane-wave basis set, Phys. Rev. B: Condens. Matter Mater. Phys., 1996, 54, 11169–11186 CrossRef CAS PubMed.
- J. P. Perdew, K. Burke and M. Ernzerhof, Generalized gradient approximation made simple, Phys. Rev. Lett., 1996, 77, 3865–3868 CrossRef CAS PubMed.
- J. P. Perdew, K. Burke and M. Ernzerhof, Generalized gradient approximation made simple, Phys. Rev. Lett., 1997, 78, 1396 CrossRef CAS.
- M. Youssef, M. Yang and B. Yildiz, Doping in the valley of hydrogen solubility: A route to designing hydrogen-resistant zirconium alloys, Phys. Rev. Appl., 2016, 5, 014008 CrossRef.
- M. Youssef and B. Yildiz, Intrinsic point-defect equilibria in tetragonal ZrO2: Density functional theory analysis with finite-temperature effects, Phys. Rev. B: Condens. Matter Mater. Phys., 2012, 86, 144109 CrossRef.
- M. Youssef and B. Yildiz, Predicting self-diffusion in metal oxides from first principles: The case of oxygen in tetragonal ZrO2, Phys. Rev. B: Condens. Matter Mater. Phys., 2014, 89 Search PubMed.
- J. Yang, M. Youssef and B. Yildiz, Oxygen self-diffusion mechanisms in monoclinic ZrO2 revealed and quantified by density functional theory, random walk analysis, and kinetic Monte Carlo calculations, Phys. Rev. B, 2018, 97, 024114 CrossRef.
- C. Freysoldt, B. Grabowski, T. Hickel, J. Neugebauer, G. Kresse, A. Janotti and C. G. Van de Walle, First-principles calculations for point defects in solids, Rev. Mod. Phys., 2014, 86, 253–305 CrossRef.
- G. Makov and M. C. Payne, Periodic boundary conditions in ab initio calculations, Phys. Rev. B: Condens. Matter Mater. Phys., 1995, 51, 4014–4022 CrossRef CAS PubMed.
- P. J. Linstrom, Mallard, W. G., The NIST Chemistry WebBook:
![[thin space (1/6-em)]](https://www.rsc.org/images/entities/char_2009.gif) A Chemical Data Resource on the Internet, J. Chem. Eng. Data, 2001, 46, 1059–1063 CrossRef CAS.
A Chemical Data Resource on the Internet, J. Chem. Eng. Data, 2001, 46, 1059–1063 CrossRef CAS.
- S. Kasamatsu, T. Tada and S. Watanabe, Theoretical analysis of space charge layer formation at metal/ionic conductor interfaces, Solid State Ionics, 2011, 183, 20–25 CrossRef CAS.
- A. Bernas, C. Ferradini and J.-P. Jay-Gerin, On the electronic structure of liquid water: Facts and reflections, Chem. Phys., 1997, 222, 151–160 CrossRef CAS.
- J. Cheng and M. Sprik, Alignment of electronic energy levels at electrochemical interfaces, Phys. Chem. Chem. Phys., 2012, 14, 11245–11267 RSC.
- C. G. Van de Walle and J. Neugebauer, Universal alignment of hydrogen levels in semiconductors, insulators and solutions, Nature, 2003, 423, 626–628 CrossRef CAS PubMed.
- J. V. Coe, Fundamental properties of bulk water from cluster ion data, Int. Rev. Phys. Chem., 2001, 20, 33–58 Search PubMed.
-
W. M. Haynes, CRC handbook of chemistry and physics, CRC press, 2014 Search PubMed.
- J. Yang, M. Youssef and B. Yildiz, Structure, Kinetics, and Thermodynamics of Water and Its Ions at the Interface with Monoclinic ZrO2 Resolved via Ab Initio Molecular Dynamics, J. Phys. Chem. C, 2021, 125, 15233–15242 CrossRef CAS.
- K. Schwarz and R. Sundararaman, The electrochemical interface in first-principles calculations, Surf. Sci. Rep., 2020, 75, 100492 CrossRef CAS PubMed.
- D. Vanderbilt, X. Zhao and D. Ceresoli, Structural and dielectric properties of crystalline and amorphous ZrO2, Thin Solid Films, 2005, 486, 125–128 CrossRef CAS.
- C. Malmberg and A. Maryott, Dielectric constant of water from 0 to 100 °C, J. Res. Natl. Bur. Stand., 1956, 56, 1–8 CrossRef CAS.
- A. T. Motta, A. Couet and R. J. Comstock, Corrosion of zirconium alloys used for nuclear fuel cladding, Annu. Rev. Mater. Res., 2015, 45, 311–343 CrossRef CAS.
- A. Couet, A. T. Motta and R. J. Comstock, Hydrogen pickup measurements in zirconium alloys: Relation to oxidation kinetics, J. Nucl. Mater., 2014, 451, 1–13 CrossRef CAS.
- T. Kobayashi, T. Sasaki, I. Takagi and H. Moriyama, Solubility of zirconium(IV) hydrous oxides, J. Nucl. Sci. Technol., 2007, 44, 90–94 CrossRef CAS.
- S. Muhammad, S. Hussain, M. Waseem, A. Naeem, J. Hussain and M. T. Jan, Surface charge properties of zirconium dioxide, Iran. J. Sci. Technol., 2012, 36, 481 CAS.
- Y.-P. Zeng, A. Zimmermann, F. Aldinger and D. Jiang, Effect of organic additives on the zeta potential of PLZST and rheological properties of PLZST slurries, J. Eur. Ceram. Soc., 2008, 28, 2597–2604 CrossRef CAS.
- R. G. de Kretser and P. J. Scales, The effect of temperature on the yield stress of mineral suspensions, J. Colloid Interface Sci., 2008, 328, 187–193 CrossRef CAS.
- S. Ardizzone and C. L. Bianchi, Electrochemical features of zirconia polymorphs. The interplay between structure and surface OH species, J. Electroanal. Chem., 1999, 465, 136–141 CrossRef CAS.
- W. J. Bowman, J. Yang and B. Yildiz, The role of doping and microstructure on hydrogen solubility in monoclinic ZrO2: Experimental validations of simulated defect chemistry, Acta Mater., 2020, 195, 172–183 CrossRef CAS.
-
Y. Broy; F. Garzarolli; A. Seibold and L. Van Swam, Influence of transition elements Fe, Cr, and V on long-time corrosion in PWRs, Zirconium in the Nuclear Industry: Twelfth International Symposium, ASTM International, 2000 Search PubMed.
-
K. Takeda and H. Anada, Mechanism of corrosion rate degradation due to tin, Zirconium in the Nuclear Industry: Twelfth International Symposium, ASTM International, 2000 Search PubMed.
|
| This journal is © the Owner Societies 2023 |
Click here to see how this site uses Cookies. View our privacy policy here. 
 Open Access Article
 This Open Access Article is licensed under a Creative Commons Attribution-Non Commercial 3.0 Unported Licence
 a,
Mostafa
Youssef
a,
Mostafa
Youssef

 is the energy of oxygen molecule calculated by DFT. Eover is the correction term for oxygen overbinding created by semilocal functionals. With the parameters used in this work, Eover equals 1.12 eV.
  represents the tabulated chemical potential of oxygen gas at a reference pressure P0 = 0.1 MPa and a reference T = 0 K.37kB is the Boltzmann constant. With μO defined, μZr and μH can be defined as follows.

 and
and  represent the DFT calculated energy for one unit formula of ZrO2 in the solid monoclinic phase and one water molecule in the gas phase, respectively.
  is the reference free energy of liquid water from the NIST standard reference database.43 Since the free energy change of crystalline solids with temperature and pressure is negligible, μZr is approximated by the 0 K DFT energy without any finite temperature contribution. In other words,
  is taken as 0. For doped ZrO2, the dopant element M is included as a fourth element. Here we consider that the dopant could either form an interstitial defect Mi or a substitutional defect MZr. We use a fixed concentration scheme for treating extrinsic doping, where μM is tuned to satisfy the desired doping level given the chemical potential of all other elements.


 is the standard Gibbs free energy of formation at temperature T, which is well-tabulated for common ion species.49 We should notice that the numerical values of μi are different in water and in solid. Because we are dealing with DFT-calculated values for defect formation energies previously, μi is referenced to 0 K conditions. In eqn (9), μi is referenced to standard conditions (T = 298.15 K, pO2 = 1 bar). A detailed formalism of how μH and μO are calculated with varying potentials and pH values can be found in ref. 22. In this paper, we use the oxygen-rich condition as in ref. 22 where the chemical potential of oxygen atom is calculated from oxygen molecules. In other words, μO = 0 (T = 298.15 K, pO2 = 1 bar). Under this condition, the Fermi level of water lies at −5.5 eV with respect to the vacuum level at pH = 7. The corresponding μH is calculated by μH = [G°(H2O) −μO]/2. A detailed comparison between oxygen-rich and hydrogen-rich conditions can be found in the ESI,† Section S1.


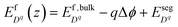
 is the bulk defect formation energy as defined by eqn (1) and
  is the Gibbs free energy of ion species as defined in eqn (9). Δϕ = ϕ(z) −ϕbulk is the electrostatic potential difference between the bulk and location z.
  and
and  represent the segregation energy of defect species to the core layer and the adsorption energy of ion species in the Stern layer, respectively. In this work, we considered the adsorption free energy only for H+ and OH− ions, which are the two dominating ion species in the related chemical environment. The adsorption free energies are 0.20 eV for H+ and 0.15 eV for OH− as found in our ab initio molecular dynamics (AIMD) study of the ZrO2(
 and
and  is closely connected to the electrochemical potential of charged defects,1,51 which should be constant throughout the system when equilibrium is reached. This connection has been discussed in detail in the ESI,† Section S3 of our previous work.26


 and
and  . All other types of native defects have very low concentrations in the intrinsic, undoped ZrO2. In the Stern layer, the built-up effect is more significant given the higher adsorption energy of H+ compared to OH−. In this case of pH-neutral water, we observe an 8-order-of-magitude increase in the H+ concentration in the Stern layer compared to bulk water, which is consistent with previous AIMD observation, which also predicts significant H+ adsorption.50 The multi-scale model enables us to quantify the concentration of surface adsorbates and how they change with pH and solid defect chemistry.


 (3+ valence state). Under oxygen rich conditions at room temperature, chromium exists in ZrO2 in approximately equal concentration of Cr×Zr and
  , with a far lower contribution from Cr•Zr. Iron exists dominantly in the form of Fe×Zr, with less contribution from the 3+ valence state compared to chromium. In other words, despite that the dopant concentration is fixed to 10 ppm in bulk, Cr contributes more negatively charged doping species compared to Fe. This is reflected in both the length and the potential of the space charge layer profile. Because Cr contributes effectively more charged defect concentration, the space charge layer length is significantly shortened. The magnitude of space charge effect follows a monotonically decreasing trend going from Cr to Nb. Cr and Fe decrease the Fermi level of ZrO2 and therefore increases the Fermi level difference between ZrO2 and water. The converse is true for Nb where only about 0.2 eV built-up potential is found on the ZrO2 side.
 , which are representative of hydrogen and oxygen diffusion kinetics in ZrO2. Note that the concentration of oxygen vacancies under oxygen rich conditions is negligible, hence the focus is on oxygen interstitials. We observe a monotonic decrease in H•i and increase in
  going from acceptor dopants to donor dopants, which results from the corresponding increase in the Fermi level. A similar trend is observed for electrons and holes (Fig. 7(b)). Since the dominating electronic defect under this condition is always holes, 5+ dopants (Nb) contribute to decreasing electronic conductivity. Fig. 7(c) shows the total hydrogen solubility in bulk ZrO2 and local hydrogen solubility at the surface. In bulk we observe a valley shape curve as shown in our previous work.37 On the left branch of the valley the dominant charge compensation mechanism is
  with positively charged hydrogen defects, H•i and H5Zr•. On the right branch of the valley the dominant charge compensation mechanism is MZr with negatively charged hydrogen defects,
  and
and  . Due to the sign change of the dominant hydrogen defect species, the effect of the surface space charge layer on local hydrogen concentration is reversed. For Cr- and Fe-doped ZrO2, positively charged hydrogen defects are depleted in the space charge layer, leading to reduction in the surface hydrogen concentration. For Nb-doped ZrO2 the trend is reversed, and surface hydrogen concentration is increased. The H+ adsorption effect also follows a monotonic decreasing trend due to the decreasing magnitude of the built-up potential on the water side going from Cr to Nb (Fig. 7(d)). With varying dopant concentrations, these conclusions remain qualitatively unchanged. Results with a changing doping level can be found in the ESI,† Section S6.
 , (b) free electrons and holes, and (c) total concentration of hydrogen. (d) H+ and OH− in bulk water and at the interface. All calculations are carried out at pH = 7 and oxygen rich conditions. Dopant concentrations are fixed to 10 ppm in the bulk. Doping label Zr represents undoped ZrO2.