Cosolvent and crowding effects on the polymerization kinetics of actin
Christopher
Rosin
,
Paul Hendrik
Schummel
and
Roland
Winter
*
TU Dortmund University, Department of Chemistry and Chemical Biology, Physical Chemistry I - Biophysical Chemistry, D-44227 Dortmund, Germany. E-mail: roland.winter@tu-dortmund.de
First published on 7th November 2014
Abstract
We studied the effects of kosmotropic and chaotropic cosolvents, trimethylamine-N-oxide (TMAO) and urea, as well as crowding agents (dextran) on the polymerization reaction of actin. Time-lapse fluorescence intensity and anisotropy experiments were carried out to yield information about the kinetics of the polymerization process. To also quantitatively describe the effects, cosolvents and crowding impose on the underlying rate constants of the G-to-F-transformation, an integrative stochastic simulation model was applied. Drastic and diverse changes in the lag phase and association rates as well as the critical actin concentration were observed under different solvent conditions. The association rate constant is drastically increased by TMAO but decreased by urea. In mixtures of these osmolytes, TMAO counteracts not only the deleterious effect of urea on protein structure and stability, but also on the protein–protein interactions in the course of actin polymerization. Owing to the excluded volume effect, cell-like macromolecular crowding conditions increase the nucleation and association rates by one order of magnitude. Our results clearly reveal the pronounced sensitivity of the actin polymerization reaction to changes in cosolvent conditions and the presence of macromolecular crowding, and suggest that such effects should be taken into account in any discussion of the actin polymerization reaction in vivo.
Introduction
Actin is one of the most abundant proteins in nearly all eukaryotic cells, and responsible for many substantial cellular functions such as muscle contraction, endocytosis, cytokinesis, cell locomotion, organelle transport or generation of force.1 Actin can be found in two main states in vivo: the monomeric state G-actin (G for globular), and the polymeric state F-actin (F for filamentous). G-actin is able to spontaneously polymerize into the filamentous state by the addition of cations.2,3 The first step of the polymerization reaction is the formation of elongation-competent nuclei, which serve as seeds for the following elongation phase of the reaction. The actin filaments are extended by the addition of G-actin at both ends of the filament, which exhibit a polarity described by faster or slower association rates.1,4 At both filament ends, G-actin can associate in its ATP-, ADP + Pi- or ADP-bound form, which possesses different association and dissociation kinetics.5,6 An important parameter is the so-called critical concentration, cc, which is the concentration of free G-actin in solution where association with and dissociation from a filament end are equal, resulting in no net growth. Owing to the different association–dissociation rates at the two filament ends, they exhibit differing critical concentrations.7 After the elongation phase of the polymerization reaction a steady state phase is observed, which is characterized by no further net extension of the filaments.The stability of proteins in aqueous solutions and hence also their interactions and reactions are altered by the addition of cosolvents which are abundant in the biological cell. Chemical compounds such as carbohydrates, polyols, amino acids or methylamines are known to stabilize the folded state of proteins and therefore are also often designated as chemical chaperones, whereas those that favor the unfolded state are known as denaturants.8–15 It was also found that some cosolvents, such as trimethylamine-N-oxide (TMAO), shift equilibria towards the oligomeric state of proteins, whereas urea perturbs such reactions.12 We used both types of cosolvents in this study to reveal their effect on the polymerization reaction of actin.
A distinctive property of the biological cell is that its chemical processes proceed in a medium containing high concentrations of macromolecules, occupying up to about 30% of the total volume.13 Hence, next to cosolvents, also macromolecular crowding is expected to lead to changes in protein stability and is able to shift conformational and association equilibria.16–19 Crowding studies aim to simulate the high interior concentration of various macromolecules present within the biological cell, whose volume is occupied by proteins and other biopolymers to an extent of about 20–30%.13,14 Generally, crowding leads to entropic effects of excluded volume. However, additional factors, such as increased viscosity, reduced diffusion constants and non-specific (“soft”) enthalpic interactions, have been shown to significantly influence the properties of biomolecules in their physiological environment as well.15–17 Here we use the polymeric crowder dextran (average molecular mass of 70 kDa), which is relatively inert, highly water soluble, and exhibits network-like structures at high concentrations. Such crowding agents have been shown to affect association reactions as well.18–21 Despite this fact, most publications dealing with the kinetics of association–dissociation reactions of biomolecular systems have been performed in dilute aqueous solutions, only.
In this study we set out to study the combined effects of different types of cosolvents (TMAO, urea) and crowding agents (dextran solutions of different concentration) on the polymerization reaction of actin. To this end, we performed time-lapse fluorescence intensity and anisotropy experiments to yield information about the kinetics (nucleation and growth process) of the assembled species. To be able to also quantitatively describe the effects of cosolvents and crowding on the underlying rate constants of the complex G-to-F-transformation, an integrative stochastic simulation model was applied.
Experimental section
Chemicals
Pyrene labeled (10%) and unlabeled rabbit skeletal muscle α-actin were purchased from HYPERMOL (Bielefeld, Germany). TMAO and urea were obtained from Sigma-Aldrich (Seelze, Germany) and dextran was purchased from Carl Roth (Karlsruhe, Germany). Before the experiments, G-actin was dialyzed against G-buffer containing 2 mM Tris-Cl pH 8.2, 0.4 mM ATP, 0.5 mM DTT, 0.1 mM CaCl2, and subsequently centrifuged at 100![[thin space (1/6-em)]](https://www.rsc.org/images/entities/char_2009.gif) 000g and 4 °C for 3 hours in order to remove aggregates. The protein concentration of the supernatant was determined by the biuret method.
000g and 4 °C for 3 hours in order to remove aggregates. The protein concentration of the supernatant was determined by the biuret method.
Pyrene assay and fluorescence anisotropy measurements
A solution of 5 μM Ca-G-actin was incubated in G-buffer containing the appropriate amount of cosolvent or crowding agent. After initiation of the polymerization reaction by adding F-buffer (10 mM imidazole pH 7.4, 100 mM KCl, 1 mM ATP) to the solution, the fluorescence intensity was measured every 20 s in a TECAN M200 multiplate reader at 25 °C. To follow the polymerization process, changes in pyrene fluorescence intensity were detected (λex = 365 nm, λem = 405 nm) as described before.22 For the fluorescence anisotropy measurements, pyrene fluorescence was excited at 365 nm and the emission signal was detected at 412 nm in a PerkinElmer LS 55 fluorescence spectrometer at 25 °C.Determination of the critical concentration of actin in different cosolvents
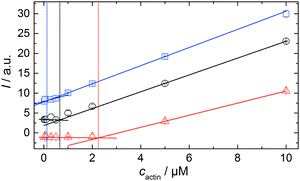
In order to be able to compare the influence of cosolvents on the critical concentration of actin, cc, we polymerized 15 μM pyrene-labeled actin in F-buffer and in F-buffer containing 1 M TMAO or 1 M urea, respectively. The G-to-F-transformation was followed spectroscopically (see Experimental section: Pyrene assay) until the polymerization was completed. Subsequently, the sample was diluted to the following concentrations of actin with the appropriate buffers (containing no cosolvent or the appropriate amount of TMAO or urea) to: 10, 5, 2, 0.5, 0.3, 0.1, 0.05, and 0.02 μM actin. The fluorescence intensities of each sample were recorded in a TECAN M200 multiplate reader (λex = 365 nm, λem = 405 nm) over time until no changes in fluorescence intensities were observable, i.e., until the polymerisation–depolymerisation equilibrium was reached. From the plots of fluorescence intensity vs. actin concentration, the critical actin concentration in the present buffer or cosolvent solution could be determined.Simulation of the polymerization processes of actin
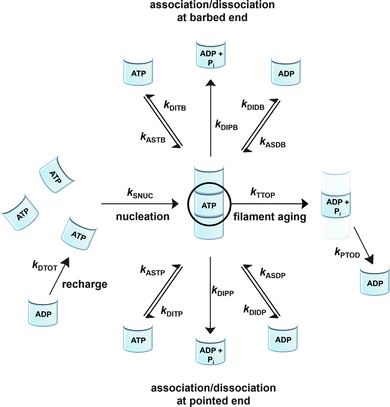
To be able to yield a quantitative description of the kinetic constants we used two approaches: in a first step, the experimental data were fitted by an analytical model of the polymerization reaction of actin using ActinPyreneFit,23 yielding the apparent reaction rates for the association and dissociation processes at the filament ends and the reaction rate of the nucleation process. In a second step, in order to identify which step of the polymerization reaction is mostly affected by cosolvents and crowding agents, we used the integrative simulation model ActinSimChem,23 which is a free software package based on an advanced Monte Carlo simulation model. The generated stochastic simulation modelling schemes were validated using sets of published kinetic data obtained by pyrene-actin experiments.23 The model integrates the major actin-related reaction steps depicted in eqn (1) and (2) (assembly of actin nuclei, association–dissociation of monomers to/from barbed and/or pointed filament ends, ATP hydrolysis, and ADP–ATP exchange (see Fig. 1); for more detailed information see ref. 23):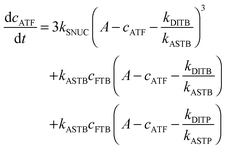 | (1) |
 | (2) |
Simulations were conducted using 5 μM ATP-bound G-actin (as was also used in the experiments), Gillespie's direct algorithm and the structurally-resolved filament model considering filament aging.24 To simulate our empirical data sets of the actin polymerization process, we started using already published rate constants which are depicted in Table 1. Only a very few of them needed to be slightly adjusted to fit our data. Fig. 2 shows the simulated curve using the adjusted rate constants together with the experimental data of the polymerization process of actin obtained by the pyrene assay.
| Rate constants | Values | Ref. | Adjusted values |
|---|---|---|---|
| k SNUC | 2.3 × 10⁻¹¹ μM−2 s−1 | 24 | 4.1 × 10⁻¹¹ μM−2 s−1 |
| k ASTB | 11.5 μM−2 s−1 | 5 | 11 μM−2 s−1 |
| k ASDB | 3.8 μM−2 s−1 | 5 | 5 μM−2 s−1 |
| k ASTP | 1.3 μM−2 s−1 | 5 | Identical |
| k ASDP | 0.16 μM−2 s−1 | 5 | Identical |
| k DITB | 1.4 s−1 | 5 | Identical |
| k DIPB | 1.4 s−1 | 5 and 25 | Identical |
| k DIDB | 7.2 s−1 | 5 | Identical |
| k DITP | 0.8 s−1 | 5 | Identical |
| k DIPP | 0.8 s−1 | 5 and 25 | Identical |
| k DIDP | 0.27 s−1 | 5 | Identical |
| k TTOP | 0.3 s−1 | 26 and 27 | Identical |
| k PTOD | 2.6 × 10⁻³ s−1 | 27 and 28 | Identical |
| k DTOT | ∼20 s−1 | 29 | Identical |
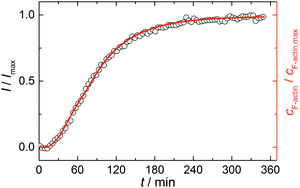 | ||
| Fig. 2 Experimental (normalized pyrene fluorescence intensity, I/Imax, open black circles) and simulated (red line) polymerization kinetics of 5 μM actin at 25 °C. Simulations were conducted using the reaction rates depicted in Table 1. | ||
As already shown, the polymerization reaction of actin exhibits a high sensitivity for only some of the rate constants used to describe the polymerization process;23kSNUC, kASTB, kASDB, kDIPB, kDIDB, and kDITB. These rate constants describe the nucleation process and the association–dissociation processes of actin monomers at the barbed end of the filament, respectively. They exhibit faster elongation rates compared to the pointed end, which is the reason why changes in rate constants of the pointed end do not have a large impact on the kinetics of the polymerization reaction.23 In order to identify the effect of cosolvents and crowding agents on the kinetics of the polymerization process, the rate constants were changed step-wise to simulate the experimental data obtained.
Results and discussion
The first step in actin polymerization is the association of monomers into small, thermodynamically unstable nuclei, characterized by a lag phase, which is followed by a phase, in which nuclei grow into long filaments, denoted the elongation phase. The elongation phase ends when the concentration of free actin monomers reaches the critical concentration, which is designated as the concentration at which the rate of the dissociation of monomers is equal to the rate of the addition of monomers to the filament (steady state phase). The polymerization process of 5 μM actin was followed using the increase of the fluorescence signal of covalently attached pyrene to Cys374 of the protein based on changes in the polarity of the microenvironment of the fluorophore during filament formation.30,31 This pyrene assay is a widely used method for monitoring the time course of actin polymerization and determining the underlying rate constants or the critical actin concentration.32 Polymerization of G-actin into filaments generally leads to a sigmoidal-type of reaction profile. In the following, we discuss the effects of cosolvents and crowded solutions on the G-to-F-transformation of actin and quantitatively analyse these results using stochastic-based simulations.TMAO accelerates the polymerization reaction of actin by influencing the nucleation step and the critical concentration of barbed ends
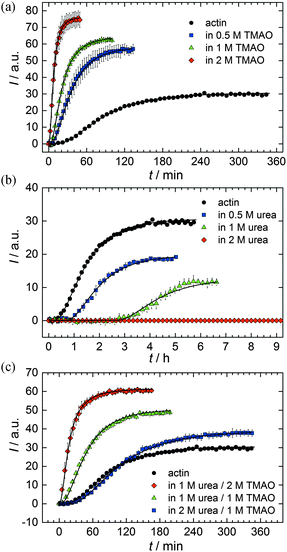
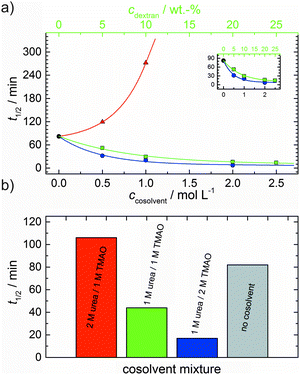
As shown in Fig. 2, the polymerization process of actin can be determined by recording changes in pyrene fluorescence while F-actin is formed. The half-life of the polymerization reaction, t1/2, determined by the inflection point of the sigmoidal curve, is about 82 min, when actin polymerizes after the addition of 100 mM KCl to the solution.TMAO is a natural osmolyte, in particular found in stressed organisms, which acts as a protein stabilizer and a “chemical chaperon”.9,33Fig. 3a exhibits the effect of this compatible solute on the polymerization reaction of actin. Adding 0.5, 1 or 2 M TMAO to actin solutions leads to a decreased lag phase of the polymerization reaction. In 2 M TMAO, no distinct nucleation phase can be observed anymore (Fig. 3a), and the slope of the elongation phase increases significantly. The half-lifes, t1/2, of the polymerization reaction of actin are dramatically reduced. Addition of 0.5 M TMAO results in a decrease of t1/2 to 50 min, in 1 M TMAO to ∼62 min, and in 2 M TMAO, t1/2 is reached ∼75 min earlier compared to the actin solution in the absence of TMAO (Fig. 3a and 8). Also the plateau values increase with increasing TMAO concentration, probably due to a higher amount or extended length of the actin filaments formed, indicating that the addition of TMAO has an impact on the critical concentration of the filament ends, which has been confirmed by determination of the critical concentrations, cc, as shown in Fig. 4. In the absence of TMAO, actin exhibits a cc value of ∼0.66 μM. When polymerized in 1 M TMAO, the critical concentration seems to decrease, cc ≈ 0.13 μM, due to an increased association rate, but due to the experimental error at these low actin concentrations, no exact value can be given.
In order to yield the nucleation rate constant of the polymerization process, the experimental data obtained by the pyrene assay were fitted by the analytical model. Fig. 5 shows how different concentrations of cosolvents and crowding agents influence the rate of the nucleation process. It can be clearly seen that addition of 0.5 M TMAO increases the nucleation rate by about one order of magnitude, from 4.1 × 10⁻¹¹ μM−2 s−1 (in the absence of cosolvents) to 4.6 × 10⁻¹⁰ μM−2 s−1. Addition of 1 M and 2 M TMAO leads to a further increase in the nucleation rate by one order of magnitude each, reaching kSNUC values of 6.24 × 10⁻⁹ μM−2 s−1 and 6.73 × 10⁻⁸ μM−2 s−1, respectively.
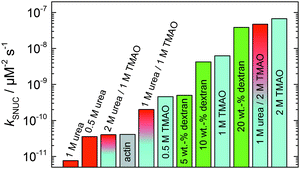 | ||
| Fig. 5 Nucleation rates, kSNUC, of the polymerization process of 5 μM actin at different concentrations of cosolvents and the crowding agent dextran at 25 °C. | ||
As can be seen from the simulation results depicted in Fig. 6a and b, an increase of the nucleation rate or a decrease of the critical concentration, due to an increase of kASTB of the barbed end, can account for the observed experimental findings, i.e., the drastic reduction in the lag phase and acceleration of the elongation rate.
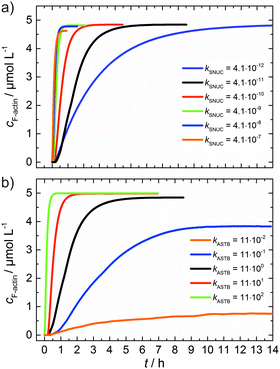 | ||
| Fig. 6 (a) Simulated polymerization kinetics of 5 μM actin with varying nucleation rate constants, kSNUC (in μM−2 s−1) over six orders of magnitude. All other reaction parameters were kept constant (see Table 1). The fitted curve, which describes the experimental data of the polymerization process at 25 °C is shown in black. (b) Simulated polymerization kinetics of 5 μM actin with varying association rate constant of the barbed end, kASTB (in μM−2 s−1) over five orders of magnitude. The nucleation rate (kSNUC) used was 4.1 × 10⁻¹¹ μM−2 s−1, all other reaction parameters were kept constant (see Table 1). The fitted curve of the experimental data of the polymerization reaction of 5 μM actin at 25 °C is shown in black. | ||
From eqn (2) it is evident that the nucleation rate constant (kSNUC) and the association–dissociation rates of the barbed end (kASTB, kDITB) are coupled to each other. Consequently, increasing the nucleation rate has also an impact on the growth rate of the barbed end, leading to the observed acceleration of the elongation rate and hence a decrease of t1/2 with an increasing amount of TMAO, as depicted in the simulated data shown in Fig. 6a. Increasing the association rate of the barbed end, or decreasing the critical actin concentration of the barbed ends, has a similar effect (Fig. 6b), based on the coupling of these parameters.
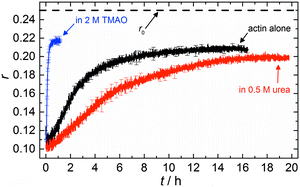
The accelerating effect of TMAO on the polymerization reaction was also confirmed by pyrene fluorescence anisotropy measurements (Fig. 7). Owing to its dependence on the rotational diffusion constant of the particle, the static fluorescence anisotropy, r, is a parameter that allows detection of size changes of the fluorescent particle, as
 | (3) |
The time dependent anisotropy measurements of the G-to-F-transformation also show the increase in the rate of the polymerization reaction upon addition of TMAO to the solution. Addition of 2 M TMAO leads to a shift of t1/2 by 104 min compared to the reaction profile in the absence of a cosolvent. In the case of 2 M TMAO, t1/2 is about 6 min, which is in very good agreement with our time-lapse fluorescence intensity data (t1/2 = 7 min). In the absence of cosolvents, the half-life of maximum polymerization is located at ∼110 min.
Assuming that the microviscosity is similar to that of bulk water (8.9 × 10⁻⁴ kg m−1 s−1), we can roughly estimate the anisotropy value, r. The intrinsic part of the anisotropy was determined for pyrenyl-labeled proteins and amounts to r0 = 0.25.34 The pyrenyl-group of actin exhibits two fluorescence lifetimes, τ1 = 24.5 ns (α1 = 0.76) and τ1 = 100.2 ns (α2 = 0.24),34 which are assumed to change not markedly during the G-to-F-transformation. The average lifetime for this two-exponential decay is given by34
 | (4) |
![[small tau, Greek, macron]](https://www.rsc.org/images/entities/i_char_e0d4.gif) = 67.2 ns. Assuming a spherical shape for the molecule, the hydrodynamic volume, Vh, of G-actin can be calculated using the Stokes–Einstein equation. With a diffusion coefficient of D = 7.03 × 10⁻¹¹ m2 s−1,35Vh amounts to 178 nm3, and r = 0.091, in good agreement with our experimental value of r = 0.111 ± 0.006, derived from measurements of the protein solution before KCl was added to induce the polymerization reaction. Owing to the highly polydisperse nature of actin species during the polymerization process, such analysis can be carried out for the monomeric actin, only.
= 67.2 ns. Assuming a spherical shape for the molecule, the hydrodynamic volume, Vh, of G-actin can be calculated using the Stokes–Einstein equation. With a diffusion coefficient of D = 7.03 × 10⁻¹¹ m2 s−1,35Vh amounts to 178 nm3, and r = 0.091, in good agreement with our experimental value of r = 0.111 ± 0.006, derived from measurements of the protein solution before KCl was added to induce the polymerization reaction. Owing to the highly polydisperse nature of actin species during the polymerization process, such analysis can be carried out for the monomeric actin, only.
In the absence of cosolvents, plateau values of the anisotropy are reached at r = 0.207 ± 0.001, and polymerization in the presence of 2 M TMAO yields a plateau value of 0.217 ± 0.001, indicating a significant increase in the average size of F-actin polymers upon addition of TMAO, in agreement with the fluorescence intensity data.
It is known that TMAO, owing to its strong interaction with water, is able to entropically stabilize oligomeric and polymeric protein structures by preferential exclusion from the protein interface (preferential hydration effect).36,37 Hence it is very likely that TMAO acts on the nucleation process of the polymerization reaction by shifting the monomer–oligomer equilibrium towards the oligomeric species (nuclei) by stabilizing them. This results in an accelerated nucleation step, which entails a decreased lag phase and an increased slope of the elongation phase of the polymerization reaction, and also acts on the level of the critical concentration by increasing the association rates at the filament ends, resulting in longer filaments, which would be in agreement with the fluorescence spectroscopy and anisotropy data.
Urea reduces the nucleation and association rates of the polymerization reaction of actin
To analyse the effect of urea as characteristic representative of a chaotropic agent on the kinetics of the G-to-F-transformation of actin, solutions containing 0.5, 1 and 2 M urea were prepared. The addition of urea leads to a dramatic increase of the lag phase and half-lifes of the polymerization process (Fig. 3b). In the case of 0.5 M urea, the half-life of the elongation process increases by 37 min and in solutions containing 1 M urea by 190 min (Fig. 3b and 8). In the case of 2 M urea, the polymerization process could not be observed anymore within the measured time range. We also note that with increasing concentration of urea the plateau value of the pyrene fluorescence intensity decreases drastically, indicating a decreased amount or length of actin filaments, which can also be interpreted by an increased critical concentration. Consistently, also the corresponding fluorescence anisotropy data reveal a retardation of the polymerization reaction (Fig. 7). The fluorescence anisotropy value in the plateau region, i.e. after complete polymerization, is r ≈ 0.199 ± 0.001, i.e., significantly lower compared to that in the absence of cosolvents. This again suggests that the amount and/or size of filaments formed is smaller in the presence of urea and the critical concentration, cc, is increased. This may be explained as the destabilizing effect urea generally imposes on protein structures, for example, by partial unfolding of the monomers. This suggestion could be confirmed by the determination of the cc of actin polymerized in a solution containing 1 M urea (Fig. 4). Compared to actin polymerized in pure buffer solution in the absence of urea, cc is increased significantly, from 0.66 μM to 2.25 μM in solutions containing 1 M urea.It is well known that urea, at high molar concentrations, is able to induce protein unfolding via breakage of intrabackbone hydrogen bonds.38 The generally accepted explanation for this effect is that urea is able to form H-bonds with the protein backbone and polar side chains of the protein, thereby leading to preferential interaction with the larger solvent-accessible surface area of the unfolded state of the protein.9 Here we show how such alteration of protein stability affects protein–protein interactions of the polymerizing actin. It can be rationalized that already moderate concentrations of urea (0.5–2 M) lead to partial unfolding of actin monomers before the polymerization reaction can proceed, thereby leading to the drastic increase in lag time of the polymerization process, which is reflected in the decrease of the nucleation rate of the polymerization process from 4.1 × 10⁻¹¹ μM−2 s−1 (no urea) to 3.56 × 10⁻¹¹ μM−2 s−1 (0.5 M urea) and 7.61 × 10⁻¹² μM−2 s−1 (1 M urea) according to our simulations (Fig. 5). In other words, the monomer–oligomer (nuclei) equilibrium shifts to the monomeric side with increasing urea concentration. This leads to an effective reduction of the active ATP-G-actin concentration, the prolongation of the lag phase (Fig. 3b), and an increased critical actin concentration, finally resulting in a lower amount of filaments formed.
TMAO counteracts the effect of urea
In order to explore the combined effect of a kosmotropic and chaotropic agent, TMAO and urea in our case, different concentrations and ratios of the cosolvents were measured as well. A counteracting effect of the two cosolvents can be clearly seen (Fig. 3c). When 1 M urea was added to 2 M TMAO solutions, the accelerating effect of TMAO is reduced compared to solutions containing only 2 M TMAO (Fig. 3a). Consistently, TMAO reduces the prolonged lag phase of the polymerization kinetics of actin in 1 M urea compared with the kinetics in 1 M urea (Fig. 3b and c). At a urea![[thin space (1/6-em)]](https://www.rsc.org/images/entities/char_2009.gif) :
:![[thin space (1/6-em)]](https://www.rsc.org/images/entities/char_2009.gif) TMAO ratio of 2
TMAO ratio of 2![[thin space (1/6-em)]](https://www.rsc.org/images/entities/char_2009.gif) :
:![[thin space (1/6-em)]](https://www.rsc.org/images/entities/char_2009.gif) 1 both the accelerating effect of TMAO and the retarding effect of urea on the polymerization reaction are almost completely ameliorated, leading to a similar shape of the polymerization curve and half-life of the reaction to actin in the absence of any cosolvent (Fig. 3c and 8b). This is also reflected in the effect of these osmolytes on the nucleation rates: while 0.5 M urea decreases the nucleation rate of the polymerization reaction only slightly, 0.5 M TMAO increases the nucleation rate by one order of magnitude (Fig. 5).
1 both the accelerating effect of TMAO and the retarding effect of urea on the polymerization reaction are almost completely ameliorated, leading to a similar shape of the polymerization curve and half-life of the reaction to actin in the absence of any cosolvent (Fig. 3c and 8b). This is also reflected in the effect of these osmolytes on the nucleation rates: while 0.5 M urea decreases the nucleation rate of the polymerization reaction only slightly, 0.5 M TMAO increases the nucleation rate by one order of magnitude (Fig. 5).
Macromolecular crowding accelerates the polymerization reaction of actin
With the objective of mimicking cell-like conditions, dextran was used to simulate crowded solutions that are encountered in vivo. The polymerization kinetics of solutions containing 5 μM actin was determined using dextran from 5 up to 25 wt%. As seen in Fig. 9, an increase in dextran concentration leads to a drastic acceleration of the G-to-F-transformation. Addition of 5 wt% dextran results in a decrease of the half-life of the polymerization reaction by 30 min (Fig. 8a, inset). At 20 wt%, representing cell-like conditions, t1/2 has decreased from 82 min in the absence of a crowder to 16 min, and also the value of the fluorescence plateau reached after complete polymerization is significantly higher compared to solutions without dextran (Fig. 9), indicating formation of more/longer filaments, and a reduced critical concentration due to an increase of the association rates of the filament ends.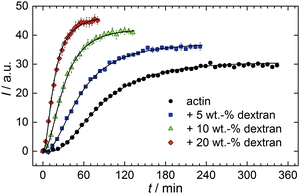 | ||
| Fig. 9 Pyrene fluorescence intensity data of 5 μM actin in solutions containing different concentrations of the crowding agent dextran (T = 25 °C). | ||
Both the lag phase and the elongation phase of the polymerization kinetics are influenced with increasing crowder concentration. Similar to the data of the compatible solute TMAO, the lag phase decreases and the slope of the elongation phase increases with increasing crowder concentration up to 25 wt%. Owing to the excluded volume effect, crowding agents like dextran are expected to foster assembly reactions, and hence also shift the monomer–oligomer (nuclei) equilibrium to the oligomeric side,39,40 in good agreement with our experimental findings. The crowding effect can be nicely elucidated when comparing the experimentally observed decrease in the lag phase and an increase in the slope of the elongation rate with our simulated data where the nucleation rate (kSNUC, Fig. 6a) and the association rate (kASTB, Fig. 6b) are varied. An increase in both rates by one order of magnitude results in a similar change in the simulated polymerization curves and can explain the acceleration of the polymerization process by 20 wt% dextran.
Summary and conclusions
Pyrene-labeled actin has been used as a probe to monitor the polymerization process of actin under different environmental conditions, based on the increase of the fluorescence intensity with the transition from the G- to the F-form. In addition, fluorescence anisotropy data have been recorded, which are sensitive to size changes of the polymerizing system.In response to stress (osmotic, chemical, temperature or pressure), living organisms are able to accumulate high concentrations of osmolytes, such as TMAO or urea. TMAO can enhance protein stability by attenuating the strength of H-bonds formed between protein polar groups and water.33 It is also known that TMAO, owing to its strong interaction with water, is able to entropically stabilize oligomeric and polymeric protein structures by preferential exclusion from the protein interface (preferential hydration effect). Hence it is very likely that TMAO acts on the nucleation process of the polymerization reaction by shifting the monomer–oligomer equilibrium towards the oligomeric species by stabilizing them, resulting in an accelerated nucleation step. The latter results in a decreased lag phase and a markedly increased slope of the elongation phase of the polymerization reaction, and also acts on the level of the critical concentration by increasing the association rates at the filament ends, resulting in formation of more or longer filaments.
Urea, also a natural osmolyte, unlike TMAO, shows preferential accumulation in the vicinity of protein backbones and sidechains.9,41–44 Urea's ability to destabilize and unfold proteins does not seem to arise from its effect on the structure of water, but is instead achieved through a more direct mechanism. Already moderate concentrations of urea (0.5–2 M) lead to the destabilization or partial unfolding of actin monomers (likewise, to a shift of the monomer–oligomer equilibrium to the monomeric side), thereby leading to the drastic increase in lag time of the polymerization process, which is reflected in the decrease of the nucleation rate of the polymerization process, e.g. from 4.1 × 10⁻¹¹ μM−2 s−1 (no urea) to 7.6 × 10⁻¹² μM−2 s−1 in 1 M urea. This leads to an effective reduction of the active ATP-G-actin concentration, the prolongation of the lag phase, and an increased critical actin concentration, resulting in a lower amount of filaments formed. It may also be envisaged that urea binds to regions at filament ends, which are crucial for extension and annealing.
In mixtures of urea and TMAO, TMAO is shown here to counteract not only the deleterious effect of urea on protein structure and stability, but also on the protein–protein interactions in the course of actin polymerization. This effect seems to be most effective when present in the 1![[thin space (1/6-em)]](https://www.rsc.org/images/entities/char_2009.gif) :
:![[thin space (1/6-em)]](https://www.rsc.org/images/entities/char_2009.gif) 2 TMAO
2 TMAO![[thin space (1/6-em)]](https://www.rsc.org/images/entities/char_2009.gif) :
:![[thin space (1/6-em)]](https://www.rsc.org/images/entities/char_2009.gif) urea molar ratio, at which the accelerating effect of TMAO and the retarding effect of urea on the polymerization reaction are almost completely ameliorated. This is also reflected in the effect of these osmolytes on the nucleation rates: while 0.5 M urea decreases the nucleation rate of the polymerization reaction only slightly, 0.5 M TMAO increases the nucleation rate by one order of magnitude (Fig. 5). Such an effect may be largely due to direct interactions of the two solutes in solution. Interestingly, contrary to its accelerating effect on the polymerization of actin monomers, TMAO has been shown to reduce the annealing rate of actin filaments.12
urea molar ratio, at which the accelerating effect of TMAO and the retarding effect of urea on the polymerization reaction are almost completely ameliorated. This is also reflected in the effect of these osmolytes on the nucleation rates: while 0.5 M urea decreases the nucleation rate of the polymerization reaction only slightly, 0.5 M TMAO increases the nucleation rate by one order of magnitude (Fig. 5). Such an effect may be largely due to direct interactions of the two solutes in solution. Interestingly, contrary to its accelerating effect on the polymerization of actin monomers, TMAO has been shown to reduce the annealing rate of actin filaments.12
As expected from the mere excluded volume effect, inert crowders like dextran are able to impose enhanced interactions, increased reaction rates, and shifts of equilibria to association. In fact, in the presence of 20 wt% dextran, representing cell-like conditions, t1/2 has decreased from 82 min in the absence of a crowder to 16 min, and also the value of the fluorescence plateau reached after complete polymerization is significantly higher compared to solutions without dextran, indicating formation of more/longer filaments, and a reduced critical concentration due to an increase of the association rates of the filaments ends. An increase of the nucleation and the association rate by one order of magnitude can account for such an effect.
To conclude, these experimental results together with the simulation data clearly reveal the pronounced sensitivity of protein association equilibria, such as actin polymerization, to changes in cosolvent concentration and the presence of spatial confinement such as in the case of macromolecular crowding. These effects should be taken into account in any discussion of polymerization reactions in the cellular context.
Acknowledgements
We acknowledge financial support from the Cluster of Excellence RESOLV (EXC 1069) funded by the Deutsche Forschungsgemeinschaft (DFG).Notes and references
- T. D. Pollard and J. A. Cooper, Science, 2009, 326, 1208–1212 CrossRef CAS PubMed.
- L. S. Tobacman and E. D. Korn, J. Biol. Chem., 1983, 258, 3207–3214 CAS.
- A. A. Lal, E. D. Korn and S. L. Brenner, J. Biol. Chem., 1984, 259, 8794–8800 CAS.
- H. Wang, R. C. Robinson and L. D. Burtnick, Cytoskeleton, 2010, 67, 456–465 CrossRef CAS PubMed.
- T. D. Pollard, J. Cell Biol., 1986, 103, 2747–2754 CrossRef CAS.
- I. Fujiwara, D. Vavylonis and T. D. Pollard, Proc. Natl. Acad. Sci. U. S. A., 2007, 104, 8827–8832 CrossRef PubMed.
- T. D. Pollard, Biophys. J., 1986, 49, 149–151 CrossRef CAS.
- S. N. Timasheff, Annu. Rev. Biophys. Biomol. Struct., 1993, 22, 67–97 CrossRef CAS PubMed.
- D. R. Canchi and A. E. García, Annu. Rev. Phys. Chem., 2013, 64, 273–293 CrossRef CAS PubMed.
- P. H. Yancey, M. E. Clark, S. C. Hand, R. D. Bowlus and G. N. Somero, Science, 1982, 217, 1214–1222 CAS.
- D. W. Bolen and G. D. Rose, Annu. Rev. Biochem., 2008, 77, 339–362 CrossRef CAS PubMed.
- K. Hatori, T. Iwasaki and R. Wada, Biophys. Chem., 2014, 193–194, 20–26 CrossRef CAS PubMed.
- R. J. Ellis, Trends Biochem. Sci., 2001, 26, 597–604 CrossRef CAS.
- A. P. Minton, J. Biol. Chem., 2001, 276, 10577–10580 CrossRef CAS PubMed.
- S. R. McGuffee and A. H. Elcock, PLoS Comput. Biol., 2010, 6, e1000694 Search PubMed.
- M. Jiao, H.-T. Li, J. Chen, A. P. Minton and Y. Liang, Biophys. J., 2010, 99, 914–923 CrossRef CAS PubMed.
- Y. Phillip, M. Harel, R. Khait, S. Qin, H.-X. Zhou and G. Schreiber, Biophys. J., 2012, 103, 1011–1019 CrossRef CAS PubMed.
- R. A. Lindner and G. B. Ralston, Biophys. Chem., 1997, 66, 57–66 CrossRef CAS.
- D. Drenckhahn and T. D. Pollard, J. Biol. Chem., 1986, 261, 12754–12758 CAS.
- R. L. Tellam, M. J. Sculley, L. W. Nichol and P. R. Wills, Biochem. J., 1983, 213, 651–659 CAS.
- D. L. Sackett, Am. J. Physiol., 1997, 273, R669–R676 CAS.
- B. J. A. Cooper and T. D. Pollard, Methods Enzymol., 1982, 85, 182–210 Search PubMed.
- A. A. Halavatyi, P. V. Nazarov, S. Medves, M. Van Troys, C. Ampe, M. Yatskou, E. Friederich and M. van Troys, Biophys. Chem., 2009, 140, 24–34 CrossRef CAS PubMed.
- S. Samarin, S. Romero, C. Kocks, D. Didry, D. Pantaloni and M.-F. Carlier, J. Cell Biol., 2003, 163, 131–142 CrossRef CAS PubMed.
- J. Fass, C. Pak, J. Bamburg and A. Mogilner, J. Theor. Biol., 2009, 252, 173–183 CrossRef PubMed.
- L. Blanchoin and T. D. Pollard, Biochemistry, 2002, 41, 597–602 CrossRef CAS PubMed.
- J. R. Kuhn and T. D. Pollard, Biophys. J., 2005, 88, 1387–1402 CrossRef CAS PubMed.
- M. Bindschadler, E. A. Osborn, C. F. Dewey Jr. and J. L. McGrath, Biophys. J., 2004, 86, 2720–2739 CrossRef CAS.
- A. Mogilner and L. Edelstein-Keshet, Biophys. J., 2002, 83, 1237–1258 CrossRef CAS.
- G. Bains, A. B. Patel and V. Narayanaswami, Molecules, 2011, 16, 7909–7935 CrossRef CAS PubMed.
- T.-I. Lin and R. M. Dowben, Biophys. Chem., 1982, 15, 289–298 CrossRef CAS.
- J. A. Cooper, S. B. Walker and T. D. Pollard, J. Muscle Res. Cell Motil., 1983, 4, 253–262 CrossRef CAS.
- J. Ma, I. M. Pazos and F. Gai, Proc. Natl. Acad. Sci. U. S. A., 2014, 111, 8476–8481 CrossRef CAS PubMed.
- J. R. Lakowicz, Principles of Fluorescence Spectroscopy, Springer, 3rd edn, 2006 Search PubMed.
- F. Lanni and B. R. Ware, Biophys. J., 1984, 46, 97–110 CrossRef CAS.
- Q. Zou, B. J. Bennion, V. Daggett and K. P. Murphy, J. Am. Chem. Soc., 2002, 124, 1192–1202 CrossRef CAS PubMed.
- D.-S. Yang, C. M. Yip, T. H. J. Huang, A. Chakrabartty and P. E. Fraser, J. Biol. Chem., 1999, 274, 32970–32974 CrossRef CAS PubMed.
- W. Kauzmann, Adv. Protein Chem., 1959, 14, 1–63 CrossRef CAS.
- A. P. Minton, Biopolymers, 1981, 20, 2093–2120 CrossRef CAS.
- A. P. Minton, Mol. Cell. Biochem., 1983, 140, 119–140 CrossRef.
- B. Moeser and D. Horinek, J. Phys. Chem. B, 2014, 118, 107–114 CrossRef CAS PubMed.
- E. Schneck, D. Horinek and R. R. Netz, J. Phys. Chem. B, 2013, 117, 8310–8321 CrossRef CAS PubMed.
- J. Yoon, D. Thirumalai and C. Hyeon, J. Am. Chem. Soc., 2013, 135, 12112–12121 CrossRef CAS PubMed.
- S. S. Cho, G. Reddy, J. E. Straub and D. Thirumalai, J. Phys. Chem. B, 2011, 115, 13401–13407 CrossRef CAS PubMed.
| This journal is © the Owner Societies 2015 |

