Single vs. two-photon microscopy for label free intrinsic tissue studies in the UV light region
Vitalijs
Zubkovs†
a,
Frédéric
Jamme
a,
Slavka
Kascakova
bc,
Franck
Chiappini
bc,
François
Le Naour
bc and
Matthieu
Réfrégiers
*a
aDISCO Beamline, Synchrotron SOLEIL, F-91192 Gif sur Yvette, France. E-mail: matthieu.refregiers@synchrotron-soleil.fr; Fax: +33 1 69359456; Tel: +33 1 69359655
bInserm U785, F-94800 Villejuif, France
cUniv. Paris-Sud 11, UMR-S785, F-94800 Villejuif, France
First published on 21st March 2014
Abstract
Fibrillar distribution in the rat tail tendon and mice liver can be measured using optical methods. Two-photon excitation provides easy assessment of fibrotic collagen types I and II. Single photon deep ultraviolet (DUV) excitation imaging highlights all collagen types without discrimination. Their combination on the same tissue area provides a better overview of collagens in fibrillar diseases.
Introduction
Two-photon microscopy is a fast developing tool for cell biology and tissue diagnosis.1–4 Its efficiency for imaging tissues in depth has been demonstrated and well recognized.4 Due to its intrinsic non-linear nature it exhibits two types of signals, (i) second harmonic generated (SHG) diffusion that brings easy localization of the non-centrosymmetric structures present in biological materials with specific information concerning their orientation; and (ii) using near infrared excitation, it allows us to image the ultraviolet excited autofluorescence of biological samples,5,6 the so-called two-photon excitation fluorescence (TPEF). It is one of the possible methods to image label free biological samples with great selectivity. SHG imaging can be applied for visualization of collagen,7 which is a key component of load-bearing tissues (bones, tendons, etc.) and the most abundant protein in the human body (30% of proteins present in body mass1). Abnormalities in collagen development in several organs are often caused by progression of inflammatory diseases and can be used as a pathological signature. SHG microscopy can be used to grade fibrosis in biological tissues. It should be highlighted that only fibrillar collagen types might be detected by SHG microscopy. Therefore, globular collagen types do not give any SHG signal.1,3On the other hand, ultraviolet excitable autofluorescent compounds can be imaged using single photon ultraviolet (UV) light in cells and tissues.8,9 UV fluorescence microscopy in the deep ultraviolet (DUV) range (200–300 nm) is an excellent tool for non-destructive qualitative specimen analysis.
Two-Photon Excitation Fluorescence (TPEF) microscopy can also be applied for autofluorescence imaging of endogenous compounds. But this technique cannot compete with monophotonic microscopies due to the discreteness of the recorded spectrum, despite the same range lateral resolution.10
We describe for the first time the complementarities and synergies between ultraviolet single photon and two-photon excitation of autofluorescent compounds in tissues and compare the resolution and penetration depth of both modalities. The rat tail as a positive control and mice liver as an unknown sample were studied and the potential of the combination was explored.
Methods and materials
DUV synchrotron light imaging
The full field synchrotron DUV imaging set-up is built around a Zeiss Axio Observer (Carl Zeiss, France) inverted microscope constructed with quartz-only optics. The white beam of the DISCO beamline at Synchrotron SOLEIL11 is monochromatized using an iHR320 (Jobin-Yvon Horiba, Longjumeau, France) before coupling with the entrance of a modified Zeiss Axio Observer Z1 (Carl Zeiss, Germany); a monochromatic beam was chosen in order to determine the composition of collagen in biological tissues exciting close to the 290 nm maximum, tryptophan and tyrosine were excited with the same excitation wavelength. A sharp dichroic mirror transmitting only above 300 nm (Omega Optical, Brattleboro, Vermont) reflected the incident light that was further focused onto the sample through a Zeiss Ultrafluar 100× (N.A. 1.25, glycerine immersion).8 Emission was recorded with a PIXIS 1024-BUV (Princeton Instruments, USA) camera after passing through a series of bandpass filters (Semrock, Rochester, USA). Fluorescence images were typically recorded upon exposure for a few seconds (Table 1; DUV1 and DUV2). For bead's stack imaging, z scanning was performed with a PInano Z piezo slide scanner stage (PI, Germany). The whole system was controlled via μManager.12| Number | Excitation wavelength (nm) | Emission filter (nm) | Image acquisition time (s) | Targeted compounds | Co-excited compounds |
|---|---|---|---|---|---|
| DUV1 | 290 | 327–353 | 5 | Tryptophan | Tyrosine, pyridoxine, and collagen |
| DUV2 | 290 | 412–438 | 5 | Collagen | Elastin, NADH, and pyridoxine |
| IR1 | 810 | 399–414 | 32 | Collagen (SHG) | — |
| IR2 | 810 | 447–472 | 32 | NADH, FAD (TPEF) | — |
Two-photon imaging microscopy
The samples were analyzed with a Nikon A1MP+ confocal microscope (NIKON, France). A tuneable Maï Taï XF Ti:sapphire mode-locked laser (SPECTRA PHYSICS, France) excited the sample between 710 and 920 nm through a 40× water immersion objective (N.A. 1.25, water immersion). The reflected second harmonic generated signal was detected at half the excitation wavelength with ad-hoc filters in front of the NDD GaAsP detectors. Excitation wavelength, acquisition time, and filter sets were chosen in order to maximize the resolution and signal intensity in each channel (Table 1; rows IR1 to IR2).For SHG and DUV analyses, fresh liver samples were fixed in formaldehyde and dehydrated in alcohol with increasing concentration up to absolute alcohol and finally immersed in toluene. Thereafter, the tissue was embedded in liquid paraffin, solidified and sectioned at 10 and 20 μm with the microtome. Slices were mounted on quartz coverslips (thickness 0.17 mm) by addition of a drop of distilled water. In the standard sample preparation protocol, the human serum albumin was usually used. However, using the UV excitation the addition of human serum albumin can lead to a parasite signal. Therefore we excluded the albumin from the preparation protocol. The tissues were well preserved but several cracks were formed during the segmentation procedure.
Results and discussion
Comparing resolutions
The usual way to compare the resolution of microscopes is to use calibrated nanobeads with fluorescent probes excited in the energy range of interest. In our case, for ultraviolet excitation, the best compromise we found was to use the natural fluorescence of polystyrene beads of known size.As seen in Fig. 1, the observed bead size after classic maximum likelihood estimation deconvolution is very close to both setups. Indeed, the natural confocal excitation provided by TPEF is compensated by the very low (290 nm) excitation wavelength of widefield DUV fluorescence microscopy. Therefore, for all the following images, we can directly compare the information content of TPEF and DUV images.
 | ||
| Fig. 1 220 nm polystyrene beads fluorescence imaging showing the resolving power of each microscopy technique. (Left) 390 nm fluorescence after DUV excitation at 290 nm excitation. (Right) TPEF image at 376 nm after IR 710 nm excitation. Scale bars 0.5 μm. | ||
UV imaging of intrinsic tissues
The abundance of types I and II collagen in rat tail tendon is highlighted by SHG microscopy (Fig. 2, middle). In the tendon collagen architecture, two types of features can be highlighted: elongated, wave-like fibres and curved interwoven fibrils.14 The TPEF signal can be recorded simultaneously with the SHG signal using higher wavelength bandpass filter sets, however, compared to single photon DUV excited fluorescence, the TPEF excitation profile is less structured and selective.16 It represents NADH and FAD distributions (Table 1).
 | ||
| Fig. 2 Rat-tail tendon multimodal imaging: co-localized region of rat-tail tendon showing separate magnified collagen fibres. Collagen excitation at 290 nm in DUV, emission 412–438 nm (upper) and collagen fibres visualization using SHG microscopy (middle) and TPEF intrinsic fluorescence (447–472 nm) excited at 810 nm (bottom) images. Scale bars 25 μm. | ||
The same sample was transferred onto the DUV microscope for examination of collagen. In Fig. 2, similarities in organization of collagen bundles can be noticed between DUV fluorescence and SHG images. Separate collagen fibre bundles were well distinguishable, however, in cellular regions DUV fluorescence shows several other collagen fibre types which results in higher concentration (around 10% of all collagen types15 in rat tail tendon).
We observed collagen types I and II surrounding the central vein and also cells in DUV while in SHG only around the vein (Fig. 3). Ultraviolet excited fluorescence (either two-photon or single photon, yellow in Fig. 3) permits us also to visualize hematocytes that remained trapped inside the vein; only DUV microscopy shows the network of fibres surrounding those cells.
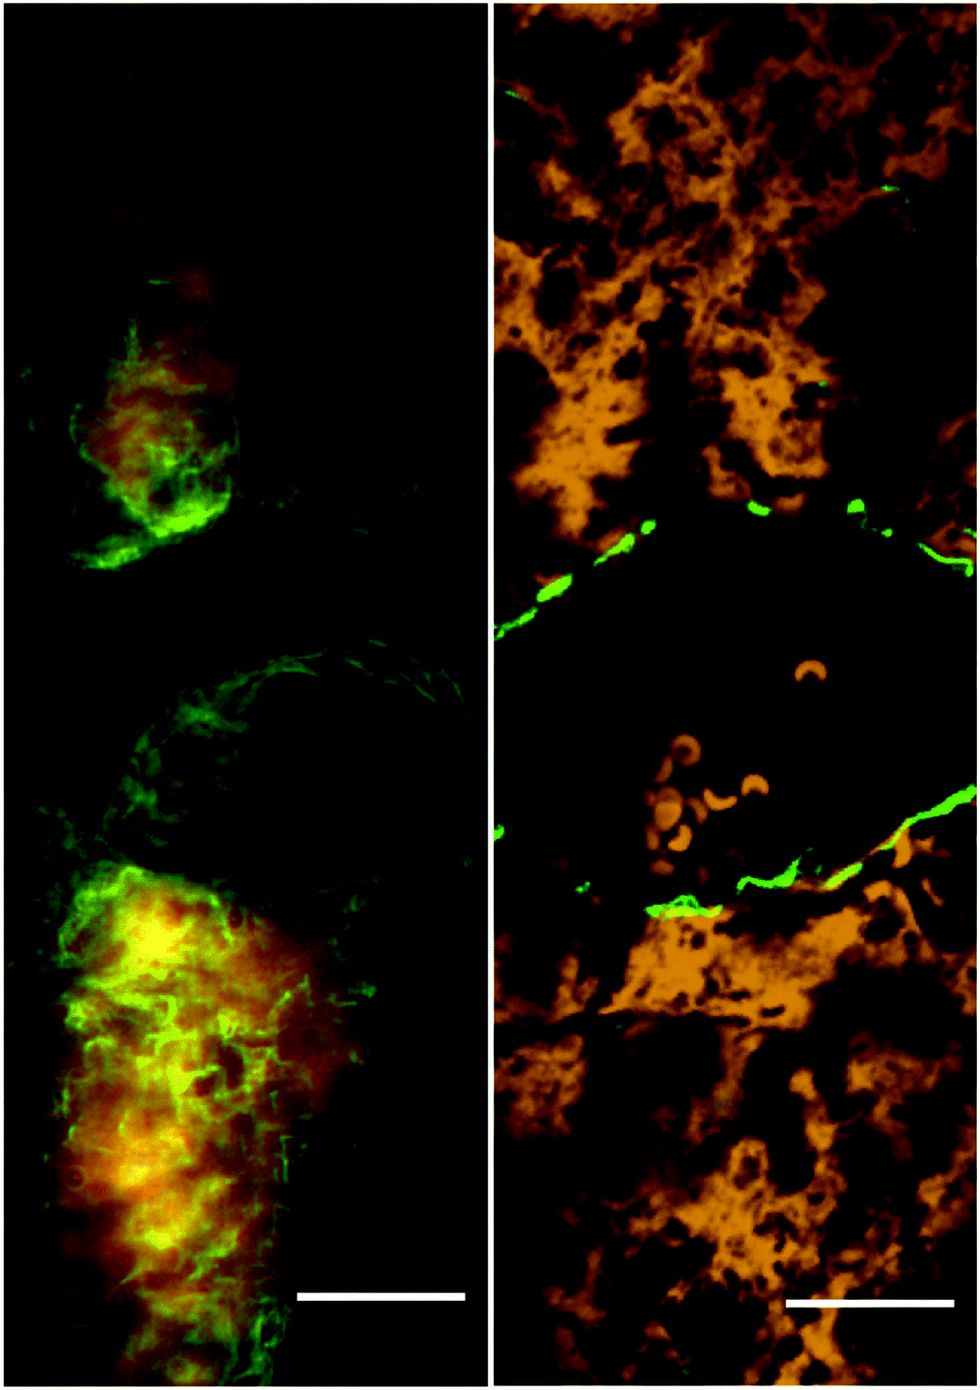 | ||
| Fig. 3 DUV fluorescence image (left), collagen is in green, amino acids in red and SHG image (green) merged with TPEF (yellow) (right) of healthy mice liver (excitation: 330 nm; emission: 412–438 nm; targeting regions of collagen localization). Scale bar 20 μm. | ||
DUV microscopy illustrates the distribution of endogenous compounds in the liver tissue. The filters have been chosen close to regions of fluorescence maxima of tryptophan, collagen and elastin. The bandpass filter at 327–353 nm (excitation at 290 nm) was used to visualize the tryptophan occurrence in the biological sample (Fig. 3). It reveals the protein distribution in the liver with different pathologies. The differences in signal intensities between the two channels (red filters at 327–353 nm and green at 412–438 nm) allow the detection of collagen abundance. Collagen type IV forms a structural basis of cell membranes. Because it is a globular protein, it can be imaged by DUV microscopy only, not by SHG.3 Therefore, the DUV fluorescence imaging provides in depth knowledge concerning the collagen repartition in tissues (Fig. 3).
Collagen fibres develop mostly in vascular regions. Collagen fibres have spring-like structures that are randomly oriented around the cell membranes. But close to veins or arteries, collagen fibres are co-directed around the tubular objects (Fig. 3).
Conclusions
Two-photon microscopy found a broad range of applications in biology, for example, multi-photon excitation imaging of neuron activity, cancer research studies of angiogenesis, metastasis and embryo development visualization.10 On the other hand, deep UV light (200–300 nm) and near UV light (300–400 nm) are used for excitation of many endogenous compounds, which are responsible for native tissue fluorescence. The endogenous fluorophores present in most biological tissues are: NADH coenzymes present in mitochondria, chloroplasts, peroxisomes, cytosol and are involved in cellular metabolism, present excitation maxima at 260 and 345 nm,9,17 aromatic autofluorescent amino acids: tryptophan (excitation maxima 220 and 277 nm), tyrosine (274 nm), phenylalanine (257 nm) compose many proteins. Furthermore, flavins, collagen, elastin, FAD and lipopigments are endogenous chromophores found in tissues under UV light excitation.9,18Development of new methods for liver pathological tests is on the forefront of many known research studies. SHG microscopy has high potential for characterization of fibrotic stages in liver and was confirmed by the Fibrosis-Metavir test.3 Moreover, it has been shown that collagen fibre detection in liver by non-linear microscopy provides better sensitivity compared to conventional staining methods.19 Combination of SHG and synchrotron light excitation autofluorescence microscopies for biological tissue analysis has not been reported in any other study. Therefore, this research work has significance not only as a tool for the characterization of pathological disorder, but it also demonstrates the compatibility of these techniques for analyzing the same sample. While SHG permits a fine localization and quantification of fibrillar collagen types I and II, DUV fluorescence microscopy images all collagen crosslinks without discrimination. While this loss in selectivity could be considered as a disadvantage, it may also be seen as an advantage because comparison between DUV and SHG images permits us to localize collagens of types other than I and II.
Due to the potential presented for liver tissue fibrillar characterization, the discussed microscopy methods could be applied to study pathological disorder caused by non-alcoholic fatty liver disease (NAFLD). These disorders are expressed through an unusual accumulation of lipid droplets in the liver of non-alcoholic patients.20 NAFLD is classified between simple steatosis (fatty liver) and non-alcoholic steatohepatitis (NASH). The histopathological spectrum of NAFLD extends from steatosis through NASH to advanced fibrosis, cirrhosis and hepatocellular carcinoma (HCC). While steatosis refers to lipid accumulation, the key factor that concurs to favour NASH is oxidative stress culminating with liver injury and inflammation.21 It has been shown that the simple hepatic steatosis confers a long-term prognosis. It is a reversible process, considered innocuous in its pure form. Indeed patients without evidence of NASH rarely progressed to cirrhosis,22,23 whereas the disease progression occurs in 43% of patients with NASH, and progression to cirrhosis may occur in 28% of these cases.23,24 In addition, HCC has long been described to arise on a cirrhotic liver. Recent data however show that some patients with NASH can progress to HCC bypassing the stage of cirrhosis.25 Therefore, NASH is now emerging as a leading risk factor owing to the epidemic of obesity and type 2 diabetes mellitus becoming major public health problem worldwide. Despite the major public health concern of NAFLD, it is currently impossible by the usual histological methods to identify at early stage patients that will progress from steatosis to NASH. This justifies the need for new methods to quantitatively assess the early biochemical changes related to this pathology.
At present, the gold standard for the diagnosis of liver pathology is liver biopsy. These liver probes are analyzed mainly by visual inspection after appropriate staining protocols. Although rich in information, from the clinical point of view, histopathology of liver is prone to intra- and inter-observer variability, which can yield poor reproducibility even when performed by experts. In the study of El-Badry et al.,26 4 pathologists assessed the features of NAFLD/NASH and a strong disagreement was found for all parameters including the overall diagnosis. Evaluation of NAFLD is therefore strongly observer-dependent and seems weakly reproducible. The inability to objectively assess the NASH and identify at an early stage patients that will progress from steatosis to NASH justifies the need for new methods to quantitatively assess the biochemical changes related to this pathology. Recently, joint application of time-of-flight secondary ion mass spectrometry, DUV microspectroscopy and infrared microspectroscopy for lipid, protein, sugar and nucleic acid mapping on liver samples has been developed.1,27 Early studies showing SHG microscopy as a tool for liver-pathology examination were reported.28,29 Since then, several research groups assessed the method as a perspective technique bringing more sensitive results than conventional fibrosis scoring methods3,9 and proposed a quantification method.20,30 Because SHG microscopy presents perspectives as a fast, non-destructive, quantitative technique, which eliminates human factors in a liver analysis procedure, its combination with DUV single photon fluorescence microscopy seems even more promising.
Acknowledgements
Vitalijs Zubkovs is supported by ERASMUS MUNDUS student grant. We acknowledge Synchrotron SOLEIL support through projects #20100064, 201000181, 20100949 and 20110131.Notes and references
- G. A. Di Lullo, S. M. Sweeney, J. Körkkö, L. Ala-Kokko and J. D. San Antonio, J. Biol. Chem., 2001, 277, 4223–4231 CrossRef PubMed.
- P. Campagnola, M. Wei, A. Lewis and L. M. Loew, Biophys. J., 1999, 77, 3341–3349 CrossRef CAS.
- L. Gailhouste, Y. Le Grand, C. Odin, D. Guyader, B. Turlin, F. Ezan, Y. Désille, T. Guilbert, A. Bessard, C. Frémin, N. Theret and G. Baffet, J. Hepatol., 2010, 52, 398–406 CrossRef CAS PubMed.
- P. Campagnola, A. Millard, M. Terasaki, P. E. Hoppe, C. J. Malone and W. A. Mohler, Biophys. J., 2002, 81, 493–508 CrossRef.
- J. A. Palero, H. S. de Bruijn, A. van der Ploeg van den Heuvel, H. J. C. M. Sterenborg and H. C. Gerritsen, Biophys. J., 2007, 93, 992–1007 CrossRef CAS PubMed.
- G. Filippidis, E. J. Gualda, M. Mari, K. Troulinaki, C. Fotakis and N. Tavernarakis, Micron, 2009, 40, 876–880 CrossRef CAS PubMed.
- X. Chen, O. Nadiarynkh, S. Plotnikov and P. J. Campagnola, Nat. Protoc., 2012, 7, 654–669 CrossRef CAS PubMed.
- F. Jamme, S. Villette, A. Giuliani, V. Rouam, F. Wien, B. Lagarde and M. Refregiers, Microsc. Microanal., 2010, 16, 507–514 CrossRef CAS PubMed.
- F. Jamme, S. Kascakova, S. Villette, F. Allouche, S. Pallu, V. Rouam and M. Refregiers, Biol. Cell, 2013, 105, 277–288 CrossRef CAS PubMed.
- W. R. Zipfel, R. M. Williams and W. W. Webb, Nat. Biotechnol., 2003, 21, 1369–1377 CrossRef CAS PubMed.
- A. Giuliani, F. Jamme, V. Rouam, F. Wien, J.-L. Giorgetta, B. Lagarde, O. Chubar, S. Bac, I. Yao, S. Rey, C. Herbeaux, J.-L. Marlats, D. Zerbib, F. Polack and M. Refregiers, J. Synchrotron Radiat., 2009, 16, 835–841 CrossRef PubMed.
- A. Edelstein, N. Amodaj, K. Hoover, R. Vale and N. Stuurman, Current protocols in molecular biology, 2010, vol. 92, pp. 14.20.1–14.20.17 Search PubMed.
- A. A. de Aro, B. de Campos Vidal and E. R. Pimentel, Micron, 2012, 43, 205–214 CrossRef PubMed.
- P. P. Provenzano and R. Vanderby Jr, Matrix Biol., 2006, 25, 71–84 CrossRef CAS PubMed.
- T. A. Theodossiou, C. Thrasivoulou, C. Ekwobi and D. L. Becker, Biophys. J., 2006, 91, 4665–4677 CrossRef CAS PubMed.
- W. Zipfel, R. Williams, R. Christie, A. Nikitin, B. Hyman and W. Webb, Proc. Natl. Acad. Sci. U. S. A., 2003, 100, 7075–7080 CrossRef CAS PubMed.
- M. R. Kasimova, J. Grigiene, K. Krab, P. H. Hagedorn, H. Flyvbjerg, E. Andersen and I. M. Moller, Plant Cell, 2006, 18, 688–698 CrossRef CAS PubMed.
- A. G. Wagnières, W. M. Star and B. C. Wilson, Photochem. Photobiol., 1998, 68, 603–632 CrossRef.
- D. C. S. Tai, N. Tan, S. Xu, C. H. Kang, S. M. Chia, C. L. Cheng, A. Wee, C. L. Wei, A. M. Raja, G. Xiao, S. Chang, J. C. Rajapakse, P. T. C. So, H.-H. Tang, C. S. Chen and H. Yu, J. Biomed. Opt., 2009, 14, 044013 CrossRef PubMed.
- P. Angulo, Hepatology, 2010, 51, 373–375 CrossRef PubMed.
- C. P. Day and O. F. James, Gastroenterology, 1998, 114, 842–845 CrossRef CAS.
- M. R. Teli, O. F. James, A. D. Burt, M. K. Bennett and C. P. Day, Hepatology, 1995, 22(6), 1714–1719 CrossRef CAS.
- C. A. Matteoni, Z. M. Younossi, T. Gramlich, N. Boparai, Y. C. Liu and A. J. McCullough, Gastroenterology, 1999, 116(6), 1413–1419 CrossRef CAS.
- R. G. Lee, Hum. Pathol., 1989, 20(6), 594–598 CrossRef CAS.
- K. Yasui, E. Hashimoto, Y. Komorizono, K. Koike, S. Arii, Y. Imai, T. Shima, Y. Kanbara, T. Saibara, T. Mori, S. Kawata, H. Uto, S. Takami, Y. Sumida, T. Takamura, M. Kawanaka and T. Okanoue, Clin. Gastroenterol. Hepatol., 2011, 9(5), 428–433 CrossRef PubMed.
- A. M. El-Badry, S. Breitenstein, W. Jochum, K. Washington, V. Paradis, L. Rubbia-Brandt, M. A. Puhan, K. Slankamenac, R. Graf and P. A. Clavien, Ann. Surg., 2009, 250(5), 691–697 CrossRef PubMed.
- V. W. Petit, M. Refregiers, C. Guettier, F. Jamme, K. Sebanayakam, A. Brunelle, O. Laprevote, P. Dumas and F. Le Naour, Anal. Chem., 2010, 82, 3963–3968 CrossRef CAS PubMed.
- R. Bataller and D. A. Brenner, J. Clin. Invest., 2005, 115, 209–218 CAS.
- G. Cox, E. Kable, A. Jones, I. Fraser, F. Manconi and M. D. Gorrell, J. Struct. Biol., 2003, 141, 53–62 CrossRef CAS.
- T. Guilbert, C. Odin, Y. Le Grand, L. Gailhouste, B. Turlin, F. Ezan, Y. Désille, G. Baffet and D. Guyader, Opt. Express, 2010, 18, 25794–25807 CrossRef CAS PubMed.
Footnote |
| † Actual address: EPFL/STI – IBI – STI/LBP – CH – 1015 Lausanne, Switzerland. |
| This journal is © The Royal Society of Chemistry 2014 |