
Cell-membrane-targeted near-infrared fluorescent probe for detecting extracellular ATP†
Wan
Sun
 *a,
Xiangling
Gu
a,
Pingxuan
Dong
a,
Lianjun
Chu
a,
Zhongyu
Zhang
a,
Zhenyuan
Cheng
a and
Fan
Yang
*abc
*a,
Xiangling
Gu
a,
Pingxuan
Dong
a,
Lianjun
Chu
a,
Zhongyu
Zhang
a,
Zhenyuan
Cheng
a and
Fan
Yang
*abc
aShandong Provincial Engineering Laboratory of Novel Pharmaceutical Excipients, Sustained and Controlled Release Preparations, College of Medicine and Nursing, Dezhou University, Dezhou 253023, China. E-mail: sunwananhui@163.com; yf0004032@163.com
bKey Laboratory of Molecular and Nano Probes, Ministry of Education, Shandong Normal University, Jinan 250014, China
cState Key Laboratory of Analytical Chemistry for Life Science, Collaborative Innovation Center of Chemistry for Life Sciences, School of Chemistry and Chemical Engineering, Nanjing University, 210023, China
First published on 3rd August 2022
Abstract
Extracellular adenosine triphosphate (ATP) as a signal molecule plays a key role in tumor progression and metastasis. Therefore, the development of a fluorescent probe to detect extracellular ATP is crucial for tumor treatment. However, small-molecule fluorescent probes have better advantages than biological probes, such as low price, easy modification, and optical tunability, but still remain highly challenging and rarely explored in extracellular ATP detection. Here, a near-infrared small molecule fluorescent probe (NIR-P) with hydrophobic alkyl chains and hydrophilic macrocyclic polyamines was prepared for the detection of extracellular ATP. The NIR-P exhibited enhanced fluorescence upon binding to ATP by electrostatic interaction and π–π interaction between phosphates and macrocyclic polyamines, adenines and benzene rings with a limit of detection (LOD) of 21 nM. In addition, with similarity and intermiscibility to the cell membrane, the NIR-P can specifically target cell membranes and image extracellular ATP. This work provides a cell-membrane-targeted fluorescent probe used for extracellular ATP detection.
Introduction
ATP is one of the most important intracellular metabolites and signaling molecules.1–3 Under physiological or chemical stress conditions, such as mechanical damage, plasma membrane damage, hypoxia and cytotoxic agents, and apoptotic stimulus, a large amount of intracellular ATP is released into the extracellular matrix.4–7 In the presence of extracellular ATP, antigen-presenting cells are better at engulfing dead cells to induce a specific antitumor immune response against homologous tumor cells, indicating that the ultrahigh extracellular level of ATP in tumor enables it to be a useful signal molecule for cancer diagnosis and therapy.8–10 Hence, an ability to visualize extracellular ATP is urgently needed to get insights into its pathological roles. Currently, extracellular ATP probes that have been reported are mostly biological or bio-chemical composite probes, which have many barriers including high cost, complex construction, and poor structural controllability,11–13 Hence, a probe with a controllable structure, low price, easy modification, and optical tunability is desperately needed for detecting extracellular ATP.Small-molecule fluorescent probes have the advantages of high sensitivity, simple operation, reproducibility and good membrane penetration.14,15 Combined with fluorescence imaging technology, small-molecule fluorescent probes are used for non-destructive detection of target molecules in biological systems and can realize dynamic monitoring of in situ biomolecules and biological processes in vitro and in vivo.16,17 In order to detect ATP, several small-molecule fluorescent ATP sensors have been built which mainly contain mitochondria-targeted, cytoplasm-targeted and lysosome-targeted fluorescent ATP probes. According to the structural characteristics, ATP fluorescence chemosensors are categorized as Zn(II) metal ions based on their bonding site type (Zn-DPA). Other metal ions are recognized based on both their bonding site type (copper complex) and their interaction type such as electrostatic or hydrogen bond (imidazolium salt, pyridinium salt, and quaternary ammonium salt).18–23 However, the current small-molecule fluorescent probes are used to detect only intracellular ATP and the small-molecule fluorescent probes for detecting extracellular ATP are still lacking.
Some other types of extracellular ATP probes6,13,24,25 and membrane-targeted small-molecule fluorescent probes provide us inspiration to detect ATP in the extracellular milieu of tumors.26,27 By constructing a class of symmetrical fluorescent molecules, one end of which is connected to the cell membrane and the other end is bound to ATP, better detection of extracellular ATP can be achieved. Herein, a near-infrared fluorescent probe NIR-P was used for extracellular ATP detection due to the electrostatic interaction and π–π interaction between phosphates and macrocyclic polyamines, adenines and benzene rings (Scheme 1). The NIR-P exhibited high sensitivity and low LOD for ATP. More remarkably, with similarity and intermiscibility to the cell membrane, the NIR-P can specifically target cell membranes and hence can be used for imaging extracellular ATP.
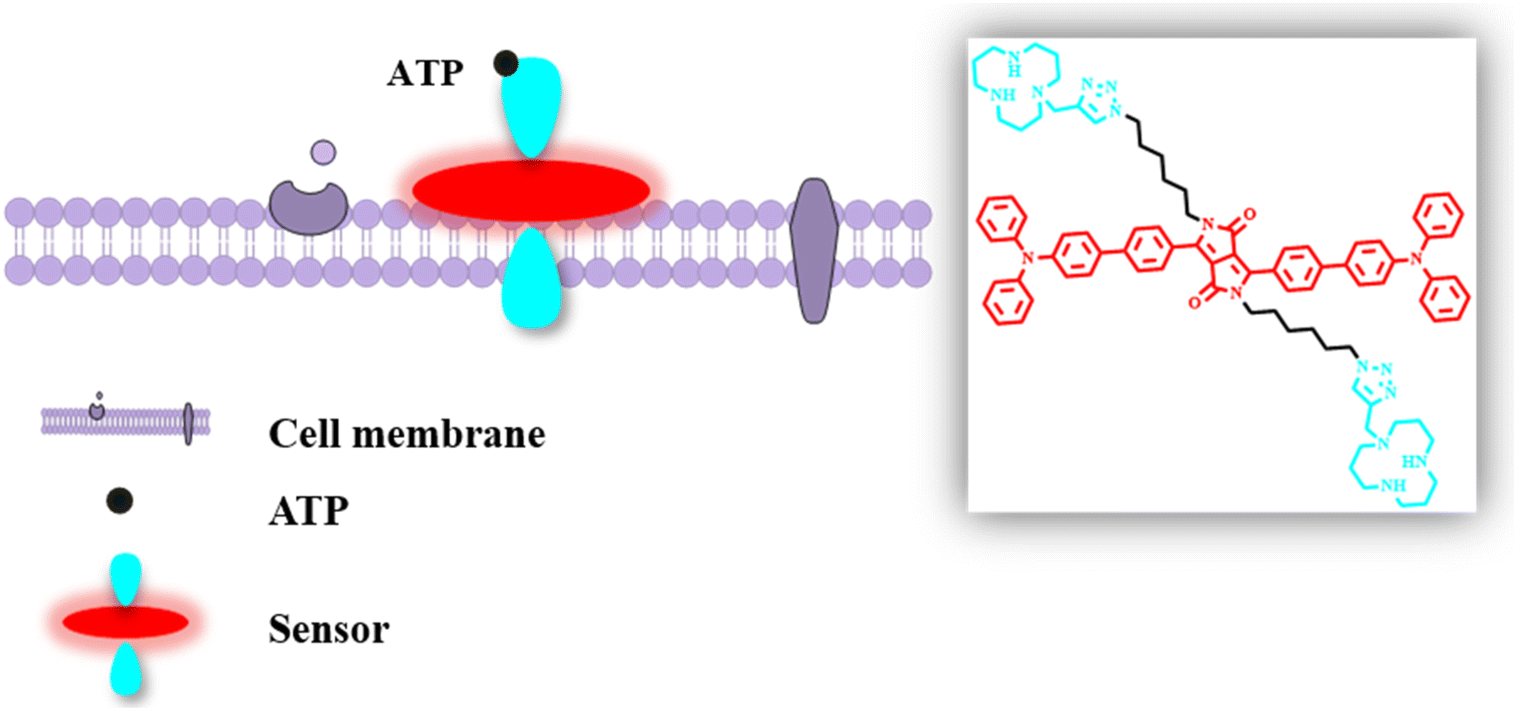 | ||
| Scheme 1 Chemical structure of the NIR-P and the application for detecting extracellular ATP. | ||
Results and discussion
UV-vis absorption and fluorescence properties of the NIR-P
The UV-vis absorption and fluorescence properties of the NIR-P were analyzed in water by UV-vis spectra and fluorescence spectra. As shown in Fig. 1A and Table S1,† the NIR-P displayed three absorption peaks at 400–700 nm in H2O. The peak at 310 nm was caused by the π–π* transition. The peaks at 415 and 514 nm could be attributed to the intramolecular charge transfer (ICT).29 As shown in Fig. 1B, the NIR-P showed virtually no emission in H2O. As the glycerol fraction (fw) increases from 0% to 100%, the fluorescence intensity of FL-DPP at 640 nm gradually enhances and the fluorescence quantum yield (Φ) increases from 0.01 to 0.25, which is due to the higher fw value of glycerol, which leads to the restriction of intramolecular rotation (RIR) of the NIR-P and causes an increase in fluorescence intensity.30,31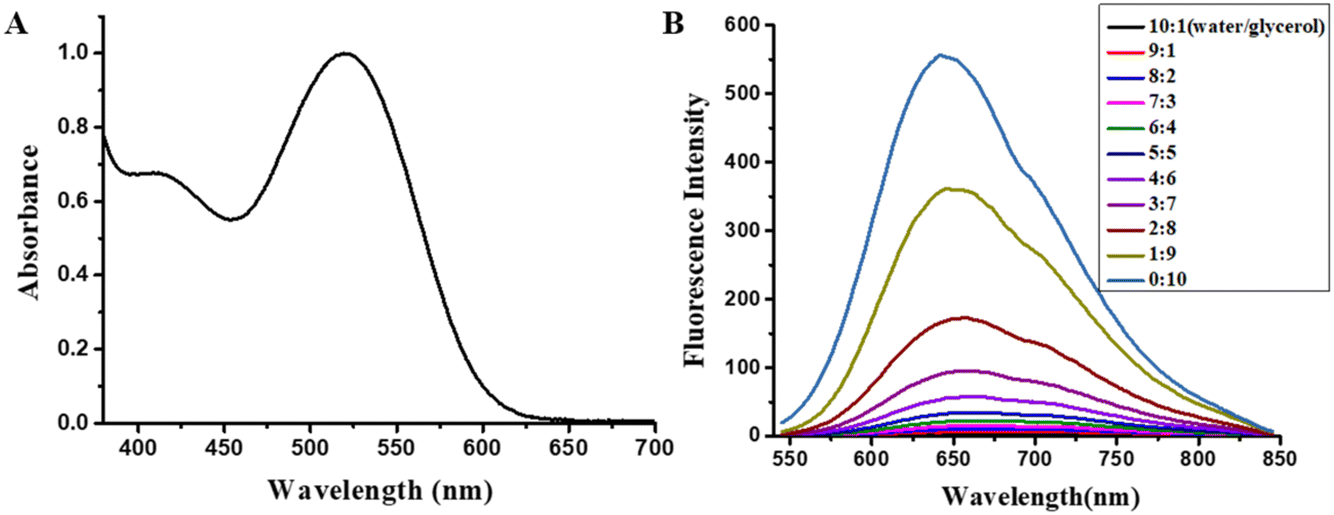 | ||
| Fig. 1 (A) Linear absorption of the NIR-P and (B) fluorescence spectra of the NIR-P in the water/glycerol mixture (λex = 520 nm). ([NIR-P] = 10 μM.) | ||
The optical properties of the NIR-P were analyzed in a mixed solvent of H2O and THF as shown in Fig. S2.† With the increase in THF fraction, UV-vis absorption was gradually blue shifted (Fig. S2A†) and the fluorescence intensity at 625 nm was increased by 42 times (Fig. S2B and C†), which can also be attributed to the RIR of the NIR-P.
To further validate that NIR-P could interact with the amphiphilic lipid bilayer, we prepared liposomes and analyzed the fluorescent properties of the NIR-P. Liposomes with a diameter of 300 nm were prepared by mixing soy lecithin and cholesterol (Fig. S3†). Cholesterol was used to stabilize the liposomes. NIR-P at various concentrations (5–30 μM) was added to the liposomes to obtain probe-loaded liposomes. The fluorescence of NIR-P enhanced dramatically as the concentration of the NIR-P increased (Fig. S4†). The morphologies of NIR-P in H2O, THF and liposomes were observed by SEM. The spherical particles were assembled in water, while cubes were assembled in THF and liposomes resulted in enhanced fluorescence (Fig. S5†). These results indicated that the NIR-P was inserted into the liposomes and the intramolecular rotation of NIR-P was restricted by the lipid bilayer structure.
Interaction between the NIR-P and ATP
As shown in Fig. 2A, the absorption peak of the NIR-P at 514 nm blue-shifted to 512 nm after its interaction with ATP, which can be due to the restriction of RIR after combining with the ATP.32 The fluorescence intensity was increased upon increasing the ATP and the fluorescence intensity was linearly related to the concentration of ATP (Fig. 2B).33 In the range of the linear relationship (y = 42.6 + 41.8x) (R2 = 0.99), with the addition of ATP, the fluorescence of NIR-P increased 5.6-fold and the LOD was 21 nM upon calculation by the formula 3σ/k, which proved that the NIR-P has high sensitivity towards ATP (Fig. 2C). | ||
| Fig. 2 (A) Absorption spectra of the NIR-P (10 μM) in the absence and presence of ATP (10 μM); (B) fluorescence spectra of the NIR-P (10 μM) responding to ATP at concentrations (0–10 μM); (C) calibration curve between the fluorescence intensity of the NIR-P with different concentrations of ATP (0–5 μM) in PBS (λex = 520 nm and λem = 640 nm). | ||
Static laser light scattering (SLLS) was performed to further validate the interaction of the NIR-P and ATP. As shown in Fig. 3A, the NIR-P (10 μM) produced a narrow peak of 18 nm in water; after adding 1.25 μM ATP, the diameter distribution of NIR-P–ATP appeared as a broad peak of 90 nm; the particle sizes became larger with increasing ATP concentration, which indicated NIR-P was self-assembling with ATP to lead the RIR phenomenon.
 | ||
| Fig. 3 (A) Diameter of the NIR-P (10 μM) with different concentrations of ATP (0–10 μM) in PBS; (B) fluorescence response of the NIR-P (10 μM) towards various biomolecule analytes: ATP, ADP, AMP, CMP, GTP, GMP, UTP, and PPI and the ions PO43−, HPO42−, H2PO4−, Cl−, NO3−, and HSO3− (10 μM). (λex = 520 nm and λem = 640 nm.) | ||
In addition, the NIR-P exhibited high selectivity to ATP over other biological anions (Fig. 3B). The fluorescence intensity of the NIR-P showed significant enhancement only in the presence of ATP. While the NIR-P was combined with other biological anions (adenosine diphosphate (ADP), adenosine monophosphate (AMP), cytidine 5-monophosphate (CMP), guanosine triphosphate (GTP), guanosine monophosphate (GMP), uridine triphosphate (UTP), pyrophosphoric acid (PPi)), the inorganic anions (PO43−, HPO42−, H2PO4−, Cl−, NO3−, and HSO3−) did not exhibit obvious fluorescence enhancement, which proved that the NIR-P has high selectivity in response to ATP.
Fluorescence images in cells
The toxicity of NIR-P was first investigated after incubating tumor cells with the NIR-P (10–40 μM) for 24 h. The cell viability is over 80% (Fig. S6†), which indicated that the NIR-P had low cytotoxicity within the working concentration range.The co-localization experiment was carried out to confirm the cell membrane targeting capability of the NIR-P using DiO (a commercial cell membrane dye).34 As shown in Fig. 4A–D, the overlap coefficient reached up to 0.95, indicating that the NTR-P is highly overlapped with DIO, which in turn indicated that NTR has specificity for cell membrane targeting.
 | ||
| Fig. 4 Colocalization imaging of RAW cells stained with the NIR-P (20 μM) and DiO (5 μM). (A) Confocal fluorescence images of DiO (λex = 488 nm and λem = 530–560 nm); (B) confocal fluorescence images of the NIR-P (λex = 532 nm and λem = 600–720 nm); (C) bright field image of RAW cells; and (D) overlay of (A–C). Scale bars: 20 μm. | ||
In order to evaluate the capability of the NIR-P for the visualization of extracellular ATP, fluorescence imaging experiments were performed and the results were shown in Fig. 5. 2-Deoxyglucose, an inhibitor of glycolysis, which can reduce ATP levels, was used to detect the extracellular ATP dynamically.35 Originally, NIR-P showed red fluorescence after incubation with HeLa cells for 1 h. The red fluorescence intensity gradually decreased after treatment with 10 mM 2-deoxyglucose for different times (Fig. 5B–D). After adding an additional 10 mM ATP, the red fluorescence recovered (Fig. 5E). The corresponding fluorescence intensities that were calculated quantitatively are presented in Fig. 5G.
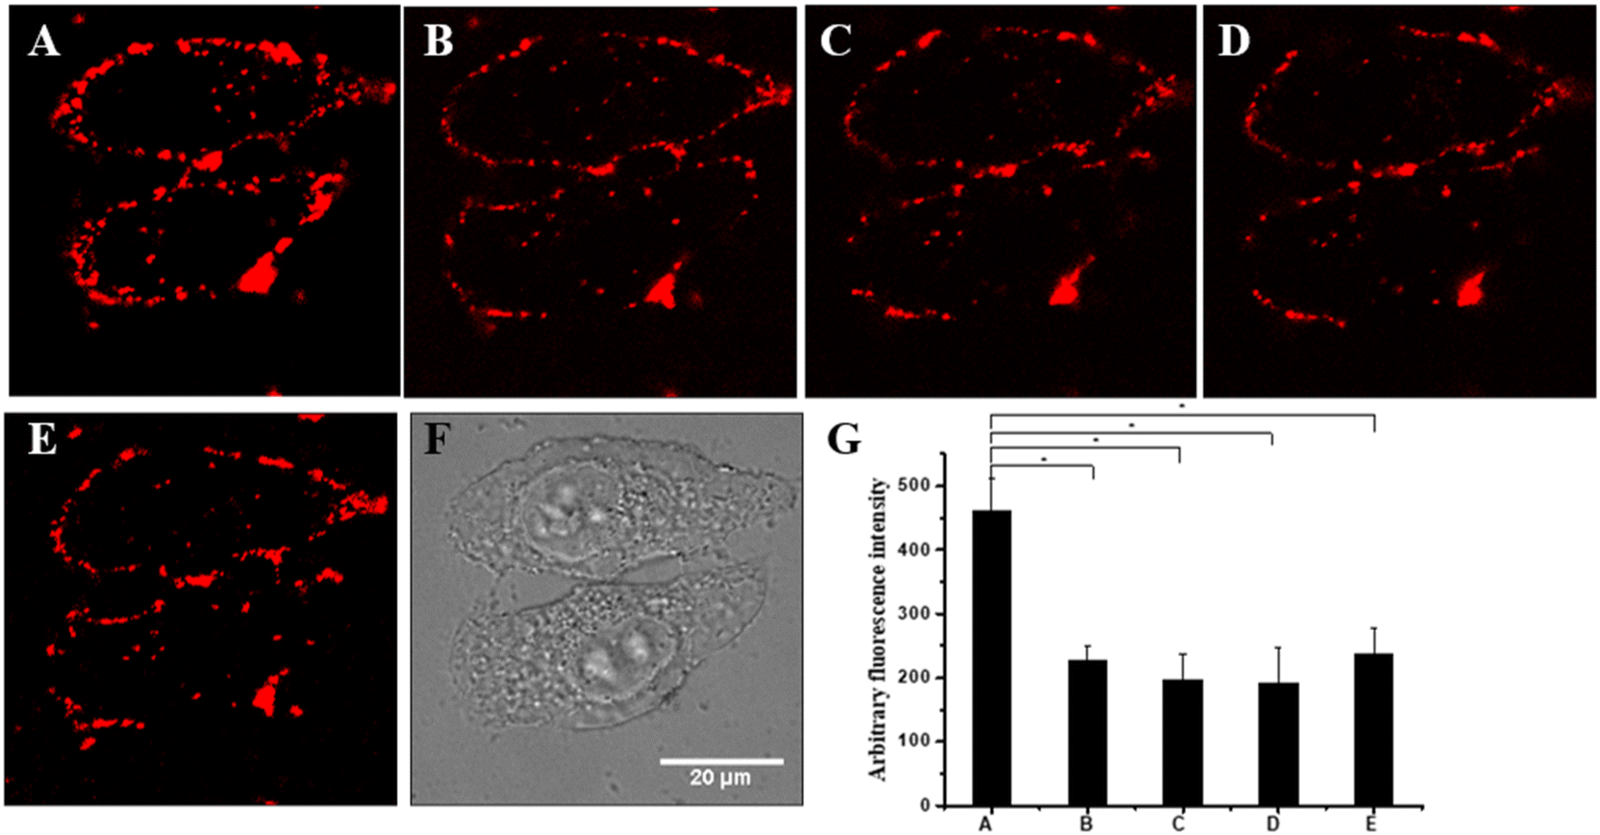 | ||
| Fig. 5 Fluorescence imaging of HeLa cells with the NIR-R (20 μM) and 2-deoxyglucose (10 mM) for different times (A) 0, (B) 5, (C) 10, and (D) 20 min, (E) adding additional 10 mM of ATP, (F) bright field image of HeLa cells, and (G) quantitative calculation of images. Scale bar: 20 μm. (λex = 532 nm and λem = 600–720 nm.) | ||
Imaging of ATP in vivo
The good performance of the NIR-P for dynamically detecting ATP in living cells motivated us to further investigate effective ATP monitoring in vivo. Nude mice were divided into 4 groups as shown in Fig. 6A. The nude mice with 10 mM 2-deoxyglucose treatment showed no fluorescence and the nude mice treated with NIR-R (40 μM) for 10 min exhibited fluorescence (Fig. 6B). When the nude mice were further treated with 10 mM 2-deoxyglucose, a remarkable decrease in fluorescence occurred and the fluorescence intensity gradually decreases after treating with 10 mM 2-deoxyglucose for different times (Fig. S7†). After treatment with 10 mM ATP, a significant fluorescence enhancement was observed (Fig. 6C and D). The corresponding fluorescence intensities calculated quantitatively are presented in Fig. 6E, which indicated that the NIR-R could be applied in ATP imaging of living organisms. | ||
| Fig. 6 In vivo imaging of tumor-bearing nude mice. (A) 10 mM 2-deoxyglucose; (B) 40 μM NIR-R; (C) 40 μM NIR-R with 10 mM 2-deoxyglucose; (D) 40 μM NIR-R with 10 mM ATP; and (E) quantitative calculation of the images. (λex = 532 nm and λem = 600–720 nm.) | ||
Conclusions
In conclusion, the near-infrared fluorescent probe NIR-P was used for extracellular ATP detection. The NIR-P can specifically target cell membranes and image extracellular ATP and exhibit high sensitivity and a low LOD of 21 nM for ATP. This work will provide a small organic fluorescent probe for monitoring extracellular ATP for monitoring the occurrence of various diseases related to ATP. Simultaneously, the NIR-P could provide technical support for cell membrane probes and extracellular detection.Experimental
Materials and methods
The probe characterization data include the 1H, 13C NMR and mass spectra of the chemical structure recorded using a Bruker Avance III 400 MHz spectrometer (Bruker, Germany) and a Waters LCT Premier XE spectrometer (Waters, USA). The fluorescence and UV-vis spectra data were recorded by using a UV-2600 UV-vis spectrophotometer (Shimadzu, Japan) and an FL-2000 spectrometer (Shimadzu, Japan). The fluorescent images were acquired using confocal laser scanning microscopy (CLSM) (Nikon A1R systems, Nikon, Japan). The HeLa and HepG2 cell lines were obtained from the Institute of Biochemistry and Cell Biology, SIBS, CAS (China). The nude mice were obtained from Zixibio Co., Ltd.Synthesis of the NIR-P
As shown in Fig. S1,† according to the literature,28 the synthesis of intermediate products is shown in the ESI.† The NIR-P was obtained through TPA-DPP-[12]aneN3-Boc (0.05 g 0.027 mmol) having BOC acid anhydride removed in acidic medium (0.03 g, 82%). 1H NMR (400 MHz, d6-DMSO) δ 9.64 (d, J = 36.9 Hz, 6H), 8.36 (s, 1H), 8.07 (s, 1H), 7.89 (d, J = 16.9 Hz, 6H), 7.72 (s, 4H), 7.35 (s, 6H), 7.18–6.82 (m, 14H), 3.75 (s, 20H), 3.54–2.94 (m, 18H), 2.02 (dd, J = 63.3, 35.6 Hz, 10H), 1.72 (s, 4H), 1.46 (s, 4H), 1.18 (s, 8H). 13C NMR (126 MHz, d6-DMSO) 162.16, 148.12, 147.78, 147.32, 142.57, 132.55, 130.24, 129.81, 128.34, 126.75, 126.50, 125.13, 124.21, 123.04, 109.31, 60.21, 50.99, 49.99, 49.04, 46.95, 41.40, 29.97, 29.08, 26.31, 25.89, 25.70. 21.06, 19.32, 17.28. HR-MS: m/z calcd [M + 2H]2+ for C90H108N16O2, 722.4342; found, 722.9431.UV-vis absorption and fluorescence property studies
Stock solutions of the probe (1 mM) were prepared in H2O. The test solutions were prepared by adding 20 μL of the NIR-P stock solution into a test tube for diluting these stock solutions to 2 mL with 1 mM PBS buffer (pH = 7.4). Then an equivalent molar amount of analyte was added.The fluorescence quantum yields (Φ) were determined relative to rhodamine B using a standard method. Quantum yields were corrected as follows:

Cytotoxicity test
HeLa, RAW and A549 cells were seeded into 96-well plates at a density of 6 × 10³ cells and incubated under 37 °C and 5% CO2 for 12 h. Then, the NIR-P at different concentrations was added to the cells and then incubated for another 24 h. The medium was removed and the cytotoxicity was evaluated using the MTT assay. Finally, the absorbance was recorded and the cell viability was calculated.Cell imaging
In the colocalization assay, tumor cells were seeded into 3 cm confocal dishes, 20 μM NIR-P and 5 μM DiO were added and co-stained with HeLa cells at 37 °C and 5% CO2 for 30 min. The extracellular probe solution was removed and the HeLa cells were washed with PBS. A Nikon A1R system was used to capture the fluorescence images. An extracellular ATP detection assay was performed in which the tumor cells were co-stained with 20 μM NIR-P and 10 mM 2-deoxyglucose for different times. A Nikon A1R system was used to capture the fluorescence images.In vivo imaging
The mice tumor model was first constructed. 0.5 mL of HeLa cells (1 × 10⁶) was injected into the flank region of six-week-old female nude mice (20 ± 2 g). When the average size of the tumor reached 200 mm3, the living mice were treated with the NIR-R (40 μM) for 10 min, then treated with 10 mM 2-deoxyglucose and 10 mM ATP, and then the in vivo images were acquired through an in vivo fluorescence imaging system. All experiment protocols were approved by the Animal Care Committee of Dezhou University.Ethical statement
All animal procedures were performed in accordance with the Guidelines for the Care and Use of Laboratory Animals of Dezhou University and approved by the Animal Ethics Committee of Dezhou University.Conflicts of interest
There are no conflicts to declare.Acknowledgements
This article was financially supported by the National Natural Science Foundation of China (22104010 and 21806019), the Shandong Provincial Natural Science Foundation (ZR2021QB141 and ZR2020MB022), the State Key Laboratory of Analytical Chemistry for Life Science (SKLACLS2016), the Open Foundation of the Key Laboratory of Molecular and Nano Probes, Ministry of Education, Shandong Normal University (no. 2020KLMNP04), the Research Start-up Fund of Dezhou University (2019xjrc335 and 2019xjrc203), and the Experimental Technology Project of Dezhou University (SYJS21006, SYJS22002).References
- T. Yusufzai and J. T. Kadonaga, Science, 2008, 322, 748 CrossRef CAS PubMed.
- B. Huang, B. Liang, R. Zhang and D. Xing, Coord. Chem. Rev., 2022, 452, 214302 CrossRef CAS.
- V. Vultaggio Poma, A. C. Sarti and F. Di Virgilio, Cells, 2020, 9, 2496 CrossRef CAS PubMed.
- G. Kroemer, L. Galluzzi, O. Kepp and L. Zitvogel, Annu. Rev. Immunol., 2013, 31, 51–72 CrossRef CAS PubMed.
- Y. Wang, I. Martins, Y. Ma, O. Kepp, L. Galluzzi and G. Kroemer, Autophagy, 2013, 9, 1624–1625 CrossRef CAS PubMed.
- Z. Di, J. Zhao, H. Chu, W. Xue, Y. Zhao and L. Li, Adv. Mater., 2019, 31, 1901885 CrossRef PubMed.
- F. Di Virgilio, A. C. Sarti, S. Falzoni, E. De Marchi and E. Adinolfi, Nat. Rev. Cancer, 2018, 18, 601–618 CrossRef CAS PubMed.
- J. m. Loo, A. Scherl, A. Nguyen, F. y. Man, E. Weinberg, Z. Zeng and L. Saltz, Cell, 2015, 160, 393–406 CrossRef CAS PubMed.
- Z. Zhou, Y. Liu, M. Zhang, C. Li, R. Yang, J. Li, C. Qian and M. Sun, Adv. Funct. Mater., 2019, 29, 1904144 CrossRef.
- M. Michaud, I. Martins and Q. Sukkurwala Abdul, Science, 2011, 334, 1573–1577 CrossRef CAS PubMed.
- C. Wang, C. Y. C. Huang and W. C. Lin, Biosens. Bioelectron., 2013, 43, 355–361 CrossRef CAS PubMed.
- H. Doi, T. Horio, Y. J. Choi, K. Takahashi, T. Noda and K. Sawada, Sensors, 2022, 22, 75 CrossRef CAS PubMed.
- N. Kitajima, K. Takikawa and H. Sekiya, eLife, 2020, 9, e57544 CrossRef CAS PubMed.
- Y. Huang, Y. Zhang, F. Huo, Y. Wen and C. Yin, Sci. China: Chem., 2020, 63, 1742–1755 CrossRef CAS.
- W. Xu, Z. Zeng, J. H. Jiang, Y. T. Chang and L. Yuan, Angew. Chem., Int. Ed., 2016, 55, 13658–13699 CrossRef CAS PubMed.
- L. Fang and M. Watkinson, Chem. Sci., 2020, 11, 11366–11379 RSC.
- L. Wu, J. Liu, X. Tian and R. R. Groleau, J. Am. Chem. Soc., 2022, 144, 174–183 CrossRef CAS PubMed.
- W. Sun, G. Liu, M. Tong, H. Wang and S. Liu, Analyst, 2021, 146, 1892–1896 RSC.
- T. B. Ren, S. Y. Wen, L. Wang, P. Lu, B. Xiong, L. Yuan and X. B. Zhang, Anal. Chem., 2020, 92, 4681–4688 CrossRef CAS PubMed.
- B. H. Huang, Z. R. Geng, X. Y. Ma, C. Zhang, Z. Y. Zhang and Z. L. Wang, Biosens. Bioelectron., 2016, 83, 213–220 CrossRef CAS PubMed.
- A. F. Tikum, G. Kim, A. Nasirian, J. W. Ko, J. Yoon and J. Kim, Sens. Actuators, B, 2019, 292, 40–47 CrossRef CAS.
- (a) A. Ojida, I. Takashima, T. Kohira, H. Nonaka and I. Hamachi, J. Am. Chem. Soc., 2008, 130, 12095–12101 CrossRef CAS PubMed; (b) Y. Kurishita, T. Kohira, A. Ojida and I. Hamachi, J. Am. Chem. Soc., 2010, 132, 13290–13299 CrossRef CAS PubMed.
- (a) W. Qu, H. Fang, Q. Huang, Y. Zhang, Q. Lin, H. Yao and T. Wei, Chin. J. Org. Chem., 2019, 39, 1226–1228 CrossRef CAS; (b) J. D. Zhang, J. Zhang, Z. Yan and J. P. Xie, Chin. J. Org. Chem., 2019, 39, 3051–3064 CrossRef CAS; (c) Y. Wu, J. Wen, H. Li, S. Sun and Y. Xu, Chin. Chem. Lett., 2017, 28, 1916–1924 CrossRef CAS; (d) G. Jiang, W. Zhu, Q. Chen, A. Shi and Y. Wu, Analyst, 2017, 142, 4388–4392 RSC.
- J. Yuan, Z. Deng, H. Liu, X. Li, J. Li, Y. He, Z. Qing, Y. Yang and S. Zhong, ACS Sens., 2019, 4, 1648–1653 CrossRef CAS PubMed.
- Z. Wu, K. He and Y. Chen, Neuron, 2022, 110, 770–782 CrossRef CAS PubMed.
- D. I. Danylchuk, S. Moon, K. Xu and A. S. Klymchenko, Angew. Chem., Int. Ed., 2019, 58, 14920–14924 CrossRef CAS PubMed.
- L. F. Pang, Y. C. Sun, X. F. Guo and H. Wang, Sens. Actuators, B, 2021, 345, 130403 CrossRef CAS.
- W. Sun, X. Y. Liu, L. L. Ma and Z. L. Lu, ACS Appl. Mater. Interfaces, 2020, 12, 10193–10201 CrossRef CAS PubMed.
- X. Wang, Y. Wang, Y. Zhan, P. Yang, X. Zhang and Y. Xu, Tetrahedron Lett., 2018, 59, 2057–2061 CrossRef CAS.
- J. M. Lee, S. B. Yuk, J. W. Namgoong and J. P. Kim, Dyes Pigm., 2021, 185, 108864 CrossRef CAS.
- Y. Qu, Y. Zhu, J. Wu, J. Wu, Z. Gu and Y. Wu, Dyes Pigm., 2020, 172, 107795 CrossRef CAS.
- H. Li, Z. Guo, W. Xie, W. Sun, S. Ji, J. Tian and L. Lv, Anal. Biochem., 2019, 578, 60–65 CrossRef CAS PubMed.
- T. Noguchi, T. Shiraki, A. Dawn, Y. Tsuchiya, L. T. Ngoc Lien, T. Yamamoto and S. Shinkai, Chem. Commun., 2012, 48, 8090–8092 RSC.
- Y. N. Wang, B. Xu, L. H. Qiu, R. Sun, Y. J. Xu and J. F. Ge, Sens. Actuators, B, 2021, 337, 129787 CrossRef CAS.
- K. M. K. Swamy, S. Eom, Y. Liu, G. Kim, D. Lee and J. Yoon, Sens. Actuators, B, 2019, 281, 350–358 CrossRef CAS.
Footnote |
| † Electronic supplementary information (ESI) available. See DOI: https://doi.org/10.1039/d2an00893a |
| This journal is © The Royal Society of Chemistry 2022 |