
 Open Access Article
 This Open Access Article is licensed under a Creative Commons Attribution-Non Commercial 3.0 Unported Licence
A fluidic device for continuous on-line inductive sensing of proteolytic cleavages†
Fan
Li‡
 a,
Leif
Sieben‡
ab,
Johannes
Büchler
a,
Manuel
Strahm
ac,
Pascal
Poc
a,
Matej
Vizovišek
a,
Michael G.
Christiansen
*a and
Simone
Schuerle
*a
a,
Leif
Sieben‡
ab,
Johannes
Büchler
a,
Manuel
Strahm
ac,
Pascal
Poc
a,
Matej
Vizovišek
a,
Michael G.
Christiansen
*a and
Simone
Schuerle
*a
aInstitute of Translational Medicine, Department of Health Sciences and Technology, ETH Zürich, 8092 Zürich, Switzerland. E-mail: michael.christiansen@hest.ethz.ch; simone.schuerle@hest.ethz.ch
bDepartment of Chemistry and Applied Biosciences, ETH Zürich, 8093 Zürich, Switzerland
cDepartment of Information Technology and Electrical Engineering, ETH Zürich, 8092 Zürich, Switzerland
First published on 26th December 2024
Abstract
Proteases, an important class of enzymes that cleave proteins and peptides, carry a wealth of potentially useful information. Devices to enable routine and cost effective measurement of their activity could find frequent use in clinical settings for medical diagnostics, as well as some industrial contexts such as detecting on-line biological contamination. In particular, devices that make use of readouts involving magnetic particles may offer distinct advantages for continuous sensing because material they release can be magnetically captured downstream and their readout is insensitive to optical properties of the sample. Bioassays based on giant magnetoresistance sensors that detect the binding or release of magnetic materials have been widely explored for these reasons, but they typically require expensive consumables. Here, we develop a simpler protease sensor based on inductive detection of particle release with pulsed magnetic fields, leveraging a design that incorporates both the pulse coil and gradiometer coils into a printed circuit board. Our fluidic chips are formed from casts of 3D printed molds, such that both the sensor and the consumable components could be relatively easy to mass produce. Using pulses ranging up to 10 s of mT, we show that our device has a limit of detection below 1 μg of iron and that its duty cycle can be varied to control temperature through Joule heating. By chemically functionalizing the glass surface of our fluidic chips with zwitterionic polymer and incorporating a PEG block co-polymer into the PDMS component, we are able to suppress the nonspecific binding of albumin by 7.8 times inside the chips. We demonstrate a layer-by-layer approach for covalently linking magnetic nanoparticles to the chips via cleavable peptide substrates. Finally, we observe the release of the magnetic particles from the chips under conditions of proteolytic cleavage and measure resulting changes in inductive signals, demonstrating a detection sensitivity for chymotrypsin in the hundreds of nM. The methods we establish here have the potential to aid progress toward sensors comprised of disposable fluidic chips measured by inexpensive detection devices that may one day facilitate ubiquitous protease activity monitoring.
1 Introduction
Proteases, a class of enzymes that catalyze the hydrolysis of peptide bonds within proteins, are involved in a wide variety of physiological processes and play key regulatory roles in protein networks.1 Genes coding for more than 600 proteases are known within humans alone, and still others are uniquely expressed by other organisms.2 Many proteases preferentially cleave peptides at sites corresponding to particular sequences of amino acids, a feature that is both related to their evolutionary function and that offers a basis for the design of assays to identify the activity of specific proteases. If used routinely, inexpensive and robust protease activity monitoring might provide a wealth of actionable data. As biomarkers in ex vivo samples from human patients, altered patterns of proteolytic activity could indicate diseased states, provide information to stratify patients, or guide the course of treatment.2 Moreover, organisms like bacteria that cause infection3 or contaminate industrial biopharmaceutical processes4 also secrete or display proteases with unique cleavage patterns, suggesting that detecting their intrinsically catalytically amplified cleavage events might offer early indications of infection or contamination.Many methods for detecting or measuring proteolytic cleavages in the laboratory have been established, including zymography,5 quenched fluorescence probes,6,7 catalytic nanosensors,8 assays based on selective binding of beads,9 and magnetic resonance relaxation switching.10 In particular, chip-based magnetic sensing methods may offer unique advantages for continuous on-line monitoring applications, including the capability to magnetically capture magnetic agents released due to cleavage, preventing downstream contamination. The most widely researched method for bioassays with magnetic readout has been chips based on giant magnetoresistance (GMR) sensors with the binding or release of magnetic particles from a sensor region, including examples focused on proteases.11 Although GMR devices can be highly sensitive, the required proximity of the GMR sensor to the magnetic particles typically results in the chips becoming an expensive consumable or requiring additional chemical treatment to be regenerated after use.12
By contrast, inductively based sensing methods may ultimately prove advantageous for many simple point-of-care or ubiquitous biosensing applications, especially when form factors are explored that focus on miniaturizable and mass producible sensor designs mitigating the cost and complexity of consumable components. In recent decades, biosensors based on inductive detection with magnetic particle spectroscopy (MPS) have continued to advance, including the development of methods intended to boost detection sensitivity such as dual frequency mixing13,14 or critical offset MPS.15 Volumetric biosensing methods based on MPS typically involve biochemical interactions that alter the hydrodynamic diameter of nanoparticles15 or trigger changes in their aggregation state. This includes clustering around an antigen,16 declustering via DNA or RNA strand displacement,17 or declustering through proteolytic cleavages of peptides.18
Here, we report on the development of a prototype device for inductive sensing of proteolytic cleavages with pulsed magnetic fields by measuring the release of peptide-bound magnetic nanoparticles (MNPs) from a glass substrate (Fig. 1). Because current pulses are applied with a low duty cycle, fields in the tens of mT can be generated in our prototype device using a simple capacitive discharge circuit to supply a driving field. The pulse, sense, and compensation coils are all incorporated into a single eight-layer printed circuit board, suggesting the possibility for inexpensive and scalable fabrication of highly geometrically symmetric detection devices. We show, for a pulse of fixed amplitude and duration, how the pulse rate can be varied to control the temperature on the chip. Our fluidic chips are fabricated by bonding PDMS to glass, with the patterning of the PDMS accomplished through a simple casting process starting with 3D printed forms that are duplicated in epoxy through silicone molding. To reduce nonspecific protein adsorption in the chip, which can limit protease sensitivity, we perform on-chip polymerization of a zwitterionic polymer and add a PEG-based block copolymer to the PDMS. These modifications reduce protein binding, while still ensuring the presence of azide functional groups for the binding of magnetic nanoparticles via peptide substrates designed for chymotrypsin, a well-characterized protease. Finally, we demonstrate inductive monitoring of proteolytic cleavages, assess the detection sensitivity of this prototype, and show magnetic capture of the particles released from the chip.
 | ||
| Fig. 1 Conceptual overview. A fluidic chip with serpentine channels sits over an inductive sensor built into a printed circuit board. Multiple layers of magnetic nanoparticles are attached via peptide substrates to each other and to the glass surface of the fluidic chip. Activity of the protease of interest results in cleavage of the peptides and release of the particles, enabling continuous inductive monitoring of proteolytic cleavages. | ||
2 Materials and methods
2.1 Materials
Glass microscope slides were purchased from Epredia (ISO8037/1 26 × 76 × 1 mm). Polydimethylsiloxane (PDMS) polymer was obtained from Dow Corning (SYLGARD 184 Silicone Elastomer Kit, 01673921). Dimethylsiloxane-(60–70% ethylene oxide) block copolymer (PDMS–PEG BCP) was purchased from Gelest (DBE-712). Amine iron oxide nanoparticles 25 nm (SHA-25) were purchased from Ocean NanoTech. Magnetic separation columns (M columns) were purchased from Miltenyi Biotec (130-042-801). Methanol (99.9%), ethanol (99.8%), isopropanol (99.8%), diethyl ether (99.9%), N,N-diisopropylethylamine (DIPEA, 99%), chlorotrimethylsilane (98%), and hydrochloric acid (HCl, 37%) were obtained from Sigma-Aldrich. Dimethyl sulfoxide (DMSO, 99.7%, extra dry), N-dimethylformamide (DMF, 99.8%, extra dry), and phosphate-buffered saline (PBS, pH 7.4) were purchased from Thermo Fisher Scientific. The initiator, 3-trimethoxysilylpropyl 2-bromo-2-methyl-propionate (99.48%), was obtained from Doug Discovery (S25284). The monomers, N-(3-sulfopropyl)-N-methacroyloxyethyl-N,N-dimethylammonium betaine (SBMA, 98%) and glycidyl methacrylate (GMA, 97%), were obtained from Sigma-Aldrich. The GMA monomer was passed through a basic alumina column (Sigma-Aldrich, 306312) to remove inhibitors prior to use. Potassium hydroxide (KOH, 85%), copper(I) bromide (CuBr, 99.99%), copper(II) bromide (CuBr2, 99%), copper(II) sulfate (CuSO4, 99%), 2,2′-bipyridine (bpy, 99%), sodium ascorbate (98%), sodium azide (NaN3, 99.5%), ammonium chloride (NH4Cl, 99.5%), azidoacetic acid NHS ester, and N-succinimidyl 6-maleimidohexanoate (98%) were purchased from Sigma-Aldrich. Albumin–FITC conjugate (A9771) and chymotrypsin (C4129) were obtained from Sigma-Aldrich. Proteinase K (V302B) and pepsin (V195A) were purchased from Promega. Sulfo-Cyanine3 NHS ester, sulfo-Cyanine3 alkyne, and sulfo-Cyanine3 azide were purchased from Lumiprobe. The click reaction ligand BTTP (BP-26133) was obtained from BroadPharm. The functionalized peptide linkers, propargylglycine-VGFYESDV-propargylglycine and DBCO-succinyl-VGFYESDVC-NH2, were synthesized by CPC Scientific and Bachem AG, respectively.2.2 Fabrication of the fluidic chip
Molds for patterning fluidic channels were designed in Siemens NX 10 and exported as STL files. The channel dimensions specified in the design were 250 μm in height and 1500 μm in width, leading to an overall volume less than 50 μL per channel. A channel width and minimum distance between channels of 1000 μm was maintained in the serpentine region. The designs were 3D printed with an AnyCubic MonoX digital light printer using Prima Creator “Super Strong” black resin. After cleaning with isopropanol, a two-part silicone was cured around the 3D printed parts (Mold Max XLS II, Smooth-On). The resulting silicone mold was used to repeatedly cast copies of the 3D printed design in clear epoxy (EpoxAcast 690, Smooth-On). The cured epoxy molds were treated with oxygen plasma, followed by vapor deposition of chlorotrimethylsilane in a vacuum chamber to reduce adhesion of PDMS. The molds were rinsed with isopropanol and dried with a nitrogen flow prior to use. To prepare PDMS, silicone elastomer base and curing agent were mixed in a ratio of 10![[thin space (1/6-em)]](https://www.rsc.org/images/entities/char_2009.gif) :1 (w/w). Then 0.5% (w/w) of PDMS–PEG BCP was added and mixed thoroughly. After centrifuging at 1000 × g for 5 minutes, the polymer was poured into epoxy molds, followed by degassing for 30 minutes and curing at 80 °C for 24 hours. After oxygen plasma treatment, the PDMS pieces were bonded to glass slides and then the chips were placed on a hotplate at 120 °C overnight.
:1 (w/w). Then 0.5% (w/w) of PDMS–PEG BCP was added and mixed thoroughly. After centrifuging at 1000 × g for 5 minutes, the polymer was poured into epoxy molds, followed by degassing for 30 minutes and curing at 80 °C for 24 hours. After oxygen plasma treatment, the PDMS pieces were bonded to glass slides and then the chips were placed on a hotplate at 120 °C overnight.
2.3 Chemical modification of the fluidic chip
Unless otherwise indicated, the chemical modification steps were performed by continuously pumping reaction solutions into PDMS channels with a flow rate of 0.3 mL per hour. A hotplate was used for reactions requiring heating. First, the channels were washed with 5 M KOH solution for 2 hours to create hydroxyl groups on the surface, followed by rinsing with water. pH was measured at the channel outlet to verify complete removal of KOH. To graft the initiator, a solution of 1% (v/v) 3-trimethoxysilylpropyl 2-bromo-2-methyl-propionate, 1% (v/v) H2O and 98% (v/v) ethanol was introduced into channels and reacted for 16 hours at room temperature. The channels were then washed with ethanol and dried under vacuum. To graft polymers inside channels, a flask containing 1.96 g SBMA (7 mmol) and 312.4 mg bpy (2 mmol) was first placed under nitrogen atmosphere using five pump–refill cycles, followed by addition of 100 μL GMA (0.7 mmol) and 16 mL water/methanol (1:1, v/v). The solution was then syringed to another flask containing 143.5 mg CuBr (1 mmol) and 22.3 mg CuBr2 (0.1 mmol) under nitrogen atmosphere. After stirring to dissolve all solids while bubbling with nitrogen, the dark brown polymerization solution was continuously pumped into initiator-grafted channels with a flow rate of 2.5 mL per hour and the reaction was left for 6 hours at 40 °C. After polymerization, the channels were sequentially washed with DMSO, methanol, and water, followed by drying under vacuum. For post-polymerization modification, a solution of 65 mg NaN3 (1 mmol) and 53.5 mg NH4Cl (1 mmol) in 10 mL DMF was pumped into channels and reacted for 12 hours at 50 °C. The channels were then sequentially washed with DMF and water. The modified chips were dried under vacuum and stored at room temperature for further use.
2.4 Quantification of areal density of azide functional groups
CuSO4 (20 mM in H2O) and BTTP (20 mM in DMSO) were premixed in a ratio of 1:4 (v/v), forming Cu(II)–BTTP complex. 2 μL of Cu(II)–BTTP was added to the solution containing 83 μL PBS buffer, 4 μL DMSO, and 1 μL sulfo-Cyanine3 alkyne (10 mM in DMSO). Then, 10 μL of sodium ascorbate (25 mM in H2O, freshly prepared) was added and mixed thoroughly (final concentration: 100 μM sulfo-Cyanine3 alkyne, 160 μM CuSO4, 640 μM BTTP, 2.5 mM sodium ascorbate). Another solution without adding Cu(II)–BTTP served as a control. The solution was syringed inside channels and left to react for 1 hour at room temperature in a dark environment. After reaction, the channels were thoroughly washed with water and dried with nitrogen. Fluorescence images of the chip were captured by a Sapphire Biomolecular Imager (Azure Biosystems). The settings of the imager were as follows: dye: Cy3, intensity: 5, pixel size: 500 μm, scan speed: high, sample type: slide. To quantify areal density of functional groups on the surface, a serial dilution of sulfo-Cyanine3 alkyne was scanned with the same settings.
2.5 Protein adsorption assay
The channels were first incubated with PBS buffer for 30 min to reach pre-equilibration. After removal of PBS, albumin–FITC conjugate solution (1 mg mL−1 in PBS) was syringed into channels and then incubated for 1 hour at 37 °C in a dark environment. After incubation, the channels were washed three times with PBS. After drying with nitrogen flow, fluorescence image of each chip was captured by a Sapphire Biomolecular Imager (Azure Biosystems). The settings of the imager were as follows: dye: Alexa 488, intensity: 8, pixel size: 500 μm, scan speed: high, sample type: slide. The same procedure was carried out for different types of chips including: PDMS chips without PDMS–PEG additive and without chemical modification, PDMS–PEG chips without chemical modification, PDMS–PEG chips with chemical modification.2.6 Azide functionalization of magnetic nanoparticles
200 μL of amine iron oxide nanoparticles (25 nm, 10 mg mL−1 in water) were mixed with 800 μL PBS buffer, followed by adding 50 μL of azidoacetic acid NHS ester (50 mM in DMSO). The particles were shaken for 4 hours at room temperature. Then the particles were collected on a strong magnet overnight. After removing supernatant, the particles were resuspended in 1 mL PBS buffer and then loaded onto an M column, washed with 1 mL PBS buffer for 3 times and finally eluted with 300 μL PBS buffer. The functionalized particles (MNP-azide) were stored at 4 °C.2.7 Peptide functionalization of magnetic nanoparticles
The supplied peptide, DBCO-succinyl-VGFYESDVC-NH2, was modified by reacting it to an NHS linker via its terminal cysteine. 5.9 mg (19.15 μmol, 5 eq.) of N-succinimidyl 6-maleimidohexanoate was added to a solution of 5 mg (3.83 μmol, 1 eq.) DBCO-succinyl-VGFYESDVC-NH2 and 2 μL (11.49 μmol, 3 eq.) of DIPEA in 1 mL of dry DMF under N2 atmosphere. After stirring at room temperature for 1 hour, the reaction mixture was poured on 10 mL cold diethyl ether. The precipitated product was centrifuged and subsequently washed 3 times with 5 mL of diethyl ether to afford 6 mg (97%) of a white powder after drying with N2 stream. High-resolution MS (ESI, positive ion mode) [M + H]+, calculated for [C78H95N13O23S]+: 1612.6301, measured: 1612.6322. The lyophilized product was dissolved in dry DMF at a concentration of 50 mM immediately before reaction with the MNPs. 30 μL of this solution was homogenously mixed with 3.75 μL sulfo-Cy3-NHS at 20 mM in dry DMF, targeting a molar ratio of 20:1 (peptide:dye). Immediately after mixing, 600 μL of the MNP stock solution and 400 μL of PBS were added and mixed. The reaction was allowed to proceed on a shaker overnight, and finally washed 3 times with a magnetic separation column (M-column, Miltenyi Biotec). The functionalized particles (MNP-peptide-DBCO) were stored in PBS at an estimated concentration of 3–4 mg mL−1 at 4 °C.
2.8 Immobilization of magnetic particles on chip
Prior to reaction with the chips, the polymer in the channels was allowed to rehydrate overnight in PBS. To immobilize the MNPs in the channels, the channels were gently evacuated with air, and MNP-peptide-DBCO was added from the stock, with each channel requiring approximately 50 μL. After waiting for 1 hour at room temperature, the MNP solution was retrieved from the channels for subsequent use and the channels were rinsed copiously with PBS. To attach the next layer of MNPs in the channels, they were gently evacuated with air and MNP-azide solution was added. After 1 hour at room temperature, the MNP-azide solution was retrieved and the chip was rinsed copiously with PBS. Alternating layers of MNP-peptide-DBCO and MNP-azide were added simply by repeating this cycle up to a total number of 6 cycles of MNP-peptide-DBCO. To make efficient use of MNPs, the solutions were collected and reused each time, taking care never to mix the MNP-azide and MNP-peptide-DBCO directly. After assembling four layers of MNP-peptide-DBCO, a fresh batch of MNP-peptide-DBCO was used for subsequent assembly steps.2.9 Quantification of particle loading and magnetic capture
The mass of magnetic nanoparticles was quantified using a photometric iron test kit (Supelco, 1.14761.0002). Initially, the magnetic nanoparticles were dissolved in 3 M HCl, and the resulting solution was evaporated on a hot plate at 60 °C overnight. The residue was then dissolved in 1 mL of H2O. An appropriate volume of this solution (depending on concentration of iron) was diluted with H2O to a total volume of 5 mL, followed by addition of 3 drops of Fe-1 reagent. After 3 minutes, 200 μL of each sample was transferred in triplicate to a 96-well plate. An absorbance scan for each well was performed using a plate reader (TECAN Spark Multimode Microplate Reader) within the range of 500 nm to 600 nm. Iron standard solutions were assayed for quantification.2.10 Inductive sensing of proteolytic cleavages
Proteases were reconstituted and diluted in proteolysis buffer (30 mM Tris HCl, 5 mM CaCl2, pH 8) and the protein concentration was verified by measuring the protein absorption via a NanoDrop spectrometer (Thermo Fisher Scientific) at 280 nm, applying the estimated extinction coefficients (50585 M−1 cm−1 for chymotrypsin, 36580 M−1 cm−1 for proteinase K and 51715 M−1 cm−1 for pepsin). The chip was equilibrated with proteolysis buffer (flow rate 2 mL h−1) for approximately an hour at room temperature before running the protease solutions (flow rate 2 mL h−1). A 20 V charging voltage on the discharge capacitor with a pulse rate of 33 Hz was applied on the sensor board. The sensor output was continuously recorded on the oscilloscope with 256 averages per trace, requiring approximately 8.5 seconds per measurement. (MATLAB script in Text S1†). Magnetometer signals were acquired with approximate oscilloscope settings of 25 μs per division, 75 μs delay, 1 V per division, and no offset using the 10:1 probes provided with the oscilloscope.
3 Results
3.1 Pulsed field inductive sensor built into printed circuit board
The inductive sensing device developed for this work employed a modular design in order to facilitate prototyping, with the sensor traces and signal amplification circuit implemented on separate circuit boards and joined via coaxial SMA connectors (Fig. 2A). The fluidic chip was designed to sit atop the sensor board, with its serpentine channels located directly above the pulse coil and gradiometer coils built into the printed circuit board. A simplified schematic illustrating the principle of operation of the sensing device is shown in Fig. 2B, with detailed schematics available in Fig. S1–S3.† In brief, a pulse of current is generated by periodic capacitive discharge into the pulse coil, creating field pulses such as the ones shown in Fig. 2C. The amplitude of these pulses can be controlled by setting the capacitor charging voltage, and the duration and frequency of the pulse can be controlled by altering the trigger signal (Fig. S1†). The amplifier board includes mechanisms to finely adjust the balance between the two coils to minimize uncompensated background and amplifies the residual signal by 100 dB (Fig. S2†). The output from the magnetometer is captured by an oscilloscope controlled by a computer (The MATLAB script used is provided in Text S1†).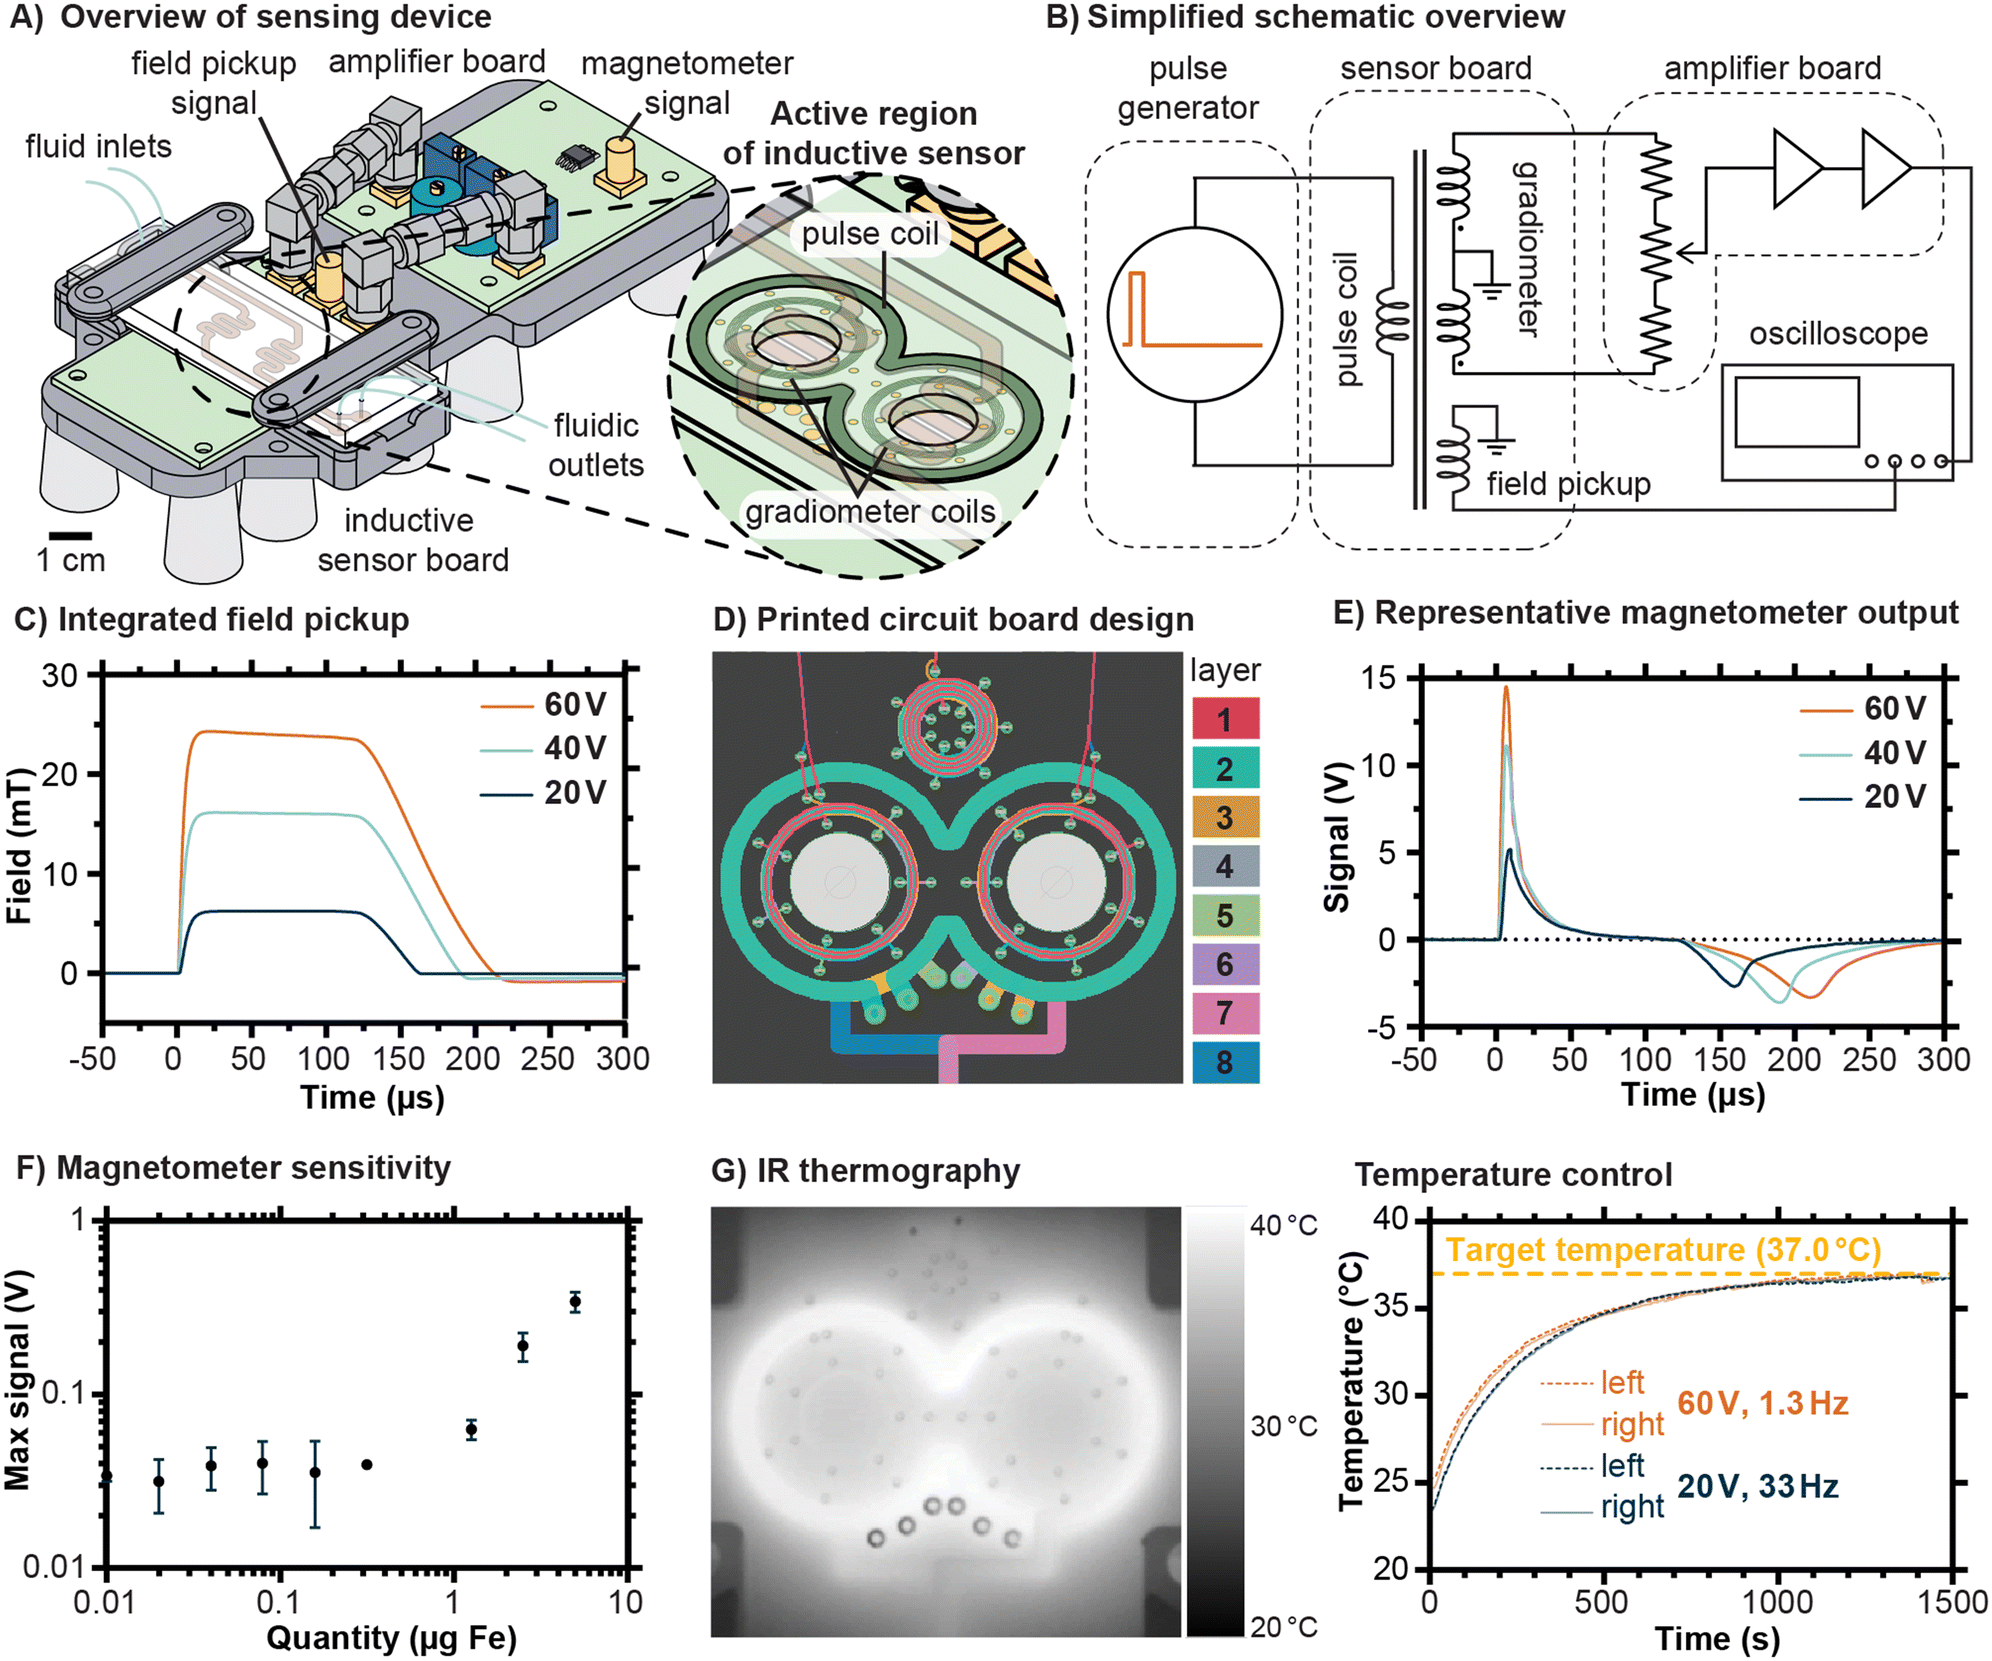 | ||
| Fig. 2 Overview of the magnetic sensor designed to wirelessly detect magnetic nanoparticles bound in a fluidic chip. A) Drawing of device layout, showing the position of the fluidic chip atop a pulse coil and a set of gradiometer coils built into a printed circuit board. The fluidic channels follow a serpentine path above the active area of the sensor. B) A simplified schematic illustrating the principle of operation of the sensing device. A capacitive discharge circuit generates a pulse of current with adjustable amplitude, duration, and duty cycle. The sensor board contains the pulse coil, gradiometer coils, and an inductive pickup coil to measure the field. The voltage generated by the gradiometer is balanced and undergoes dual stage amplification, with the output signal recorded by an oscilloscope. C) Representative examples of field pulses, as determined by integrating signals from the field pickup coil, are shown for various charging voltages in the pulse circuit. D) A detailed view of traces in the 8 layer sensor board shows how coils with multiple turns are formed symmetrically. E) Representative magnetometer outputs are shown for a sample with a concentration of 50 μg mL−1 Fe and volume of 100 μL for the pulses indicated in C). F) A sensitivity analysis suggests a limit of detection of 413 ng (95% confidence interval). G) The temperature of the chip, measured from below via IR thermography (left), is monitored in time as it approaches thermal equilibrium. A plot of temperature versus time (right) indicates how pulse rate or duty cycle can be varied in order to control the equilibrium temperature of the chip, in this case approaching a target temperature of 37 °C. | ||
The design of the 7-turn pulse coil and 14-turn gradiometer coils emphasizes geometric symmetry, as illustrated in the printed circuit board traces shown in Fig. 2D (details in Fig. S3†). In addition, a multilayer spiral acting as an inductive pickup loop is located above the pulse coil (Fig. 2D), producing a signal of sufficient magnitude to be observed directly by the oscilloscope without further amplification. The field versus time curves displayed in Fig. 2C were found by integrating the signal from this field pickup and multiplying by a constant (see Fig. S4† for details). Representative signal outputs from the magnetometer for an Eppendorf tube with 100 μL containing up to a total of 5 μg Fe are shown in Fig. 2E, corresponding to the field pulses shown in Fig. 2C, and exhibiting features expected for magnetic nanoparticles in suspension. The initial peak corresponds to the sample magnetizing in response to the pulsed field and the second negative peak occurs when the sample demagnetizes as the field drops, with the integrated result shown in Fig. S5.† Because the field pulse rises more rapidly than it falls, and due to possible latency in the relaxation of the particles, the second peak is lower than the first. Note that the residual background signal has been subtracted from the curves displayed here, and that an example including the residual background signal is shown in Fig. S6.† To estimate the sensitivity, measurements were conducted on a dilution series of the same type of magnetic nanoparticles later bound to the chips, ultimately suggesting a detection limit of 413 ng (95% confidence interval). For the intended purpose of kinetic monitoring of proteolytic cleavages, the quantity of MNPs should greatly exceed this detection threshold so that changes in the signal are robustly measurable. In interpreting these sensitivity measurements, it should be emphasized that the mass of the peptide substrate is much less than the mass of the MNPs. Estimates of functional groups on the surface of the MNPs using dye labeling and iron quantification suggested about 200 to 300 amine groups per particle, corresponding to a mass ratio of approximately 20 μg substrate per mg of Fe (see Fig. S7†).
Proteases exhibit a range of different optimal temperatures for maximized cleavage efficiency, with human proteases typically functioning most effectively near the physiological temperature of 37 °C. One of the features of the device developed in this work is the possibility to control the temperature experienced within the fluidic channel of the chip simply by varying the rate at which pulses are sent to the sensor board. Higher current pulses necessitate lower pulse rates with correspondingly lower duty cycles to maintain a given temperature. We demonstrated this principle using infrared thermography to monitor the thermal equilibration of chips under exposure to current pulses (Fig. 2G). Using a 60 V charging voltage on the discharge capacitor, which corresponds to pulses of approximately 24 mT, required a low pulse rate of 1.3 Hz to maintain a temperature of 37 °C. By contrast, using a 20 V charging voltage on the discharge capacitor, which corresponds to pulses of approximately 6 mT, allowed a pulse rate of 33 Hz. The allowable duty cycles were thus 0.013% and 0.33% for the 60 V and 20 V pulse settings, respectively. In practice, a trade-off exists between the rate of measurement, which is limited by the pulse rate, and the pulse magnitude. For the experiments described in this work, the lower magnitude pulses were decided to be favorable because they allowed for substantially higher averaging rates and smoother signals.
3.2 On-chip surface modification enables particle binding and reduces protein adsorption
Chemical modification of the glass surface in the chip was an essential step to enable the covalent attachment of MNPs via the substrate peptides. For this purpose, a zwitterionic polymer was selected for on-chip polymerization via ATRP. Thin layers of zwitterionic polymers, in which each monomer contains groups of opposite and equal charge, have been demonstrated for antifouling applications,19–21 as well as for reducing the formation of protein coronas.22 Nonspecific adsorption of proteins to surfaces in the chip is a consideration that could ultimately limit detection sensitivity for proteases or otherwise influence readouts, and thus it was important to engineer the chip to reduce nonspecific adsorption. The adhesion behavior of proteins to polymer brush layers depends on more than just the chemical constituents of a polymer, with physical considerations such as length and grafting density having a pronounced effect.23,24 Polymers grafted from surfaces can typically achieve higher grafting densities compared to those grafted to surfaces,25 and thus we selected a chemical strategy based on on-chip polymerization.Our strategy for chemical modification of the glass surface of the chips is represented in Fig. 3A. After preparation of the glass surface to exhibit hydroxyl groups through treatment with an alkaline solution, a silane-based ATRP initiator was reacted to the surface in ethanol. The subsequent ATRP reaction made use primarily of a zwitterionic monomer suitable for polymerizing sulfobetaine methacrylate (SBMA), but also included a small fraction (9.1%) of glycidyl methacrylate in order to provide additional sites for functional groups that would later be available for covalent linkage to the MNPs. Specifically, both the brominated terminal group of the polymer chain and the epoxide side groups of the glycidyl methacrylate were replaced with azides via a reaction with sodium azide in dimethylformamide.26,27 Azide functionalization is complementary to Cu-catalyzed click chemistry, as well as Cu-free strain promoted cycloaddition, both of which are convenient bioorthogonal reactions that do not limit the scope of natural amino acids that can be employed in the peptide linkers.
 | ||
| Fig. 3 Chemical modification of the fluidic chip to enable cleavage-based protease assays. A) The chemical scheme is shown for the polymerization of poly-SBMA on the glass substrate of the chip, beginning with the grafting of an initiator, proceeding with an atom transfer radical chain reaction, and concluding with the incorporation of azide functional groups. B) Bonding a sulfo-Cy3-alkyne dye to the azide groups via a copper catalyzed click reaction illustrates the presence of azide functional groups and allows for an estimation of the areal density of functional groups. The catalyst was omitted in the control channel. C) A scan of the spatial distribution of FITC-albumin in the channels of a fluidic chip made with unmodified glass and unmodified PDMS illustrates the need to reduce nonspecific protein adsorption. Incorporating a PEG–PDMS block copolymer reduces protein adsorption, and additional zwitterionic polymer functionalization of the glass substrate further reduces protein binding. Estimates of areal protein loading are compared for these three conditions. D) Immobilization of magnetic nanoparticles lightly labelled with Cy3 on the glass. By layering between azide-functionalized and peptide/DBCO functionalized MNPs, additional layers of particles are added. | ||
A subtle visual change was observed following polymerization on the glass of the channels, which afterward appeared translucent and pale yellow in color. In order to validate the presence of the polymer, and in particular to verify the presence of the required functional groups for attachment of the MNPs, we performed a fluorescent dye labelling experiment with a Cu-catalyzed click reaction of the dye sulfo-Cy3-alkyne to the azides in channels containing the polymers (Fig. 3B). As a control, an identically prepared channel was exposed to the same reactants but without the catalyst. By observing spatially resolved fluorescence signals from the dye with a scanner, we found that the test channel contained approximately 6 times higher signal. The areal density of azide functional groups was estimated to be 2500 functional groups per square micrometer, a quantity sufficient for attaching a layer of MNPs.
We next sought to characterize nonspecific protein adhesion behavior inside our fluidic chips by flowing solutions of FITC-albumin through the chip, thoroughly rinsing, and then observing fluorescence signal from the FITC-albumin retained in the chip (Fig. 3C). As a positive control, chips consisting of unmodified PDMS and unmodified glass were considered first, which demonstrated relatively high protein adsorption, estimated at 11.33 μg per square centimeter. Suspecting that much of this adhesion was occurring due to the PDMS, we modified the PDMS through the 0.5 wt% addition of a PDMS–PEG block copolymer, a straightforward method that has been reported to increase the hydrophilicity of PDMS and reduce its protein adhesion.28 This modification alone reduced apparent adhesion of FITC-albumin by more than half. Surface functionalization of the glass with the zwitterionic polymer described above further lowered the adhesion of FITC-albumin to an estimated density of 1.46 μg per square centimeter. Together, the modification of the PDMS and surface modification of the glass appeared to reduce protein adhesion by a factor of 7.8 (Fig. 3C).
To bond MNPs to the chips via peptide linkers, the chemical scheme depicted in Fig. 3D was adopted. The peptide was prepared with an N-hydroxy succinimide (NHS) linker on one side and a dibenzocyclooctyne (DBCO) group on the other (see Fig. S8† for the full structure of the peptide). The NHS group enabled the peptide to react with primary amines on the surface of the MNPs, loading an estimated maximum of 200 to 300 peptides per MNP. Note that the MNPs were simultaneously sparsely dye labelled with sulfo-Cy3-NHS for quantification purposes, with a molar ratio of 20 to 1 for the peptide to the dye. In an analogous reaction, MNPs from the same batch were prepared with azide functionalization via reaction with azido acetic acid NHS ester. Because DBCO readily reacts with azides in the absence of catalysts through strain promoted cycloaddition, it was possible to attach particles in a layer-by-layer fashion to the chip, alternating between peptide-DBCO and azide functionalized MNPs. One of the advantages of this approach is that the MNP solutions can be reused repeatedly if they are carefully recovered from the chips, adding additional magnetic material to form a network crosslinked and anchored by cleavable substrates. Optimization of the loading should ultimately depend on the detection sensitivity of the inductive sensor and the targeted concentration of active protease. The fluorescence signal from the DBCO layers appears to gradually increase after multilayer assembly. For the purpose of the experiments conducted here, 6 DBCO-peptide layers were added for the inductively detected proteolysis described in the next section, leading to approximately 8.7 μg of iron per channel (Fig. S9†).
3.3 Continuous inductive sensing of proteolytic cleavages
Because proteolytic cleavages of the peptide substrate binding the MNPs to the channel are necessary for their release from the chip, we first conducted an experiment to independently assess whether the expected cleavage occurs in the chip. To do this, we reacted a version of our substrate peptide motif terminated by propargylglycines on both sides (Fig. S10†), which enable Cu-catalyzed click reactions to the azides present in the polymerized surface of the chip. Although some degree of crosslinking between neighboring reactive sites on the polymer can be expected with this approach, residual unreacted alkyne bonds can be anticipated, and their presence enabled the subsequent reaction of sulfo-Cy3-azide to the surface (Fig. S10†). One channel was exposed to proteinase K, an aggressive and nonspecific protease, in a buffer in which it would be expected to remain active. As a control, the other channel was exposed to the protease pepsin, prepared in the same buffer with a pH of 8. At low pH, pepsin is also aggressive and nonspecific, but it is inactivated at high pH. As expected, the peptide was cleaved in the channel exposed to proteinase K, indicated by the release of the Cy3, whereas the substrate remained apparently unaffected in the channel exposed to pepsin (Fig. S10†). When fluidic chips prepared as depicted in Fig. 3D were similarly exposed to these proteases under conditions of flow, we found that channels exposed to chymotrypsin released their MNPs, whereas channels exposed to inactivated pepsin did not (Fig. 4A). The results of these experiments together confirm that proteolytic cleavages of the peptide motif occur in the fluidic chips and that they drive the release of the MNPs, as required by our design.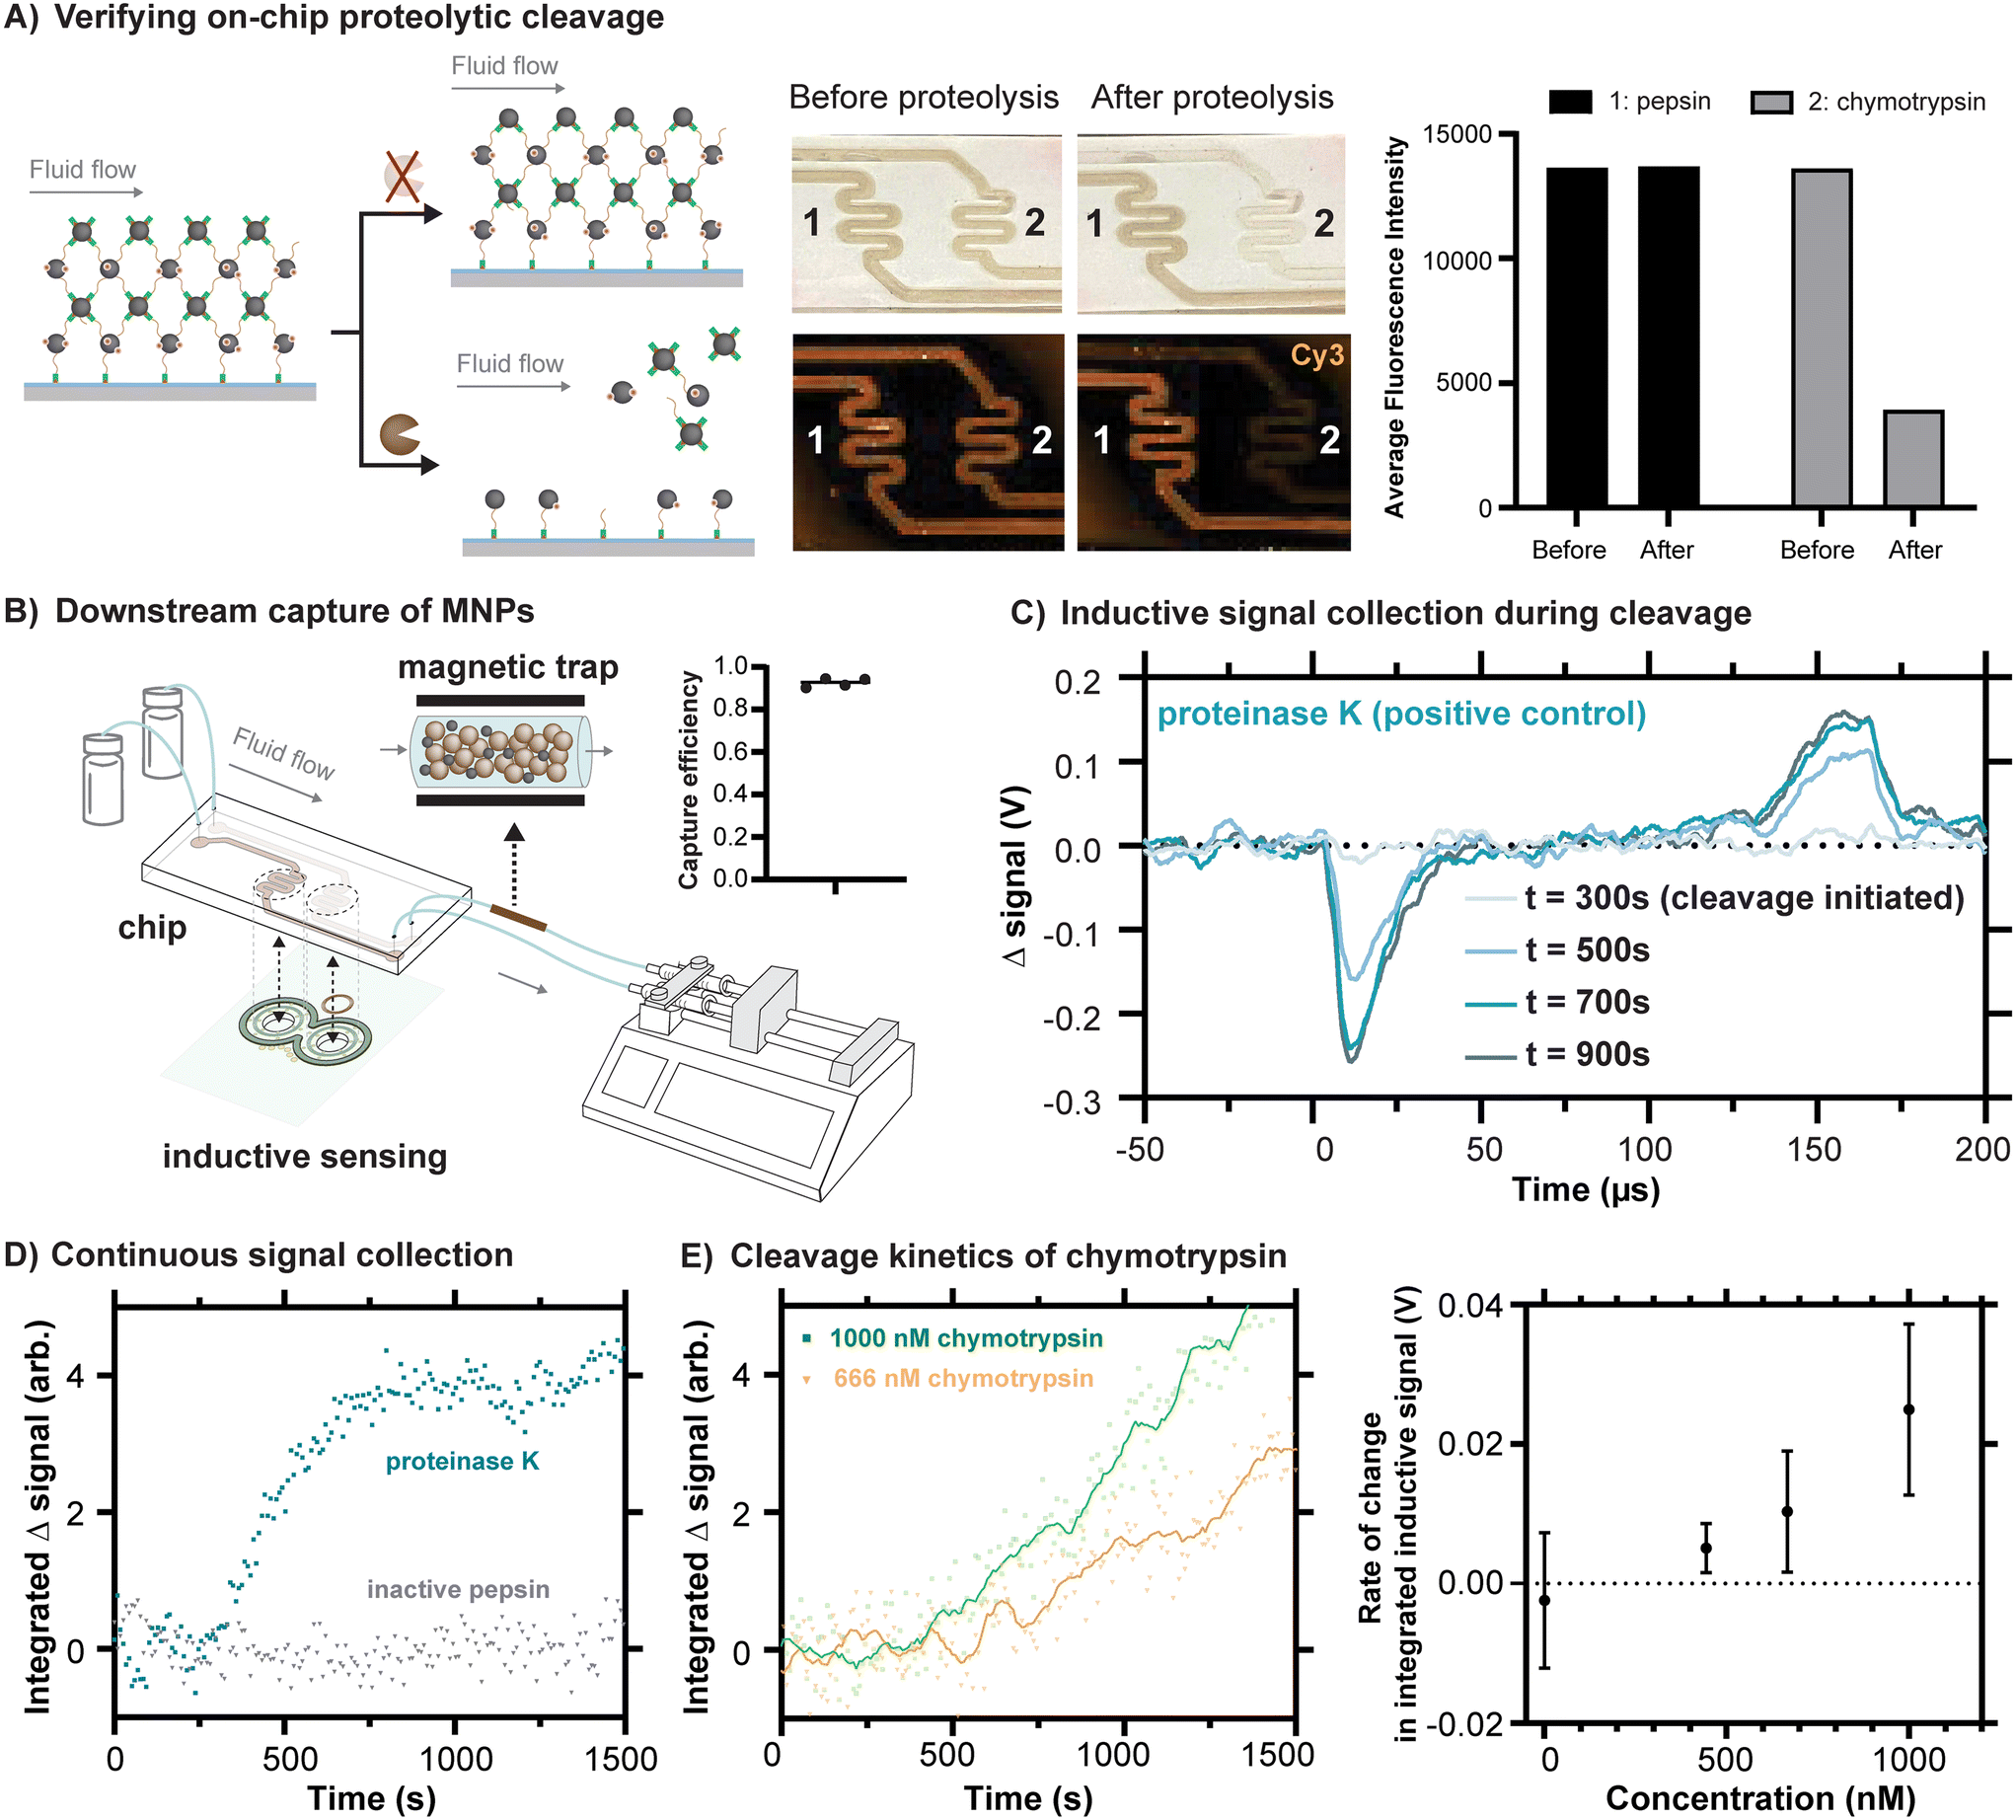 | ||
| Fig. 4 Inductive sensing of proteolytic cleavages inside fluidic devices. A) A representative example of a fluidic chip loaded with sulfo-Cy3 labeled MNPs and linked to the polymer on the glass surface of the chip via DBCO-peptide, both before exposure to chymotrypsin (channel 2) at a concentration of 0.35 mg mL−1 (approximately 14 μM) and after exposure. The decrease in fluorescence is attributable to release of the MNPs. As a negative control, an example is shown with exposure to inactivated pepsin (channel 1). B) The scheme for magnetic capture of released MNPs is shown, based on the inline incorporation of a modified Miltenyi M column. The capture efficiency is estimated using iron quantification of the MNPs trapped in the column versus those reaching the syringe. C) Changes in signal over time are shown for proteinase K as a positive control sample and inactivated pepsin as a negative control. As expected, the changes in signal over time have a shape resembling the representative magnetometer outputs shown in Fig. 2E, an observation consistent with the idea that these changes in signal come from the release of the particles. D) By processing signals collected every 8.5 s, a summary value reveals the kinetic response of the inductive signal over time for proteinase K (3.9 μM) and inactivated pepsin (5.6 μM). E) Chymotrypsin demonstrates a concentration-dependent signal response. Representative time series plots for 1000 nM and 666 nM chymotrypsin are shown. Points represent individual measurements, and solid lines represent the same data after the application of a 2nd order smoothing algorithm (10 neighbors). Rates of change in integrated inductive signal were measured across chymotrypsin concentrations ranging from 1–1000 nM (n = 3, mean ± SD). | ||
One of the advantages of using MNPs for signal readout is the possibility to magnetically capture them downstream. This feature is especially useful in the context of detecting biological contamination of some product or process because it would prevent released MNPs from contaminating the liquid flowed through the chip. To straightforwardly demonstrate the principle, we introduced an inline magnetic trap to retain MNPs after cleavage from the chip based on a modified commercial magnetic separation column (Miltenyi Biotec). Using iron quantification of the MNPs released from the chip, we were able to quantify both the amount of magnetic material released from the chip due to proteolysis and to quantify the fraction that was retained in the trap versus passing through (Fig. 4B). With an appropriate magnetic trap, we were able to capture at least 92.6 percent of the released MNPs (Fig. 4B and S11†).
We next sought to measure the release of MNPs from the chips using our pulsed inductive sensor. The structure of the sensor performs a differential measurement between the gradiometer coils and the corresponding regions of the chip, such that a control solution containing buffer can be flowed through one side and protease can be introduced into the other channel at a known timepoint to observe subsequent signal changes arising from proteolytic cleavages. Because the substantial residual background signal is on the order of volts (Fig. S6†), whereas the anticipated change in signal is on the order of 10 s of mV, it is most useful to consider the change in signal in time, with representative signals shown in Fig. 4C. Proteinase K was once again used as a positive control at a concentration of 3.9 μM and inactivated pepsin at a comparable concentration of 5.6 μM was used as a negative control. For the prior case, in which cleavage is expected, the resulting change in signal has a shape that corresponds with the example signals shown in Fig. 2E. This is consistent with the origin of the signals arising from the detachment of the MNPs.
To monitor proteolytic cleavages continuously over a timescale of 10 s of minutes, a MATLAB script was developed to continuously record the output of the sensor while using relatively high internal averaging of the oscilloscope (256 averages per trace, 8.5 s per measurement). Subsequently, the strongest feature in the signal produced by the MNPs, their initial peak corresponding with the rising edge of the field pulse (Fig. 2C), was integrated to produce a single value summarizing strength of the change in signal. By tracking this value over time, cleavage kinetics can be reconstructed for the tested proteases (Fig. 4D). In agreement with the fluorescence scans of the chips, we see an inductive signal corresponding to the release of MNPs under conditions of cleavage by proteinase K and not under inactivated pepsin. The peptide motif employed here was specifically designed for preferential cleavage by chymotrypsin, a protease with a more selective and well characterized substrate specificity that is used commonly in proteomics.29 The cleavage specificity of the peptide substrate was demonstrated through a FRET assay (Fig. S12†), and the cleavage site was verified by LC-MS (Fig. S13†). As with proteinase K, chymotrypsin produces a cleavage signal, albeit one with slower kinetics at comparable concentrations.
The device developed should ideally not only detect the presence or absence of a specific protease, but also distinguish between varying levels of proteolytic activity. To test whether the device is capable of resolving different rates of cleavage, chymotrypsin was tested under different concentrations. The inductive signal response to chymotrypsin concentrations ranging from 1 nM to 1 μM was measured. The concentration-dependent signal response was quantified by calculating the differences in integrated signal slopes 5 minutes before and after protease introduction, a quantity with units of V referred to as the “rate of change in integrated inductive signal”. Concentration was linearly correlated (R2 = 0.92) with the rate of change in integrated inductive signal in the tested concentration range (Fig. 4E), demonstrating the prototype device's capability to detect protease activity at concentrations in the hundreds of nanomolar. Further improvements in inductive detection sensitivity of the MNPs could further lower the usable concentration range.
Additionally, the performance of the device with complex samples was demonstrated by spiking chymotrypsin in a buffer containing 10% fetal bovine serum. In the channel introduced with 10 μM chymotrypsin, a clear decrease in fluorescence intensity was observed due to the release of MNPs, whereas the control channel with buffer showed no such decrease (Fig. S14†). Analysis of the time-dependent response revealed rates of change in integrated inductive signal of 0.018 V and −0.007 V for the 10 μM chymotrypsin channel and the buffer channel, respectively. These results demonstrate the device's capability to operate in complex samples, including on-chip proteolytic cleavage and real-time inductive detection in the presence of biological matrix components.
4 Conclusions
Here, we have described the design and characterization of a unique inductive sensor for MNPs in which both driving and gradiometer coils are fully incorporated into the traces of a printed circuit board, a design strategy that could eventually make similar sensors suitable for mass production. We developed methods to create fluidic chips that exhibit substantially reduced protein adsorption and that enable the covalent linkage of MNPs via substrate peptides in a layer-by-layer process that loads MNPs efficiently and controls the overall quantity of MNPs loaded. We showed that these MNPs are released upon exposure to both specific and nonspecific proteolytic cleavages, that their departure from the chip can be detected via changes in the inductive signal measured over time, and that the released MNPs can be captured with an in-line magnetic trap. The device offers the advantages of low cost and ease of manufacturing compared to GMR sensors,30 as indicated by an estimated cost analysis of the consumable chips and the sensing device (Tables S1 and S2†). The methods and devices that we have developed in this work could contribute to future low-cost, ubiquitous protease sensors. Ultimately, such sensors could be employed at the point-of-care as medical diagnostic devices or for on-line monitoring of industrial processes susceptible to biological contamination.While the devices presented here show promise, additional development and optimization will be required to make them well suited for conducting robust and useful protease assays. A cleavage profile of a single substrate is almost never sufficient for a diagnostic readout, since proteases often have overlapping cleavage specificity,31 and an ideal device would measure the response of several substrates simultaneously.32 Another approach to enhancing cleavage specificity is incorporating unnatural amino acids into peptide substrates.33 Sensors built into printed circuit boards can be anticipated to allow for further miniaturization and tandem deployment, additional advantages offered by this approach. In order to load MNPs bound by different substrates in the same fluidic chip, it will be necessary to selectively add solutions to different parts of the chip, perhaps with designs that incorporate additional inlets and outlets that are used primarily during on-chip polymerization and particle loading, but sealed off before sample handling. Loading the MNPs only in the regions near the sensors could carry additional benefits for sensitivity, since attaching MNPs along the entire length of the channel results in substrate cleavages that do not directly produce a signal.
Useful protease sensors should also ideally be able to sensitively detect small amounts of proteolytic activity. For instance, chymotrypsin can be detected at pM levels through peptide-induced fluorescence quenching of conjugated polyelectrolytes.34 While it is technically possible using specialized laboratory methods to detect the action of even one individual protease molecule, a useful ubiquitous sensor has more limited needs, probably requiring adequate sensitivity for nM concentrations of protease, depending on its application.35,36 In this work, we tested concentrations in the 100 s of nM and recognize that further optimization is needed. Undoubtedly, one aspect of this device that could be changed to improve its performance is the details of its inductive detection scheme. While the pulsed field allows for low duty cycling with a simple capacitive discharge circuit, it would likely be worthwhile to adopt methods more closely related to conventional MPS or magnetic particle imaging (MPI). Specifically, these methods make use of sinusoidal driving fields that allow for detection of nonlinear contributions of MNPs to the detected inductive signal.37 Because many of the spurious contributions to the background signal vary linearly with the applied field, such as imperfect cancellation or temperature differentials between the gradiometer coils, higher order harmonics provide a robust way to isolate inductive signal contributions from MNPs. In contrast to the approximately μg sensitivity that was determined for our sensor with the pulsed field approach, well-optimized MPI systems with much larger working volumes than our sensor have reported detection limits of as little as several ng of iron.38 Operating our inductive sensor with a large continuous driving current is likely not desirable because it sacrifices control over Joule heating of the board, but some kind of intermediate approach with pulsed oscillating fields may improve performance while maintaining temperature control. Despite the need for further development and optimization, this work represents a solid advance toward creating protease sensors based on inductive sensing, bringing us closer to achieving ubiquitous protease detection.
Data availability
All the raw data supporting this manuscript, scripts used in data analysis, and design files have been uploaded to a data repository and are available at https://doi.org/10.3929/ethz-b-000687208.Author contributions
Conceptualization: M. C., M. V., S. S. Methodology: M. C., F. L., L. S., M. S., M. V., P. P., S. S. Software: L. S., M. C. Formal analysis: F. L., M. C., L. S. Investigation: F. L., M. C., L. S., J. B. Writing – original draft: M. C., F. L. Writing review/editing: all authors visualization: F. L., M. C., L. S. Supervision: S. S., M. C.Conflicts of interest
The authors declare no conflicts of interest.Acknowledgements
Funding for the work described here was provided in part by USZ Innovation Pool grant number INOV00132 from the University Hospital Zurich. F. L. gratefully acknowledges the support of the China Scholarship Council. L. S. gratefully acknowledges support from the Werner Siemens-Foundation Fellowship. M. C. was supported by an ETH Postdoctoral Fellowship during the early stages of work on this project. The authors wish to thank Ines Oberhuber and Lucien R. Stöcklin for their early contributions toward method development for zwitterionic polymer preparation and inductive detection with pulsed magnetic fields, respectively, as part of their Master's studies.Notes and references
- C. López-Otín and J. S. Bond, J. Biol. Chem., 2008, 283, 30433–30437 CrossRef PubMed.
- J. S. Bond, J. Biol. Chem., 2019, 294, 1643–1651 CrossRef CAS PubMed.
- S. N. Kline, Y. Saito and N. K. Archer, DNA Cell Biol., 2024, 1044–5498 Search PubMed.
- C. Morris, Y. S. Lee and S. Yoon, Curr. Opin. Biotechnol., 2021, 71, 105–114 CrossRef CAS PubMed.
- S. Zucker, P. Mancuso, B. DiMassimo, R. M. Lysik, C. Conner and C. L. Wu, Clin. Exp. Metastasis, 1994, 12, 13–23 CrossRef CAS PubMed.
- D. M. Bickett, M. D. Green, J. Berman, M. Dezube, A. S. Howe, P. J. Brown, J. T. Roth and G. M. McGeehan, Anal. Biochem., 1993, 212, 58–64 CrossRef CAS PubMed.
- G. B. Fields, Methods Mol. Biol., 2010, 622, 393–433 CrossRef CAS PubMed.
- K. Welser, R. Adsley, B. M. Moore, W. C. Chan and J. W. Aylott, Analyst, 2011, 136, 29–41 RSC.
- S. Schuerle, J. S. Dudani, M. G. Christiansen, P. Anikeeva and S. N. Bhatia, Nano Lett., 2016, 16, 6303–6310 CrossRef CAS PubMed.
- H. Lee, E. Sun, D. Ham and R. Weissleder, Nat. Med., 2008, 14, 869–874 CrossRef CAS PubMed.
- S. Adem, S. Jain, M. Sveiven, X. Zhou, A. J. O'Donoghue and D. A. Hall, Sci. Rep., 2020, 10, 7941 CrossRef CAS PubMed.
- J.-R. Lee, D. J. Haddon, N. Gupta, J. V. Price, G. M. Credo, V. K. Diep, K. Kim, D. A. Hall, E. C. Baechler, M. Petri and others, ACS Nano, 2016, 10, 10652–10660 CrossRef CAS PubMed.
- P. I. Nikitin, P. M. Vetoshko and T. I. Ksenevich, J. Magn. Magn. Mater., 2007, 311, 445–449 CrossRef CAS.
- H.-J. Krause, N. Wolters, Y. Zhang, A. Offenhäusser, P. Miethe, M. H. F. Meyer, M. Hartmann and M. Keusgen, J. Magn. Magn. Mater., 2007, 311, 436–444 CrossRef CAS.
- P. Vogel, M. A. Rückert, B. Friedrich, R. Tietze, S. Lyer, T. Kampf, T. Hennig, L. Dölken, C. Alexiou and V. C. Behr, Nat. Commun., 2022, 13, 7230 CrossRef CAS PubMed.
- K. Wu, V. K. Chugh, V. D. Krishna, Y. A. Wang, T. D. Gordon, M. C.-J. Cheeran and J.-P. Wang, ACS Appl. Nano Mater., 2022, 5, 17503–17507 CrossRef CAS PubMed.
- E. L. Rösch, R. Sack, M. S. Chowdhury, F. Wolgast, M. Zaborski, F. Ludwig, M. Schilling, T. Viereck, U. Rand and A. Lak, ChemBioChem, 2024, e202400251 CrossRef PubMed.
- S. Gandhi, H. Arami and K. M. Krishnan, Nano Lett., 2016, 16, 3668–3674 CrossRef CAS PubMed.
- Z. Zhang, S. Chen, Y. Chang and S. Jiang, J. Phys. Chem. B, 2006, 110, 10799–10804 CrossRef CAS PubMed.
- Z. Zhang, T. Chao, S. Chen and S. Jiang, Langmuir, 2006, 22, 10072–10077 CrossRef CAS PubMed.
- J. Ladd, Z. Zhang, S. Chen, J. C. Hower and S. Jiang, Biomacromolecules, 2008, 9, 1357–1361 CrossRef CAS PubMed.
- M. Debayle, E. Balloul, F. Dembele, X. Xu, M. Hanafi, F. Ribot, C. Monzel, M. Coppey, A. Fragola, M. Dahan and others, Biomaterials, 2019, 219, 119357 CrossRef CAS PubMed.
- S. Pasche, S. M. De Paul, J. Vörös, N. D. Spencer and M. Textor, Langmuir, 2003, 19, 9216–9225 CrossRef CAS.
- M. Li, S. Jiang, J. Simon, D. Paßlick, M.-L. Frey, M. Wagner, V. Mailänder, D. Crespy and K. Landfester, Nano Lett., 2021, 21, 1591–1598 CrossRef CAS PubMed.
- R. Barbey, L. Lavanant, D. Paripovic, N. Schuwer, C. Sugnaux, S. Tugulu and H.-A. Klok, Chem. Rev., 2009, 109, 5437–5527 CrossRef CAS PubMed.
- V. Coessens and K. Matyjaszewski, J. Macromol. Sci., Part A: Pure Appl. Chem., 1999, 36, 667–679 CrossRef.
- N. V. Tsarevsky, S. A. Bencherif and K. Matyjaszewski, Macromolecules, 2007, 40, 4439–4445 CrossRef CAS.
- A. Gökaltun, Y. B. Kang, M. L. Yarmush, O. B. Usta and A. Asatekin, Sci. Rep., 2019, 9, 7377 CrossRef PubMed.
- S. B. Mortensen, L. Sottrup-Jensen, H. F. Hansen, T. E. Petersen and S. Magnusson, FEBS Lett., 1981, 135, 295–300 CrossRef CAS PubMed.
- J. Choi, A. W. Gani, D. J. B. Bechstein, J.-R. Lee, P. J. Utz and S. X. Wang, Biosens. Bioelectron., 2016, 85, 1–7 CrossRef CAS PubMed.
- B. A. Holt, H. S. Lim, A. Sivakumar, H. Phuengkham, M. Su, M. Tuttle, Y. Xu, H. Liakakos, P. Qiu and G. A. Kwong, Cells Rep. Methods, 2023, 3, 100372 CrossRef CAS PubMed.
- M. A. Miller, L. Barkal, K. Jeng, A. Herrlich, M. Moss, L. G. Griffith and D. A. Lauffenburger, Integr. Biol., 2010, 3, 422–438 CrossRef PubMed.
- P. Kasperkiewicz, M. Poreba, S. J. Snipas, H. Parker, C. C. Winterbourn, G. S. Salvesen and M. Drag, Proc. Natl. Acad. Sci. U. S. A., 2014, 111, 2518–2523 CrossRef CAS PubMed.
- H. Fan, X. Jiang, T. Zhang and Q. Jin, Biosens. Bioelectron., 2012, 34, 221–226 CrossRef CAS PubMed.
- S. G. Dofara, S.-L. Chang and C. Diorio, Anticancer Res., 2020, 40, 3619–3631 CrossRef CAS PubMed.
- D. Kolahreez, L. Ghasemi-Mobarakeh, F. Liebner, F. Alihosseini, F. Quartinello, G. M. Guebitz and D. Ribitsch, Adv. Ther., 2024, 7, 2300396 CrossRef CAS.
- T. Knopp and T. M. Buzug, Magnetic particle imaging: an introduction to imaging principles and scanner instrumentation, Springer Science & Business Media, 2012 Search PubMed.
- M. Graeser, T. Knopp, P. Szwargulski, T. Friedrich, A. Von Gladiß, M. Kaul, K. M. Krishnan, H. Ittrich, G. Adam and T. M. Buzug, Sci. Rep., 2017, 7, 6872 CrossRef PubMed.
Footnotes |
| † Electronic supplementary information (ESI) available. See DOI: https://doi.org/10.1039/d4lc00657g |
| ‡ These authors contributed equally to this work. |
| This journal is © The Royal Society of Chemistry 2025 |