 Open Access Article
Creative Commons Attribution 3.0 Unported Licence
Improving plastic pyrolysis oil quality via an electrochemical process for polymer recycling: a review
César
Catizane
 ,
Ying
Jiang
 * and
Joy
Sumner

School of Water, Energy and Environment, Cranfield University, College Rd, Cranfield, Wharley End, Bedford, UK. E-mail: y.jiang@cranfield.ac.uk
First published on 20th December 2023
Abstract
Electrochemical hydrogenation (ECH) is a novel route for the upgradation of pyrolysis oil from both biomass and plastic feedstocks. Compared with conventional routes, including thermal cracking, ECH can be performed under mild conditions (<80 °C and 1 atm) and without the requirement of additional H2 supply. The successful demonstration of this application can be a critical step to enabling a circular plastic economy and low-carbon fuel production. In this review we provide a critical overview of the recent advancements in understanding the variables that influence the ECH process. In addition, we debate how this technology could be optimized and applied to plastic waste pyrolysis oil, assessing concerns such as the selection of cathode material, which needs to be resilient enough to address the complex nature of bio-oil. In addition, we present ideas on how to circumvent the challenge where the commonly used water-based electrolytes are unlikely to be suitable for pyrolysis oil treatment. Finally, we discuss the possible utilization of this product and scalability of this process.
1 Introduction
With the increasing severity of climate change and global warming, there is a growing recognition for the pressing need to mitigate carbon emissions and other greenhouse gases. To address this environmental challenge, several key international targets and agreements have been stablished, including Agenda 2030 and the Paris agreement. The United Nations’ Agenda 2030 has outlined a set of sustainable development goals (SDGs). These goals encompass the effective management of waste, the preservation of ocean ecosystems, and the urgent undertaking of climate change mitigation efforts.1 Notably, plastic production and utilisation is becoming more prominent in daily life, as it is a material that is utilized in a huge amount of different day-to-day products, increasing plastic pollution, which demands effective and comprehensive solutions. The trend of mismanaged plastic waste is shown in Fig. 1.2,3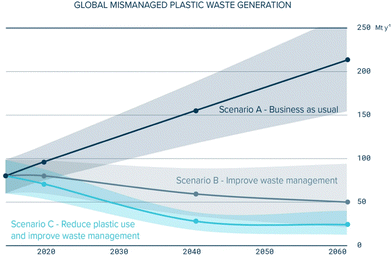 | ||
| Fig. 1 Mismanaged plastic waste trend for three possible scenarios.3 | ||
Many of these plastic products are designed for single-use, often discarded when they are still in pristine condition.2,3 In the EU for instance, in 2020, 29.5 million tonnes of post-consumer waste (PCW) plastics were collected and only 10% was sent to recycling plants, the majority of which via mechanical recycling.4–6 This presents a significant challenge, as most of the plastic waste is either consigned to landfills or incinerated. There is considerable potential for expanding thermochemical recycling processes, with pyrolysis emerging as the most notable option.5 Furthermore, the degradation and depolymerisation of plastic through weathering process leads to the production of micro and nano-plastics. These particles are ingested by animals, thereby being introduced into the food chain, and cause food contamination for both animals and humans.7
Fast pyrolysis is a thermochemical process that occurs in an inert environment, in the range of 450 to 600 °C and can be used for chemical recycling of biomass or plastic.8 This process products are separated into three categories: gas, wax, and oil. The resulting pyrolysis oil is a complex mixture composed of acids, alcohols, aldehydes, esters, ketones, sugars, phenols, guaiacols, syringols, furans, lignin-derived phenols, and extractible terpene with multi-functional groups.9 This is a product that potentially can be utilized as a biofuel, an alternative to petroleum-based fuels, or as feedstock for the chemical industry, which could help the creation of a circular economy10 (Fig. 2).
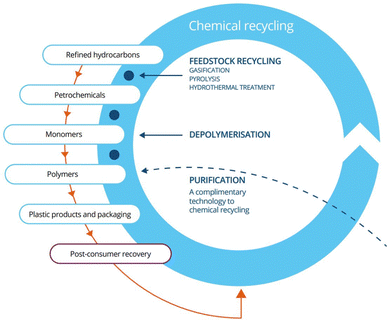 | ||
| Fig. 2 Closed loop life cycle of plastic.11 | ||
Pyrolysis oil, however, usually has a high viscosity, low-density, low pH, high-water content (as high as 15–30 wt%),9 high oxygen-to-carbon (O![[thin space (1/6-em)]](https://www.rsc.org/images/entities/char_2009.gif) :
:![[thin space (1/6-em)]](https://www.rsc.org/images/entities/char_2009.gif) C) ratio and low hydrogen-to-carbon (H
C) ratio and low hydrogen-to-carbon (H![[thin space (1/6-em)]](https://www.rsc.org/images/entities/char_2009.gif) :
:![[thin space (1/6-em)]](https://www.rsc.org/images/entities/char_2009.gif) C) content.12 All these factors make the storage, transport, and utilization of the product more difficult, due to corrosion and instability, as well as lower high heating values (HHV).8 For effective and widespread usage, the pyrolysis oil needs to be upgraded.13
C) content.12 All these factors make the storage, transport, and utilization of the product more difficult, due to corrosion and instability, as well as lower high heating values (HHV).8 For effective and widespread usage, the pyrolysis oil needs to be upgraded.13
2 Pyrolysis oil composition
2.1 Biomass
Biomass is a renewable organic material that comes from plants and animals; its sources include wood, agricultural crops and waste material, municipal solid waste, animal manure and human sewage. Bio-oil, derived from biomass pyrolysis, is a highly intricate mixture whose composition varies with changes in the feedstock, temperature, pressure, residence time and catalysts. Other factors that can lead to different results are pre- and post-treatment of the biomass or the oil.17 Typical physical–chemical properties of the biomass derived bio-oil are summarized in Table 1.13| Property (ASTM standard) | Value (average) |
|---|---|
| C | 56 wt% |
| H | 6 wt% |
| O | 38 wt% |
| N | 0.2 wt% |
| S | 0.02 wt% |
| Water content (D95, E203) | 25 wt% |
| pH acidity (D974, D664, D3339) | 2.5 |
| Specific gravity (density compared to water) | 1.2 |
| High heating value (D240, D4809) | 17 MJ kg−1 |
| Viscosity (D88, D445, D2170) | 40–100 mPa |
| Solids (char content) | 0.10 wt% |
| Density (D1298, D4052) | 1.2 kg L−1 |
Pre-treatment is common practice in the industry in which the biomass goes through several physical–chemical processes before being pyrolyzed, such as torrefaction and trituration.18,19 Pyrolysis oil from a lignocellulosic (Acacia nilotica) raw biomass (PO-RAW) and torrefied biomass (PO-TB) are composed of furan derivatives, phenol derivatives, acids, alcohols, aldehydes, ketones, sugar derivatives, esters, and other compounds. Table 2 summarizes the most abundant species.19
| Compound | Relative content (peak area (%)) | |
|---|---|---|
| PO-TB | PO-RAW | |
| Furan derivatives | ||
| 2-Furancarboxaldehyde | 10.46 | — |
| 2-Furanmethanol | 5.62 | 6.05 |
| 2(3H)-Furanone, 5-methyl | 3.52 | 5.02 |
| 2-Furancarboxaldehyde,-5-methyl | — | 6.45 |
| Phenol derivatives | ||
| Phenol, 2-methoxy | 5.78 | — |
| Phenol, 4-methoxy | — | 8.72 |
| Creosol | 3.84 | 6.05 |
| Phenol, 2,6-dimethoxy | 9.46 | 9.11 |
| 3,5-Dimethoxy-4-hydroxytoluene | 4.63 | 4.61 |
| Phenol, 2,6-dimethoxy-4-(2-propenyl) | 6.68 | 0.82 |
| Acids | ||
| n-Hexadecanoic acid | 0.60 | 0.54 |
| Linoelaidic acid | — | 1.90 |
| Alcohols | ||
| 1-Penten-3-ol | 0.80 | 0.65 |
| 1,2-Benzenediol,3-methyl | — | 2.15 |
| 1-Octen-3-ol,acetate | 0.82 | — |
| Aldehydes | ||
| Benzaldehyde, 4-hydroxy-3-methoxy | — | 0.8 |
| Benzaldehyde, 4-hydroxy-3,5-dimethoxy | 0.64 | 0.64 |
| Ketones | ||
| Alpha, beta-crotonolactone | 2.16 | 2.16 |
| 3-Methylcyclopentane-1,2-dione | 2.86 | 3.93 |
| 6-Methoxycoumaran-7-ol-3-one | 3.61 | — |
| Sugar derivatives | ||
| 1,4:3,6-Dianhydro-alpha-D-glucopyranose | 0.30 | 1.47 |
| Beta.-D-glucopyranose, 1,6-anhydro | — | 6.39 |
| Esters | ||
| 2-(Acetyloxy) ethyl acetate | 0.53 | — |
| Diethyl phthalate | — | 0.55 |
| Di-n-octyl phthalate | 0.35 | 0.31 |
| Other compounds | ||
| 1H-Pyrazole, 3,5-dimethyl | — | 9.34 |
| Benzene, 1,2,3-trimethoxy-5-methyl | 3.18 | 1.91 |
Temperature is a critical factor during the pyrolysis process, significantly affecting product yields and altering the composition of the resulting oil.18,20–23 For example, during the pyrolysis of food waste (FW) and food waste solid digestate (FWSD), increasing the temperature from 500 to 800 °C led to a reduction in oil yield, decreasing from 19.5% to 8.2% for FW and from 15.9% to 8.3% for FWSD. Additionally, the yield of aliphatics in the bio-oil decreased from 18.91% to 16.86% for FW and from 33.78% to 25.64% for FWSD. Notably, as the temperature increased, carbon and hydrogen content in the oil increased, while oxygen content decreased. This desirable outcome for improving the oil stability and fuel quality.22 Rice husk pyrolysis oil composition was also influenced by temperature. Acids concentration varied from 7.07 wt% at 400 °C to 5.69 wt% at 600 °C, although it peaked at 8.46 wt% at 450 °C, ketones presented a similar behaviour, going from 8.65 wt% to 4.14 wt% for the same temperature increase. Aldehydes, phenols and nitrogenated compounds all presented a reduction in the concentration.23 Using a heavy metal contaminated mangrove as the biomass (temperatures range: 300–700 °C) the main compounds found in all cases were phenol derivatives, carboxylic acids, and alcohols. Analysis by GC-MS showed that independently of the temperature, the most abundant alcohol and phenol derivative were methylpropan-1-ol and catechol, respectively, although concentrations varied. The lower temperature (300 °C) led to a higher concentration of 2-methylpropan-1-ol, catechol, syringol and germanicol. For the higher temperatures (500–700 °C), the most abundant compounds were the same ones. A slight variation of the concentration of 2-methylpropan-1-ol and syringol occurred (0.59 and 0.76% variation, respectively), for catechol and germanicol, the lower temperature resulted in a noticeably higher concentration (2.80 and 2.09% variation, respectively).24
Phenol derivatives, lignin derivatives, benzene derivatives, alcohols and carboxylic acids are the main components of bio-oil, and account for the high oxygen concentration and instability of the oil due to low pH, when compared to conventional oils.19,24–27 The viscosity is also highly dependent on the feedstock, as reported by Luo et al.25 when comparing lignocellulosic biomass fast pyrolysis bio-oils. The results of the characterization show a total phenolic, lignin derivative and benzene derivative compound content of 32.26%, 32.36%, 15.78% respectively. All main compounds reported are oxygenated, most of which are aromatics. The results are summarized in Table 3.
| Compound | Relative content (%) |
|---|---|
| Furfural | 9.06 |
| Acetoxyacetone, 1-hydroxyl | 1.21 |
| Furfural, 5-methyl | 1.82 |
| Phenol | 2.55 |
| 2-Cyclopentane-1-one, 3-methyl | 1.58 |
| Benzaldehyde, 2-hydroxyl | 2.70 |
| Phenol, 2-methyl | 5.04 |
| Phenol, 4-methyl | 0.51 |
| Phenol, 2-methoxyl | 0.27 |
| Phenol, 2,4-dimethyl | 9.62 |
| Phenol, 4-ethyl | 2.18 |
| Phenol, 2-methoxy-5-methyl | 4.15 |
| Phenol, 2-methoxy-4-methyl | 0.55 |
| Benzene, 1,2,4-trimethoxyl | 3.80 |
| Phenol, 2,6-dimethyl-4-(1-propenyl) | 4.25 |
| 1,2-Benzenedicarboxylic acid, diisooctyl ester | 1.80 |
| 2-Furanone | 5.70 |
| Levoglucosan | 6.75 |
| Phenol, 2,6-dimethoxy-4-propenyl | 3.14 |
| Furanone, 5-methyl | 0.49 |
| Acetophenone, 1-(4-hydroxy-3-methoxy) | 2.94 |
| Vanillin | 6.35 |
| Benzaldehyde, 3,5-dimethyl-4-hydroxyl | 4.54 |
| Cinnamic aldehyde, 3,5-demethoxy-4-hydroxyl | 2.19 |
Due to its highly complex nature, it is common to separate the bio-oil into hydrophilic, also referred to as water soluble bio-oil (WSBO) and hydrophobic shares. This process can increase the number of quantifiable compounds in the analysis, although it remains difficult to identify all components.26,27 Naturally, the water-soluble fraction presents a higher concentration of water, alcohols, and carboxylic acids, due to their polar nature. Sipila et al. reported that WSBO from straw, pine and ensyn (hardwood) oils show a high water content (19.9, 11.1 and 23.2% respectively), low pH (3.7, 2.6 and 2.8 respectively), and high carboxylic acid concentration (10.80, 7.30 and 6.20% respectively). Acetic and formic acids were the most significant components and the main reason for the low pH of the oils.27 When two commercial wood pyrolysis oils (BTG and Amaron) were separated in water-soluble (WS) and hydrophobic (oil), the authors reported only 34 directly quantifiable compounds, and the main components are shown in Table 4.26
| Compound | BTG oil | Amaron oil | BTG WS | Amaron WS |
|---|---|---|---|---|
| Glycolaldehyde | 5.60 | 1.0 | 16.10 | 2.90 |
| Acetic acid | 3.90 | 5.50 | 0.40 | 0.70 |
| Acetol | 5.60 | 5.50 | 1.30 | 1.20 |
| Levoglucosan | 3.50 | 3.00 | 0.20 | 0.20 |
| Syringaldehyde | 0.10 | 0.10 | 8.10 | 6.80 |
2.2 Plastics
Characterization of plastic pyrolysis oil shows that the composition is highly dependent on the feedstock and other pyrolysis process factors.17 Dyer et al. studied co-pyrolysis of biomass with several types of plastics and reported on the composition of different plastic pyrolysis oils; the results are summarized in Table 5. These results show that PET is one of the main sources of oxygen in plastic waste, both being highly produced plastics (10 wt% of total resin production)4 and having high oxygen composition (32.7%). Although polyolefins (like PE and PP) present a low oxygen concentration, its major role in the plastic production matrix (57 wt% of all resin produced) make it the largest contributor of oxygenated compounds in plastic oil.28| Proximate analysis (wt%) | HDPE | LDPE | PET | PP | PS |
|---|---|---|---|---|---|
| a As received. b Dry. c Dry ash-free (HDPE: high-density polyethylene; LDPE: low-density polyethylene; PET: polyethylene terephthalate; PP: polypropylene; PS: polystyrene).28 | |||||
| Moisture a | 0.0 | 0.0 | 0.0 | 0.0 | 0.0 |
| Ashb | 4.1 | 0.3 | 42.7 | 0.8 | 1.6 |
| Volatilec | 98.1 | 100.0 | 94.6 | 100.0 | 100.0 |
| Fixed carbonc | 1.9 | 0.0 | 5.4 | 0.0 | 0.0 |
| Elemental analysis (%) | |||||
| Cc | 82.5 | 83.3 | 69.0 | 81.0 | 87.8 |
| Hc | 13.1 | 12.6 | 5.0 | 11.4 | 9.5 |
| Oc | 1.8 | 0.7 | 32.7 | 0.6 | 0.0 |
| Nc | 0.1 | 0.1 | 0.0 | 0.1 | 0.0 |
Plastic waste pyrolysis oil usually presents a highly aromatic compound share, when compared to bio-oil, in which can be found monoaromatics, diaromatics, naphthenoaromatics and triaromatics (51.3, 7.5, 5.9 and 2.3 wt% respectively). Some of the main components of the aromatic share of the oil are benzene, toluene, ethylbenzene, xylene, and styrene. The detailed composition of the oil can be found in Table 6.29
| Component | Composition (wt%) |
|---|---|
| Paraffins | 5.0 |
| Iso-paraffins | 8.2 |
| Olefins | 12.3 |
| Aromatics | 67.1 |
The feedstock variation is the main factor in plastic-oil composition In a process treating PET as the feedstock, the resulting pyrolysis oil contains a high concentration of benzene derivatives (10.6 wt%), ketones (5.90 wt%) and acids/esters (62.0 wt%). The most abundant compound in PET pyrolysis oil is benzoic acid and its derivatives, constituting 49.9 wt% of the oil.30 Cit et al. found similar results when comparing polyolefins (PP and LDPE) and PET, where PET pyrolysis oil main components were benzoic acid derivatives (benzoic acid = 23.7, 4-methyl-benzoic acid = 1.6, 4-ethylbenzoic acid = 1.3 and 4-acetylbenzoic acid = 10.3 wt%).31 LDPE pyrolysis oil has a high share of carbon doble bonds, as 39% of its composition are aromatic compounds and other unsaturated carbon molecules.32 A mix of LDPE and HDPE led to naphthalene derivates as the main components (approximately 24 wt%) in the plastic-oil, followed by p-xylene, toluene, naphthalene, benzene, 1-ethyl-4-methyl-benzene, m-xylene, 1,2,4-trimethyl-benzene, indane, indene and 1-methyl-3H-indene (approximately 19, 14, 9, 6, 3.5, 3, 2, 1.5, 1.5 and 1 wt% respectively).33 For PS, monoaromatics are the main components, followed by polyaromatics and aliphatics (77.62, 12.86 and 0.01 wt% respectively). As expected, the main component is styrene (73.60 wt%), other noticeable compounds being 2,4-diphenyl-1-butene (7.80 wt%), 2,4,6-triphenyl-1-hexene (2.21 wt%), α-methylstyrene (1.61 wt%), and toluene (1.58 wt%).34 When conducting a study on the performance of plastic pyrolysis oil as fuel, Kalagaris et al. reported on the composition of the oil. The feedstock was a mixture of styrene butadiene, polyester, clay, ethylene-vinyl acetate, rosin, polyethylene, and polypropylene (47, 26, 12, 7, 6, 1 and 1 wt% respectively). The main components of the oil are presented in Table 7.35
| Compound | Composition (wt%) |
|---|---|
| Xylene | 8.80 |
| Benzene | 5.30 |
| Chlorinated phenols | 4.20 |
| Naphthalene derivatives | 4.10 |
| Cresols | 3.90 |
| Naphthalene | 3.70 |
| Cyclopentene | 2.90 |
| Toluene | 2.70 |
| Benzene derivatives | 1.00 |
| Cyclobutane | 0.90 |
The addition of different feedstocks may also change the composition of the oil; that is, the oil composition of a PS/PP mixture may not be just the sum of PS and PP oils. Many of the components found in PP pyrolysis oil, such as methylnaphthalene (8.4 wt%), xylene (7.8 wt%) and phenanthrene (7.6 wt%), completely disappeared when the feedstocks were mixed. Fig. 3 shows the oil composition for several different feedstock compositions. The ratio of each plastic in each mixture was 50/50%, and in the last mixture (PS, PP, PE and PET) the ratio was 40/20/20/20%, respectively.36
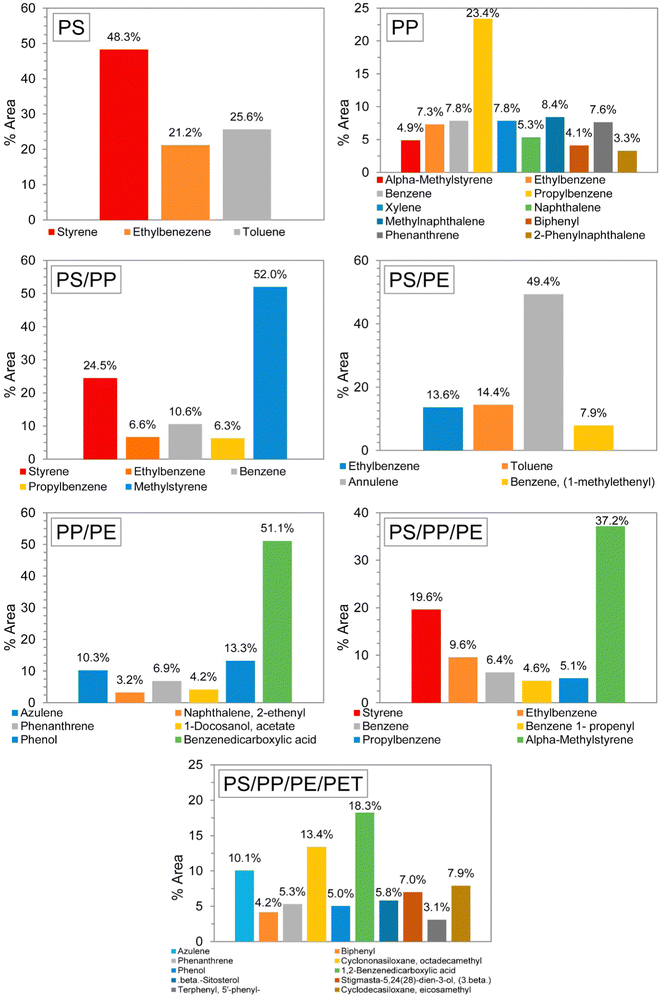 | ||
| Fig. 3 GC-MS results of liquid oils from pyrolysis of different types of plastic wastes. Reprinted with permission from ref. 36 Copyright 2017 Elsevier. | ||
Both temperature and pressure are vital factors in the pyrolysis process. Pyrolysis of LDPE under different conditions (425 °C/1.60 MPa, 450 °C/2.45 MPa and 500 °C/4.31 MPa) led to variation in both the classes of compounds and their concentration. The carbon chain length also changed, significantly reducing at higher temperatures/pressures. Table 8a shows the variation of the macro composition and Table 8b the specific compounds.37
| Composition | 425 °C/1.60 MPa | 450 °C/2.45 Mpa | 500 °C/4.31 Mpa |
|---|---|---|---|
| (a) | |||
| Naphthenes | 2.69 | 5.56 | 1.50 |
| Alkanes | 46.20 | 31.7 | 17.8 |
| Alkenes | 12.40 | 13.1 | 3.58 |
| Aromatics | 12.00 | 22.9 | 68.0 |
| Unknowns | 19.10 | 17.9 | — |
| (b) | |||
| Heptane | 2.26 | 3.16 | 0.46 |
| Toluene | 0.35 | 3.05 | 24.30 |
| Octane | 2.45 | 3.78 | 0.19 |
| Ethylbenzene | 0.25 | 0.89 | 3.06 |
| p/m-Xylene | 0.62 | 1.79 | 3.90 |
| Allylbenzene | 0.21 | 1.02 | 4.84 |
| Methylnaphthalene | 0.90 | 0.36 | 4.22 |
| C21–C30 alkanes | 9.98 | 1.85 | 1.20 |
The same variation can be observed in the pyrolysis of PS (process conditions: 400 °C/1.14 MPa, 425 °C/1.26 MPa, 450 °C/1.47 MPa, and 500 °C/1.60 MPa). Results are summarized in Table 9.
| Compound | 400 °C/1.60 MPa | 425 °C/2.45 MPa | 450 °C/4.31 MPa | 500 °C/4.31 MPa |
|---|---|---|---|---|
| Benzene | 0.38 | 0.73 | 1.27 | 1.63 |
| Toluene | 21.70 | 23.10 | 27.00 | 28.40 |
| Ethylbenzene | 32.60 | 39.30 | 39.00 | 36.60 |
| Styrene | 1.09 | 0.80 | 0.39 | 0.61 |
| Cumene | 10.20 | 9.10 | 9.36 | 9.60 |
| Propylbenzene | 0.60 | 0.77 | 0.90 | 1.29 |
| Methylstyrene | 1.37 | 0.39 | 0.33 | 0.55 |
| Diphenylmethane | 0.91 | 0.83 | 1.00 | 1.61 |
| 1,2-Diphenylethane | 1.44 | 1.16 | 0.60 | 0.37 |
| Phenylnaphthalene | 0.98 | 1.02 | 1.01 | 1.25 |
| 1,2-Diphenylbenzene | 1.27 | 1.26 | 1.87 | 1.89 |
| Triphenylbenzene | 6.30 | 5.13 | 3.83 | 3.18 |
Long chain alkanes and alkenes are common products in plastic-oil, and the carbon chain lengths can reach as high as 55 carbons (C55) when the feedstock is a mixture of PP, LDPE, HDPE and styrene.14,15 The carbon number range of alkanes (Table 10a) and alkenes (Table 10b) are as follows:
| Feedstock | C11–C20 | C21–C30 | C31–C40 | C41–C50 |
|---|---|---|---|---|
| (a) | ||||
| Polypropylene | 2 | 63 | 0 | 0 |
| LDPE | 6 | 54 | 12 | 13 |
| HDPE | 1 | 67 | 18 | 0 |
| Styrene | 0 | 4 | 27 | 8 |
| (b) | ||||
| Polypropylene | 9.9 | 8.9 | 0 | 0 |
| LDPE | 3.3 | 4.2 | 0 | 0.8 |
| HDPE | 0.5 | 6.2 | 1 | 1 |
| Styrene | 0 | 0 | 0 | 10 |
Plastic waste (polyethylene film and mixed polyolefin) pyrolysis oils blended with fossil naphtha led to an even higher carbon number range. For polyethylene film (PE-film), was C5–C55 and for mixed polyolefin (MPO) was C5–C52. The composition groups of the resulting pyrolysis oils consisted of paraffins, iso-paraffins, α-olefins, iso-olefins, diolefins, naphthenes, monoaromatics and naphthenoaromatics.15 Both oils also present a substantial amount of several halogen and metal contaminants, among which are found Cl, Br, Al, Ca, Cr, Cu, Fe, Li, Na, Ni, Sb, Si, Sr and Zn. Both Cl and Br can be explained from the initial composition of the feedstock, as polyvinyl chloride (PVC) is a common plastic and bromine is an element that is used in fire retardants. Metal contamination can be traced to plastic enhancers, as metals are commonly used as additives.15 The detailed composition of the plastic-oil and the distribution of paraffins, olefins, naphthenes and aromatics over the light, medium and heavy product fractions of all post-consumer plastic waste pyrolysis oils can be found in Table 11.16
| (a) | ||
|---|---|---|
| Composition | MPO pyrolysis oil | PE-film pyrolysis oil |
| a Carbon number up to C20 and boiling point up to 250 °C. b Carbon number up to C30 and boiling point up to 450 °C. c Carbon number >C30 and FBP >450 °C.16 | ||
| Paraffins | 32.2 | 41.9 |
| Iso-paraffins | 3.7 | 3.5 |
| α-Olefins | 23.5 | 33.0 |
| Diolefins | 5.3 | 4.5 |
| Naphthenes | 12.4 | 5.5 |
| Monoaromatics | 2.7 | 1.0 |
| Naphthenoaromatics | 0.2 | 0.1 |
2.3 Pyrolysis oil comparison
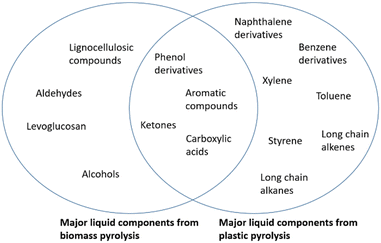
Although both biomass pyrolysis oil (bio-oil) and plastic pyrolysis oil (plastic-oil) share common components such as paraffins, olefins, aromatics, and oxygenated compounds, they exhibit significant differences in their composition. Notably, bio-oil water content is much higher than plastic oil.8,12,14–16 On the other hand, plastic-oil presents a higher aromatic share, longer carbon chains and various metal contaminants, added during its production as stabilizers and colouring, for example. The presence of long chain alkanes and alkanes in plastic-oil can lead to a heavier and more viscous product and is a factor that will affect the upgradation process, making it slower.15For utilization as biofuel, HHV is a vital factor. Bio-oil has a lacklustre HHV when compared to transportation fuels (bio-oil HHV: 13–19 MJ kg−1 compared to gasoline: 44–46 MJ kg−1 or coal: 25–35 MJ kg−1). Plastic-oil, on the other hand, presents a high HHV (41–47 MJ kg−1).8
The main components from both bio and plastic oil are summarized in Fig. 4.
3 Upgrading routes
Bio and plastic oils usually present subpar physical–chemical properties when compared to traditional fuels, such as acidity, O![[thin space (1/6-em)]](https://www.rsc.org/images/entities/char_2009.gif) :
:![[thin space (1/6-em)]](https://www.rsc.org/images/entities/char_2009.gif) C and H
C and H![[thin space (1/6-em)]](https://www.rsc.org/images/entities/char_2009.gif) :
:![[thin space (1/6-em)]](https://www.rsc.org/images/entities/char_2009.gif) C ratios and, for bio-oils, low HHV. This means that for its utilization as an alternative fuel, an upgradation process is necessary. The same is true when it comes to recycling, where these products need to be upgraded to be utilized as feedstock for the petrochemical or chemical industries. Several processes for bio-oil upgradation have been the focus of many studies throughout the years.9,10,13,38–50 The most common method is deoxygenation, which is commonly accomplished through catalytic cracking and hydroprocessing routes such as hydrotreatment and hydrodeoxygenation.38
C ratios and, for bio-oils, low HHV. This means that for its utilization as an alternative fuel, an upgradation process is necessary. The same is true when it comes to recycling, where these products need to be upgraded to be utilized as feedstock for the petrochemical or chemical industries. Several processes for bio-oil upgradation have been the focus of many studies throughout the years.9,10,13,38–50 The most common method is deoxygenation, which is commonly accomplished through catalytic cracking and hydroprocessing routes such as hydrotreatment and hydrodeoxygenation.38
Upgrading routes can be separated into chemical (hydrotreatment, catalytic cracking, hydrocracking, steam reforming, hydrodeoxygenation and hydrogenation) and physical (distillation, supercritical fluid extraction, liquid–liquid extraction, and emulsification) processing. There are several advantages and disadvantages of each upgrading route; some of the disadvantages of the more traditional routes are the operational conditions, high costs and coke production. Catalytic cracking is accomplished at medium temperature and atmospheric pressure, but it leads to catalyst deactivation and the formation of carbon double bonds, which would require further improvement.51 Decarbonylation and decarboxylation leads to the loss of valuable carbon. Hydrocracking, hydrodeoxygenation, and hydrogenation require an outside source of H2, which is costly and difficult to store (see Fig. 5).43,44
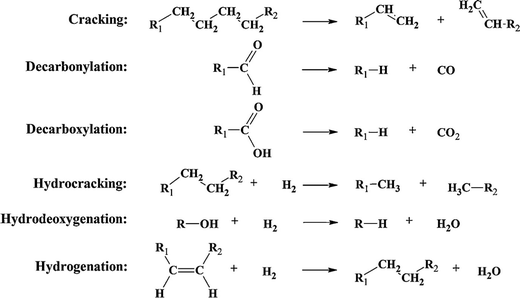 | ||
| Fig. 5 Examples of reactions associated with catalytic bio-oil upgradation. Reprinted with permission from ref. 44 Copyright 2011 Elsevier Inc. | ||
3.1 Electrochemical hydrogenation
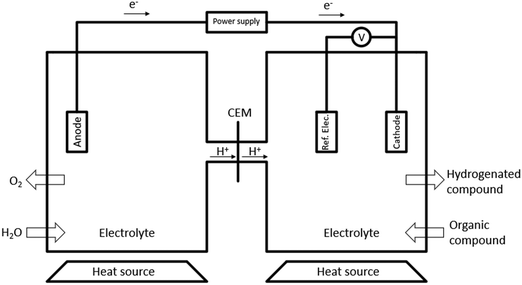
One recently emerging route for pyrolysis oil upgradation is electrochemical processing. Electrochemical hydrogenation (ECH) does not require H2 from an outside source, which is produced during the process, reducing costs, and mitigating the risks associated with H2 storage.18,39,51 Most setups for ECH consist of two chambers separated by a cathode exchange membrane (CEM). The most prevalent cell design is H-type cells (Fig. 6), although there are some studies utilizing flow type cells.40,52,53During ECH, water is oxidised at the anode (eqn (1)), the resulting H+, that can flow through a cation exchange membrane into the cathode cell. The H+ is then chemisorbed by the catalytic cathode (eqn (2)), where M is the metal surface and H(ads)M is the chemisorbed hydrogen.54,55
 | (1) |
| H(aq)+ + e− + M ↔ H(ads)M | (2) |
In the cathode chamber, the organic unsaturated compound is chemisorbed onto the cathode (eqn (3)), where the hydrogenation process occurs (eqn (4)), followed by the desorption of the stabilized product (eqn (5)). Eqn (6) is the net reaction.54,55
| (Y = Z)aq + S ↔ (Y = Z)(ads)S | (3) |
| 2H(ads)M + (Y = Z)(ads)S ↔ (YH–ZH)(ads)S + 2 M | (4) |
| (YH–ZH)(ads)S ↔ (YH–ZH)(aq) + S | (5) |
| Unsaturated compound + nH+ + ne−1 ↔ stabilized product | (6) |
| 2(H(ads)M) ↔ 2H2 + 2 M | (7) |
| H(ads)M + H(aq)+ + e− ↔ H2 + M | (8) |
ECH can be performed under mild conditions (<80 °C and 1 atm) (Table 12). Lower temperatures can also avoid catalyst deactivation by coke formation and membrane fouling, potentially reducing the costs associated with catalyst purchase and recycle.56 However, due to high viscosity and low conductivity, it requires the utilization of membranes, catalysts, and electrolytes to facilitate the reaction.10,13,38,39 That leads to a vast spectrum of different arrangements that can be organized to optimize the process.
| Method | T (°C) | P (bar) | H2 need |
|---|---|---|---|
| Cracking | 330–700 | 1.0 | No |
| Hydrocracking | >400 | 68–96 | Yes |
| Hydrodeoxygenation | 300–600 | 80–300 | Yes |
| Electrochemical hydrogenation | <80 | ≈1 | No |
 | (9) |
This equation can also be simplified:
 | (10) |
 | (11) |
 | (12) |
 | (13) |
3.2 ECH reactor design considerations
The choice of cathode can greatly interfere with the process, as early transition metals (e.g. Ti, Mn, Nb) and platinum group metals (Ru, Rh, Ir, and Pt) have higher affinity toward hydrogen formation, leading to more H+ in solution, which increases collision probability and, in turn, leads to higher conversion rates.51 Cathode surface coverage (or adsorption rate) can lead to the same problem of low collision probability, and is dependent on cathode/compound pairing, for example, the adsorption of phenol on Pt is stronger compared to guaiacol.42,62
Cathode selection can also influence the selectivity of the process and the desirable product yield. For the ECH of glucose, late transition metals (e.g. Fe, Cu, Pd, Ag and Au) led to higher sorbitol formation and post-transition metals (In, Sn, Sb, Pb, and Bi), Zn and Cd (d metals) favoured d 2-deoxysorbitol formation. Ni had the lowest and Pb the highest sorbitol formation potential.63
Platinum group metals (Pt, Pb, Ru, Rh and Ir) are commonly used in hydrogenation processes, due their stability and high affinity towards hydrogen production and have been employed under several conditions and for different compound classes.63 For the ECH of indigo, a highly unsaturated compound that contains both oxygen and nitrogen (reaction conditions: 1 M NaOH, 50 °C, 20 mA cm−2) using RANEY® nickel electrodes doped with different noble metal catalysts (Pt, Pd and Pd/C), Pt coating led to both optimal conversion and FE (10.2 and 8.16% respectively), followed by Pd (8.6, 6.88%), Pd/C (4.7, 3.76%) and RANEY® nickel without coating (4.4, 3.5%).64 Nobel metals are also capable of hydrogenating phenolic compounds at high conversion rates and FE. ECH of phenol on several cathodes (Pt/C, Rh/C, and Pd/C) demonstrated that Rh/C exhibited the highest hydrogenation rate, the order was Rh/C > Pt/C > Pd/C.65 Du et al. reported on the ECH of phenol on several different electrocatalysts: Pt, Ru, Pt3Ru, Pt3Sn, Ru3Sn, and Pt3RuSn supported on carbon cloth (reaction conditions: 0.2 M H2SO4 containing 10 mM phenol at −100 mA, 50 °C for 100 min). Pt3Ru/CC presented the highest conversion rate, at 96.3%, followed by Pt3RuSn/CC and Pt/CC (91.5 and 90.2% respectively).66 The concentration of the metal on the surface of the carbon can also lead to different results, although graphite alone was unable to react (reaction conditions: phenol, electrolyte 0.1 mol L−1 H2SO4 (30 mL), 30 mA, Pt sheet as the anode). 1% Pt/G and 1.5% Pt/G presented the highest conversion rates, both 95%. The highest yield of cyclohexane and the highest FE were 30.4% and 20.3%, respectively, both occurred with the same cathode (1.5% Pt/G). The results are summarized in Table 13.55 As shown in previous sections, lignin pyrolysis oil can contain phenolic compounds (phenol, p-cresol, 4-ethylphenol, and 4-propylphenol, as well as guaiacol) which can be hydrogenated into their corresponding alkylcyclohexanols at high conversion rates using Ru/ACC as the catalytic cathode. The same cathode is effective for transforming model lignin monomers into cyclohexanol.56
| Cathode | Conversion (%) | F.E. | 1 | 2 | 3 | 4 |
|---|---|---|---|---|---|---|
| Where [1] is cyclohexane, [2] cyclohexanol, [3] cyclohexanone and [4] benzene. | ||||||
| Pt | 0 | 0 | 0 | 0 | 0 | 0 |
| Ni/G | 0 | 0 | 0 | 0 | 0 | 0 |
| Rh/G | 90 | 0 | 0 | 65.7 | 24.3 | 0 |
| Pd/G | 18 | 0 | 0 | 12.6 | 5.4 | 0 |
| 0.5% Pt/G | 92 | 11.1 | 16.6 | 57 | 12 | 5.5 |
| 1% Pt/G | 95 | 15.2 | 22.8 | 52.3 | 16.2 | 3.8 |
| 1.5% Pt/G | 95 | 20.3 | 30.4 | 58.9 | 5.7 | 0 |
| 2% Pt/G | 90 | 9.1 | 13.5 | 60.3 | 9 | 7.2 |
| Graphite | 0 | 0 | 0 | 0 | 0 | 0 |
Metals outside the platinum group can also be utilized as the catalytic cathode, although it still requires more investigation. The ECH of guaiacol and related lignin models utilizing a nickel cathode and a Co/phosphate anode presented high selectivity towards cyclohexanol formation (>99%), with only traces of 2-methoxycyclohexanol. Other experiments were done utilizing cobalt and copper as catalyst cathodes, and only Co formed trace amounts of cyclohexanol and phenol, Cu completely failed in producing these products.58 The ECH of aldehyde compounds shows that aromatic aldehydes have a higher conversion rate than aliphatic aldehydes. Au, Ag, Cu, and C catalysts exhibit the highest conversion to alcohol products.67
Electrolytes are needed during ECH to increase the conductivity of the system, although they can interfere with the process. Acids, alkalis, and salts can achieve these results, and the selection of electrolytes should take into consideration both the organic compound and the cathode. Another challenge during this selection is that the electrolyte that presents the highest conversion rate and the one that leads to the highest FE might not be the same one. For the ECH of guaiacol (reaction conditions: 3-CE-NH3 cathode, 80 °C and 100 mA), the conversion rates, FE and product selectivity varied greatly. The highest conversion rates were NaOH (62 ± 2.4%), NaCl (64 ± 8.8%), and HCl (75 ± 3.9%). For FE, the order was NaCl (20 ± 2.2%) < NaOH (28 ± 1.0%) < HCl (30 ± 4.3%). Similar results were reported for phenol and syringol.39 The pH of the system can interfere with the results, as demonstrated by the ECH of guaiacol where HClO4 as the electrolyte led to the highest guaiacol conversion rates, HCl and H2SO4 led to moderate conversion rates (PtNiB/CMK-3 cathode, 0.2 M HClO4, 0.2 M HCl and 0.2 M H2SO4 as electrolytes). In addition, HClO4 achieved optimal selectivity for the desirable product (KA oil). However, increasing the concentration of sulfuric acid from 0.2 M to 0.5 M reduced the ECH activity.42
Different catholyte/anolyte pairings can also lead to vastly different results. Acid/acid pair (catholyte/anolyte respectively) lead to higher guaiacol conversion. (Conditions: T = 50 °C, I = 300 mA (j = −109 mA cm−2), catalyst = 5 wt% Pt/C (0.133 g), reaction time = 2 h, concentration of all electrolytes = 0.2 M) followed by salt/acid and acid/alkali. Alkali/acid completely failed in generating products. ECH of phenol led to similar results.62
| Cathode | Feedstock | Conversion | Electrolyte | Temperature (°C) | J (mA cm−2) | F.E. | Duration (h) | Ref. |
|---|---|---|---|---|---|---|---|---|
| a Reported as mA. | ||||||||
| Ru/ACC | Guaiacol | 64 ± 8.8 | NaCl | 20 ± 2.2 | ||||
| 75 ± 3.9 | HCl | 80 | 100a | 30 ± 4.3 | 2 | 39 | ||
| Phenol | 89 | HCl | 29 | |||||
| Syringol | 58 | HCl | 29 | |||||
| PtNiB/CMK-3 | Guaiacol | >99% | HClO4 | 60 | 20a | 86.2 | 2 | 42 |
| RANEY®-Ni | Guaiacol | >99% | BK3O3 | 75 | 8 | 26 | 6 | 58 |
| Ru/ACC | Phenol | 100 | 20 | 4 | ||||
| 4-Methylphenol | 100 | HCl | 80 | 100a | 9 | 56 | ||
| 4-Ethylphenol | 98 | 9 | 6 | |||||
| 4-Proprylphenol | 100 | 6 | ||||||
| RANEY®-Ni | 4.4 | 3.5 | 64 | |||||
| RANEY®-Ni with Pt | Indigo | 10.2 | NaOH | 50 | 20 | 8.16 | — | |
| RANEY®-Ni with Pd | 8.6 | 6.88 | ||||||
| RANEY®-Ni with Pd/C | 4.7 | 3.76 | ||||||
| Iron | Furfural | 97 ± 1.4 | NH4Cl | — | 6 | 29 ± 3.5 | 5 | 54 |
| Pt/CC | 90.2 | 34.6 | ||||||
| Ru/CC | 73.4 | 28.2 | ||||||
| Pt3Ru/CC | Phenol | 96.3 | H2SO4 | 50 | 100a | 37.6 | 1.67 | 66 |
| Pt3Sn/CC | 73.3 | 29.7 | ||||||
| Ru3Sn/CC | 62.3 | 26.7 | ||||||
| Pt3RuSn/CC | 91.5 | 39.5 | ||||||
| Feedstock | Cathode | Catholyte | Anode | Anolyte | T (°C) | Duration (h) | J (mA cm−2) | Ref. |
|---|---|---|---|---|---|---|---|---|
| a Reported as mA. | ||||||||
| Guaiacol | Boron-doped PtNiB/ordered mesoporous carbon (CMK-3) | 0.2 M HClO4 | IrO2/C | 0.2 M HClO4 | 60 | 5 | 40a | 42 |
| Phenol derivatives | Ru/ACC | 0.2 M HCl | Pt wire | 0.2 M phosphate | 80 | — | 100a | 56 |
| WSBO | Ru/ACC | 0.2 M NaCl | Pt wire | 1 M H2SO4 | 27 | 6.5 | 480a | 72 |
| WSBO | Ru nanoparticles on mesoporous carbon–Ru@OMC | WSBO | Fe(III)/Fe(II) + carbon felt | Wastewater or lignin | — | 3 | — | 41 |
| Resin wood (ponderosa pine) bio-oil | Metal-free (carbon) | 1 M Na2SO4 | Ti sheets/Pt coating | Purified water | 35(±2) | — | — | 40 |
4 ECH systems for model compound and bio-oil upgradation
4.1 Model compounds
Zhou et al. proposed a new catalyst for electrocatalytic hydrogenation (ECH) of guaiacol, a boron-doped PtNiB/ordered mesoporous carbon (CMK-3) cathode on a Nafion 117 membrane and IrO2/C as the anode. The goal was the production of KA oil (a mixture of cyclohexanol and cyclohexanone) which is highly utilized as industrial feedstock.42 The working temperature was 60 °C. The anolyte was 10 mL 0.2 M HClO4 and catholyte was 10 mL 0.2 M HClO4 with 10 mM guaiacol. The flow rate was 50 mL min−1. Constant current of 20 mA for 2 h. The setup is shown in Fig. 7.42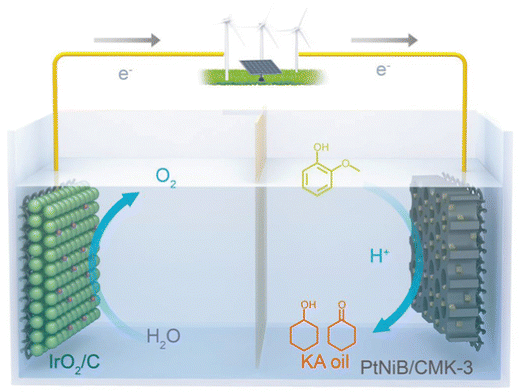 | ||
| Fig. 7 Schematic of ECH of guaiacol into KA oil integrated with O2 production, equipped with PtNiB/CMK-3 and IrO2/C as the cathode and anode, respectively. Reprinted with permission from ref. 42 Copyright 2019 Wiley. | ||
Faradaic efficiency (FE) of the process was 86.2%, in comparison to the 6.3% that was found when the reaction was carried out in a PtNi/CMK-3 cathode, that is, without boron doping. The conversion rate was respectively <99.0% and 11.7%. The study also reported on the ECH of other phenolic compounds using PtNiB/CMK-3. All achieved high (<95%) conversion rates and high (<80%) FE. The temperature increase effect on conversion rate and FE on range of 20–60 °C was positive (conversion rate: from 58% to 98.9% and FE: from 45% to 86.2%), but further heating to 80 °C reduced these parameters to 78% and 57% respectively42 (Fig. 8).
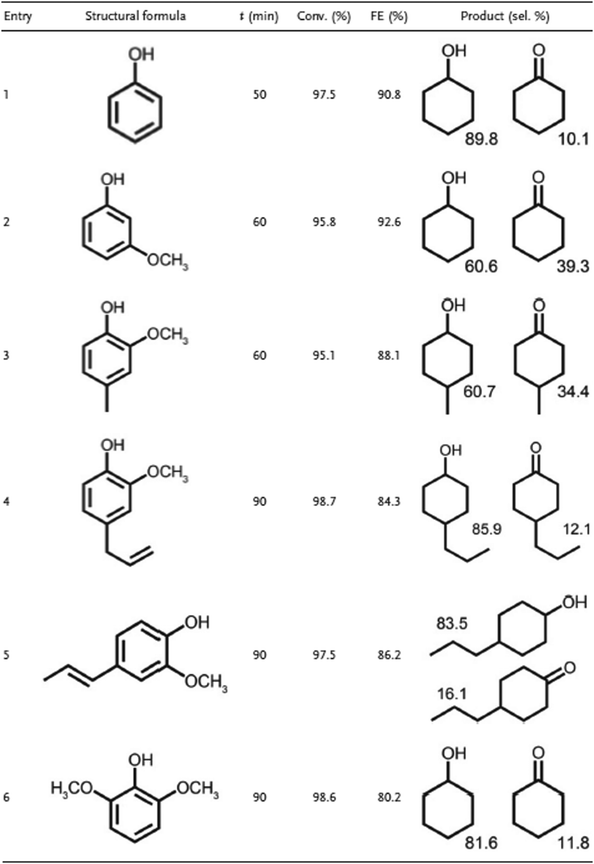 | ||
| Fig. 8 ECH of other phenolic compounds using PtNiB/CMK-3. Reprinted with permission from ref. 42 Copyright 2019 Wiley. | ||
Garedew et al. studied the ECH of phenolic compounds. Several model compounds were selected, including catechol, anisole, phenol, guaiacol, 3-methoxyphenol, 4-methoxyphenol, syringol, 1,3-dimethoxybenzene, o-cresol, m-cresol, p-cresol, creosol, vanillin, syringaldehyde, eugenol, 4-ethylphenol, 4-propylphenol, 4-propylguaiacol and 4-ethylguaiacol.56
The cell setup was a H cell, separated by a Nafion 117 membrane. The cathode was Ru/ACC and the anode a Pt wire. Catholyte was a 0.2 M HCl solution (30 mL) and the anolyte a 0.2 M phosphate buffer (30 mL). Temperature was maintained at 80 °C and the experiment was run at 100 mA. The cell setup is shown on Fig. 9.56
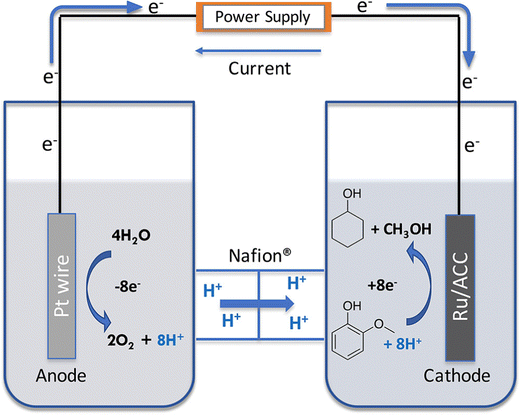 | ||
| Fig. 9 Electrocatalytic hydrogenation in a two-chambered H cell. Reprinted with permission from ref. 56. Copyright 2019 American Chemical Society. | ||
The authors reported that increasing guaiacol concentration from 5 to 20 mM increased the FE and product selectivity. Further increases from 20 to 60 mM had led to a steep decline in the conversion rate, although this was mitigated by increasing the duration of the process (Fig. 10).
Phenol, p-cresol, 4-ethylphenol, and 4-propylphenol, as well as guaiacol, were transformed into their corresponding alkylcyclohexanols at high conversion rates (>98%). Carbon chain length was a determinant factor in reaction speed, as increased lengths resulted in slower conversions.56
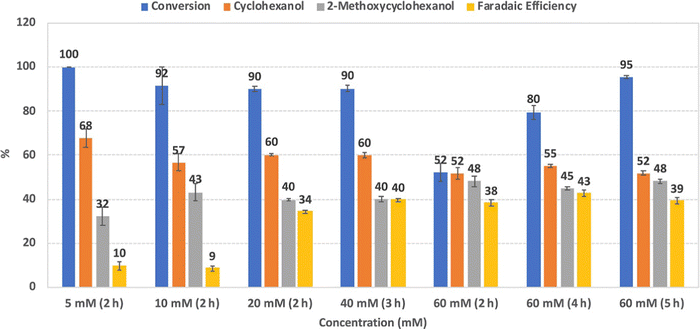 | ||
| Fig. 10 Conversion, product selectivity, and faradaic efficiency of guaiacol reduction using different substrate concentrations (5, 10, 20, 40, and 60 mM) at 100 mA and 80 °C. Error bars are standard error. Reprinted with permission from ref. 56. Copyright 2019 American Chemical Society. | ||
4.2 Water soluble bio-oil (WSBO)
Li et al. proposed ruthenium (Ru) supported on activated carbon cloth (ACC) as the catalytic cathode as the electrocatalyst. The bio-oil was mixed with water, in water to bio-oil ratio of 4![[thin space (1/6-em)]](https://www.rsc.org/images/entities/char_2009.gif) :
:![[thin space (1/6-em)]](https://www.rsc.org/images/entities/char_2009.gif) 1, with bio-oil final concentration of 15 wt%. The mixture was then centrifuged, and the top layer was separated as the water-soluble bio-oil (WSBO).72 The same group has proved that this cathode was capable of hydrogenating guaiacol, syringol and phenol, as showed in the previous sessions.39
1, with bio-oil final concentration of 15 wt%. The mixture was then centrifuged, and the top layer was separated as the water-soluble bio-oil (WSBO).72 The same group has proved that this cathode was capable of hydrogenating guaiacol, syringol and phenol, as showed in the previous sessions.39
Electrochemical hydrogenation of WSBO was carried out in a two-chamber glass H-cell, separated with a DuPont® Nafion117 membrane (see Fig. 11). The reaction temperature was 27 °C and the pressure was 1 atm. Anolyte consisted of 1 M sulfuric acid and Pt wire was used as the anode. A mixture of WSBO with 0.2 M NaCl served as the catholyte. Current was 480 mA.72
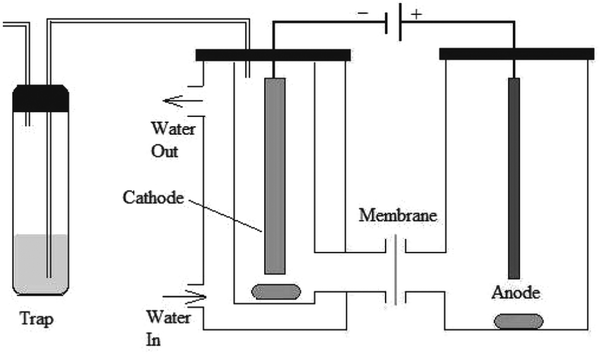 | ||
| Fig. 11 Electrochemical hydrogenation cell setup for ECH of water-soluble bio-oil.72 | ||
After the 6.5 h treatment, most of the organic compounds were depleted or fully converted by hydrogenation, the proposed mechanisms are shown in Fig. 12. Removal of >50% of acetic acid is an expressive result, as it is a major contributor to bio-oil corrosiveness. No coke formation was observed. The same experiments were done using only ACC as the cathode and showed that Ru is an essential part of the proposed ECH process.39
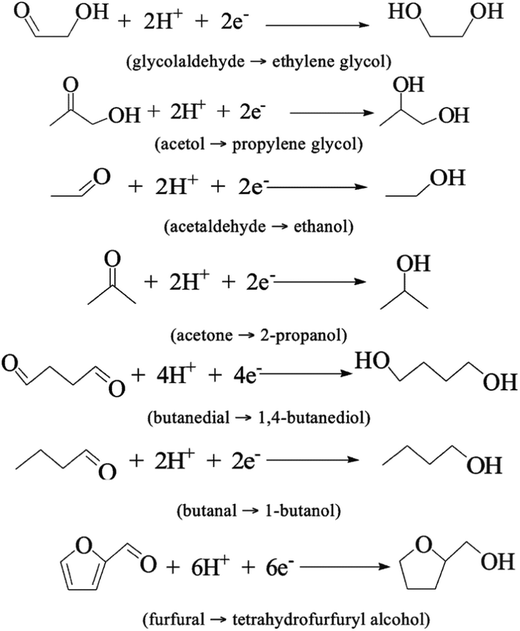 | ||
| Fig. 12 Reductions via ECH of organic compounds in water-soluble bio-oil.72 | ||
Although a noble metal catalyst (e.g., Pt and Ir) as the anode is normally used to ensure effective water oxidation, Zhang et al. found that a Fe(III)/Fe(II) redox pair can be utilized as a substitute when combined with carbon felt as the anode. This change can make the process less expensive and can further its usage. The authors presented a Ru-based ECH cathode catalyst by uniformly embedding Ru nanoparticles into the surface of the ordered mesoporous carbon (OMC) support (noted as Ru@OMC). The catholyte solution was WSBO, duration was 3 h.41 The cell setup is shown in Fig. 13.
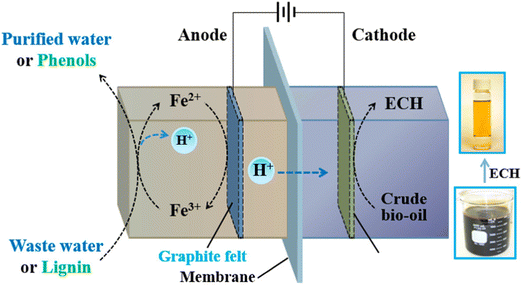 | ||
| Fig. 13 Schematic illustration of low-energy ECH of bio-oil: experimental setup. Reprinted with permission from ref. 41. Copyright 2018 American Chemical Society. | ||
The EHC treatment led to an increase in the H![[thin space (1/6-em)]](https://www.rsc.org/images/entities/char_2009.gif) :
:![[thin space (1/6-em)]](https://www.rsc.org/images/entities/char_2009.gif) C ratio and a decrease in the O
C ratio and a decrease in the O![[thin space (1/6-em)]](https://www.rsc.org/images/entities/char_2009.gif) :
:![[thin space (1/6-em)]](https://www.rsc.org/images/entities/char_2009.gif) C ratio. Another result was the content reduction in several organic groups, such as acids, esters, carbonyls, phenols, sugars, and furans. The alcohol content increase was substantial, and the process elevated the selectivity of polyhydric alcohols. The results infer that this technique provides de ability to saturate unsaturated components in WSBO.41
C ratio. Another result was the content reduction in several organic groups, such as acids, esters, carbonyls, phenols, sugars, and furans. The alcohol content increase was substantial, and the process elevated the selectivity of polyhydric alcohols. The results infer that this technique provides de ability to saturate unsaturated components in WSBO.41
4.3 Whole oil
Lister et al. employed both an anion exchange membrane (AEM) and a cation exchange membrane (CEM), in what is described as a dual exchange membrane (DEM) to upgrade a whole pyrolysis bio-oil mixed with an aqueous phase containing acetic acid and formic acid. The concentrate vessel was filled with 10 mL solution of 1 M Na2SO4. The oil was filtered to remove any char particles, a common product from pyrolysis. Fig. 14 shows a diagram of the electrolysis system used in this work.40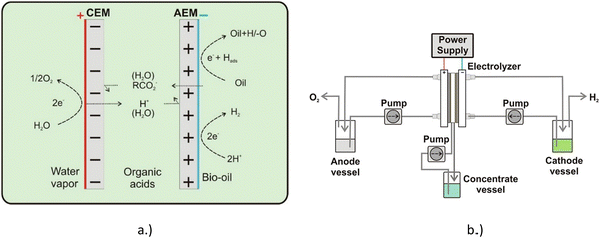 | ||
| Fig. 14 Spatial chemical representation (a) and diagram of the separation−hydrogenation process (b). Reprinted with permission from ref. 40. Copyright 2018 American Chemical Society. | ||
The cell temperature was held at 35 °C (±2 °C), the fluids flow rate was 2 mL min−1. A metal-free carbon catalytic cathode was chosen to prevent hydrogen evolution reaction (HER). The process achieved an increase in the pH from 2.6 to >4 and a significant reduction in total acid number (TAN). There were no signs of coke formation, improving carbon efficiency and catalyst lifetime. Although membrane degradation was noticed.40
5 Outlook of previous studies
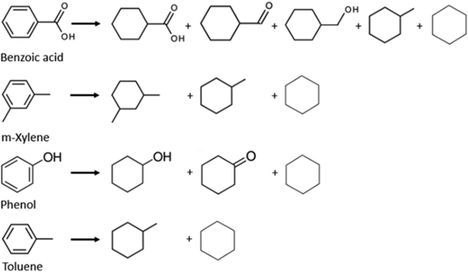
The electrochemical approach to upgrading bio-oils is a technique that can be performed at mild temperatures (<80 °C) and pressure (1 atm). This is an essential condition for a cheaper product, as traditional methods are energy intensive. Also, in thermal stabilization and deoxygenation, oxygen is released as CO2, CO, and H2O. These products represent a loss of expensive carbon and H2.40 The research gap that exists is on what are the ideal catalysts, membranes, cell configuration and how to increase the oil's low conductivity. Understanding the mechanism of the reaction and the behaviour of the compounds is a key part of the process, so model compound studies are necessary. Another way of simplifying the process so it can be more easily studied is utilizing WSBO as a feedstock; this allows the study to circumvent the challenges brought by the complexity of a mixture that contains both polar and non-polar compounds. Most studies have focused on either model compounds or WSBO, and therefore ECH of whole pyrolysis oil still needs further investigation. Zhenglong et al. demonstrated that the separation of WSBO can lead to a higher organic compound conversion. Ruthenium was used as the basis for the catalyst cathode, this metal was also utilized by Zhang et al., Zhou et al. and Gardew et al. The authors also proposed reactions for some compounds (see Fig. 12), this shows that hydroxyl groups, such as ketones, carboxylic acids and alcohols are resistant to hydrogenation, whereas double bonds were almost depleted. Gardew et al. also reported that, for phenolic compounds, the double bonds inside the aromatic ring were hydrogenated, when the hydroxyl group was not (e.g., phenol was converted into cyclohexanol and cyclohexanone rather than benzene). These data were extrapolated for the main components in plastic pyrolysis oil (see Fig. 15). It is worth noting that, although cyclohexane is a possible product of phenol hydrogenation, the process of C-O cleavage, which would involve the hydrogenation of cyclohexanol into cyclohexene (C6H12O → C6H10), followed by cyclohexene into cyclohexane (C6H10 → C6H12) would require much higher temperatures and overpotentials.62Carbon loss during the ECH process was reported by Zhenglong et al., as only 80% of the carbon was retained in the cathode chamber. 6.0% was found in the anode chamber, due to migration through the membrane, 2.6% was adsorbed by the cathode and 0.2% was trapped in the downstream water trapping system. The system's total carbon loss was 11.2%. The authors suggest that the rest could be inside the membrane, as it turned black after the process.72 This exemplifies how different membranes could lead to a better result, as the carbon loss could possibly be avoided. Also, the process cost is increased by constantly changing the system's components. Zhang et al. showed that a cheaper anode, the Fe(III)/Fe(II) redox pair, can be utilized as a substitute for the commonly used noble metal (e.g. Pt) as a way to make the overall process cheaper and more competitive.
The work of Zhou et al. demonstrates how different catalyst cathodes can interfere with the final product, as the difference in FE and conversion rates were quite significant. The authors also proposed that the guaiacol upgrading was favoured by a chemisorption selectiveness to this compound. This indicates that different feedstocks need different catalytic cathodes to be more effective. Gardew et al. exemplified how substrate concentration can affect the FE and selectivity of the product, although it is not a direct relationship. Coke formation was not a major problem, although Zhenglong et al. reported finding decanted materials on the cathode chamber.
To avoid the problems related to the commonly used H-type cell, Lister et al. proposed a carbon catalyst cathode and DEM as a cheap and effective way to achieve upgrading. Results were promising, and the product had a higher economic value, as it could be used as commodity chemicals, but the authors found that further upgrading would be necessary for utilization as biofuel.
6 Plastic recycling
For the creation of a circular plastic economy, the plastic-oil needs to be upgraded into a valuable product, examples include biofuels and feedstock for industry (refined hydrocarbons, petrochemicals, or monomers). To achieve both the calorific values and chemical composition required, heteroatoms (O, S, N, etc.) should be removed. Some other elements that are present in the oil were listed in previous sections.One area where a process of generating feedstock could be helpful includes plastic recycling, where the waste product can be returned to oil and then upgraded. Taking into consideration the highly variable nature of real plastic waste, Kusenberg et al. analysed municipal plastic waste and concluded that, to achieve industrial standards, the nitrogen concentration must be reduced by 87.7%, and oxygen by 98.0% (from 825 to 100 and 5200 to 100 ppmw respectively).73
Therefore, the focus of the upgrading process is the oxygenated compounds, that is, reducing the O![[thin space (1/6-em)]](https://www.rsc.org/images/entities/char_2009.gif) :
:![[thin space (1/6-em)]](https://www.rsc.org/images/entities/char_2009.gif) C ratio of the oil. Oxygenated compounds can lead to lower stability and heating values, as well as a more corrosive product, due to carboxylic acids. Most of the oxygen content comes from PET but to accomplish an effective plastic waste recycling process, PET cannot be excluded. Benzoic acid and its derivatives are the most common carboxylic acids in plastic-oil, and therefore should be the focus of the ECH process.
C ratio of the oil. Oxygenated compounds can lead to lower stability and heating values, as well as a more corrosive product, due to carboxylic acids. Most of the oxygen content comes from PET but to accomplish an effective plastic waste recycling process, PET cannot be excluded. Benzoic acid and its derivatives are the most common carboxylic acids in plastic-oil, and therefore should be the focus of the ECH process.
6.1 Selecting a catalytic cathode
Catalysts can be very selective over organic functional groups, and this presents a challenge for the ECH of whole pyrolysis oil as it is a complex mixture (more than 300 compounds), therefore the cathode needs to be more versatile than the ones chosen for model compounds and be capable of hydrogenating various functional groups. Recent reports shows that catalysts like alloy and carbon–metal hybrids are possible solutions.74Although carboxylic acids are resistant to hydrogenation, ruthenium shows high activity for this process.75 As shown in the previous section, Ru was also the chosen metal as the cathode for Zhenglong et al. (Ru/ACC), Zhang et al. (Ru nanoparticles on mesoporous carbon) and Gardew et al. (Ru/ACC), which proves its effectiveness in hydrogenating WSBO and phenolic compounds, setting it as a prime candidate for the hydrogenation of whole plastic-oil. The possible mechanism for the hydrogenation of carboxylic acids is shown in Fig. 16.
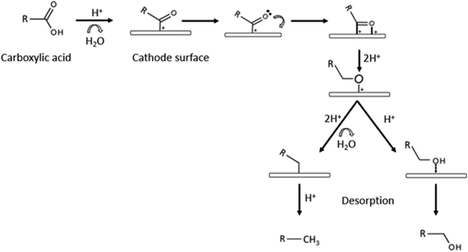 | ||
| Fig. 16 Mechanism for the hydrogenation of carboxylic acids. Edited with permission from ref. 75. Copyright 2020 Wiley. | ||
The hydrogenation of toluene into methylcyclohexane was carried out in a proton exchange membrane (PEM) system by Fukazawa et al. and found that PtRu/C was a better catalyst than individual metals such as Pt and Ru and presented high FE (>90%).53 In a later study, the same group reported on the ECH of benzoic acids into cyclohexane acids (PtRu/C catalyst) and presented high FE (99%) at a current density of 1.5 mA cm−2. The authors also reported that in less mild conditions, the carboxyl group could also be hydrogenated (see Fig. 12). As mentioned in previous sections, Du et al. also reported on the activity of different cathodes and found that Pt3Ru/ACC led to a higher conversion rate than Pt and Ru separately. The authors suggested that this could be the result of a synergistic effect between the two metals, combining platinum's excellent hydrogenation potency and the predominant direct hydrogenolysis ability of ruthenium.66 In addition, Salakhum et al. suggested that combining both metals can facilitate the cleavage of C–O and O–H bonds, as it reduces their heterolytic activation energies.76 This indicates that PtRu/ACC is a prime candidate for the ECH of carboxylic acids, and therefore, a possible choice of cathode for the hydrogenation of plastic-oil.52
6.2 Conductivity challenge
The pyrolysis oil has low conductivity values, which is a challenge for an electrochemical process. To circumvent this, an electrolyte is used, as a way of increasing the conductivity. However, the commonly used water-based electrolytes (acid/water; alkali/water and salt/water) are unlikely to be suited for pyrolysis oil treatment, due to the large number of water-insoluble compounds. The removal of both water and the electrolyte (e.g., HCl) after the treatment is also necessary, as it lowers the quality of the product. This would increase the costs and the complexity of the process and could render it unviable.74Possible solutions consist in either increasing oil conductivity via additives (e.g., tetrabutylammonium hexafluorophosphate (NBu4PF6); LiCl; ammonium carbonate) or using a solvent that is capable of dissolving both polar and nonpolar compounds (e.g., ionic liquids, DES (Deep Eutectic Solvents); biomass-derived organic solvents). Studies are necessary to understand the changes in the physicochemical properties of the oil and its behavior during ECH that an additive could bring. LiCl could increase the corrosivity of the product as Li+ and Cl− are prone to corrosion. Ammonium carbonate could lead to membrane clogging via carbonate deposition, as well as increase in the nitrogen composition of the oil, and therefore, its corrosivity. NBu4PF6 is a chemically inert powder that is commercially available and could provide the much-needed conductivity for the system.
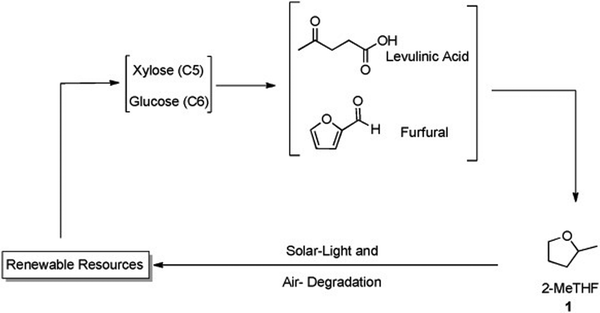 | ||
| Fig. 17 2-MeTHF production via renewable sources. Edited with permission from ref. 80. Copyright 2012 ChemSusChem. | ||
6.3 Plastic oil utilization
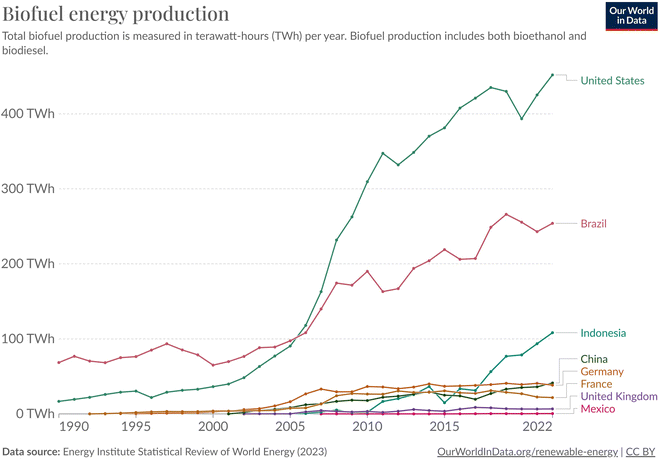 | ||
| Fig. 18 Total biofuel production in terawatt-hours (TW h) per year. Biofuel production includes both bioethanol and biodiesel. Chart constructed by Our world in data.83 | ||
7 Conclusions
Fast pyrolysis is a thermochemical process that can be used to produce oil from both biomass and plastic. This material is a complex mixture containing acids, alcohols, aldehydes, esters, phenols, guaiacols, and a great number of other organic compounds. As it has high water content, low C![[thin space (1/6-em)]](https://www.rsc.org/images/entities/char_2009.gif) :
:![[thin space (1/6-em)]](https://www.rsc.org/images/entities/char_2009.gif) O ratios, high viscosity, and low density it needs to be upgraded for widespread usage. The electrochemical process for bio-oil upgradation is still new and needs further study to be fully optimized. But previous studies show that it can be done under mild conditions of temperature and pressure. ECH can be done utilizing low-cost materials and can achieve high FE and conversion rates. ECH shows an exciting path for the upgradation process of pyrolysis oils from chemical recycling of both biomass and plastics, a low cost, mild hydrogenation process that can help to achieve the necessary circular and greener economy. The main takeaways from this review are
O ratios, high viscosity, and low density it needs to be upgraded for widespread usage. The electrochemical process for bio-oil upgradation is still new and needs further study to be fully optimized. But previous studies show that it can be done under mild conditions of temperature and pressure. ECH can be done utilizing low-cost materials and can achieve high FE and conversion rates. ECH shows an exciting path for the upgradation process of pyrolysis oils from chemical recycling of both biomass and plastics, a low cost, mild hydrogenation process that can help to achieve the necessary circular and greener economy. The main takeaways from this review are
• Noble metals are reactive species for the ECH of bio-oils. Rh, Pt and Ru loaded carbon cloth have all been reported to hydrogenate alcohols, carboxylic acids, olefins, and aromatic compounds, and presented high efficiency and FE.
• Current, potential, pH, and temperature are all essential factors in the ECH process. The fine tuning of these variables is necessary and directly linked to the quality of the final product.
• Conductivity of the oil presents a major challenge for ECH, alternative electrolytes and additives might be required to mke the process viable.
• The hydrogenation of plastic-oils is a possibility that still needs testing, although, as this technology matures, it may become one alternative for both the production of green plastics and biofuels.
Conflicts of interest
There are no conflicts to declare.Acknowledgements
The authors wish to thank UK Engineering and Physical Sciences Research Council (EPSRC) for supporting the work published in the paper through an EPSRC Doctoral Training Partnership Funding.References
- THE 17 GOALS|Sustainable Development, Available from: https://sdgs.un.org/goals.
- L. Shen and E. Worrell, Plastic Recycling, Handbook of Recycling: State-of-the-art for Practitioners, Analysts, and Scientists, 2014, pp. 179–190 Search PubMed.
- L. Lebreton and A. Andrady, Future scenarios of global plastic waste generation and disposal, Palgrave Commun., 2019, 5(1), 6 CrossRef.
- G. W. Coates and Y. D. Y. L. Getzler, Chemical recycling to monomer for an ideal, circular polymer economy, Nat. Rev. Mater., 2020, 5(7), 501–516 CrossRef CAS , Available from: https://www.nature.com/articles/s41578-020-0190-4.
- T. Hundertmark, M. Mayer, C. Mcnally, T. J. Simons and C. Witte, December 2018, Mckinsey on Chemicals, How plastics-waste recycling could transform the chemical industry.
- S. Chawla, B. S. Varghese, C. A, C. G. Hussain, R. Keçili and C. M. Hussain, Environmental impacts of post-consumer plastic wastes: treatment technologies towards eco-sustainability and circular economy, Chemosphere, 2022, 308, 135867 CrossRef CAS PubMed.
- A. Jahnke, H. P. H. Arp, B. I. Escher, B. Gewert, E. Gorokhova and D. Kühnel, et al., Reducing uncertainty and confronting ignorance about the possible impacts of weathering plastic in the marine environment, Environ. Sci. Technol. Lett., 2017, 4, 85–90 CrossRef CAS , Available from: https://pubs.acs.org/sharingguidelines.
- S. H. Chang, Plastic waste as pyrolysis feedstock for plastic oil production: a review, Sci. Total Environ., 2023, 877, 162719, DOI:10.1016/j.scitotenv.2023.162719.
- Q. Zhang, J. Chang, T. Wang and Y. Xu, Review of biomass pyrolysis oil properties and upgrading research, Energy Convers. Manage., 2007, 48(1), 87–92 CrossRef CAS.
- R. Kumar and V. Strezov, Thermochemical production of bio-oil: A review of downstream processing technologies for bio-oil upgrading, production of hydrogen and high value-added products, Renewable Sustainable Energy Rev., 2021, 135, 110152 CrossRef CAS.
- Chemical Recycling 101 [Internet]. [cited 2022 Jul 11], Available from: https://www.bpf.co.uk/plastipedia/chemical-recycling-101.aspx#_edn1.
- S. Hansen, A. Mirkouei and L. A. Diaz, A comprehensive state-of-technology review for upgrading bio-oil to renewable or blended hydrocarbon fuels, Renewable Sustainable Energy Rev., 2020, 118, 109548 CrossRef CAS.
- S. Hansen, A. Mirkouei and L. A. Diaz, A comprehensive state-of-technology review for upgrading bio-oil to renewable or blended hydrocarbon fuels, Renewable Sustainable Energy Rev., 2020, 118, 109548 CrossRef CAS.
- V. L. Mangesh, S. Padmanabhan, P. Tamizhdurai and A. Ramesh, Experimental investigation to identify the type of waste plastic pyrolysis oil suitable for conversion to diesel engine fuel, J. Cleaner Prod., 2020, 246 Search PubMed.
- M. Kusenberg, M. Roosen, A. Zayoud, M. R. Djokic, H. Dao Thi and S. De Meester, et al., Assessing the feasibility of chemical recycling via steam cracking of untreated plastic waste pyrolysis oils: Feedstock impurities, product yields and coke formation, Waste Manage., 2022, 141, 104–114 CrossRef CAS PubMed.
- M. Kusenberg, A. Eschenbacher, M. R. Djokic, A. Zayoud, K. Ragaert and S. De Meester, et al. , Waste Management, 2022, 138, 83–115 CrossRef CAS PubMed , Available from: https://creativecommons.org/licenses/by-nc-nd/4.0/.
- Y. Wang, A. Akbarzadeh, L. Chong, J. Du, N. Tahir and M. K. Awasthi, Catalytic pyrolysis of lignocellulosic biomass for bio-oil production: a review, Chemosphere, 2022, 297, 134181 CrossRef CAS PubMed.
- R. E. Guedes, A. S. Luna and A. R. Torres, Operating parameters for bio-oil production in biomass pyrolysis: a review, J. Anal. Appl. Pyrolysis, 2018, 129, 134–149 CrossRef CAS.
- S. Singh, J. P. Chakraborty and M. K. Mondal, Pyrolysis of torrefied biomass: Optimization of process parameters using response surface methodology, characterization, and comparison of properties of pyrolysis oil from raw biomass, J. Cleaner Prod., 2020, 272, 122517 CrossRef CAS.
- Y. Zhang, Y. Liang, S. Li, Y. Yuan, D. Zhang and Y. Wu, et al., A review of biomass pyrolysis gas: forming mechanisms, influencing parameters, and product application upgrades, Fuel, 2023, 347, 128461, DOI:10.1016/j.fuel.2023.128461.
- D. Lachos-Perez, J. C. Martins-Vieira, J. Missau, K. Anshu, O. K. Siakpebru and S. K. Thengane, et al., Review on Biomass Pyrolysis with a Focus on Bio-Oil Upgrading Techniques, Analytica., 2023, 4(2), 182–205 CrossRef CAS.
- J. Zhao, Z. Wang, J. Li, B. Yan and G. Chen, Pyrolysis of food waste and food waste solid digestate: A comparative investigation, Bioresour. Technol., 2022, 354, 127191 CrossRef CAS PubMed.
- J. Alvarez, G. Lopez, M. Amutio, J. Bilbao and M. Olazar, Bio-oil production from rice husk fast pyrolysis in a conical spouted bed reactor, Fuel, 2014, 128, 162–169 CrossRef CAS.
- J. He, V. Strezov, T. Kan, H. Weldekidan and R. Kumar, Slow pyrolysis of metal(loid)-rich biomass from phytoextraction: characterisation of biomass, biochar and bio-oil, Energy Proc., 2019, 160, 178–185 CrossRef CAS.
- Z. Luo, S. Wang, Y. Liao, J. Zhou, Y. Gu and K. Cen, Research on biomass fast pyrolysis for liquid fuel, Biomass Bioenergy, 2004, 26(5), 455–462 CrossRef CAS.
- F. Stankovikj, A. G. Mcdonald, G. L. Helms, M. V. Olarte and M. Garcia-Perez, Characterization of the Water-Soluble Fraction of Woody Biomass Pyrolysis Oils, Energy & Fuels, 2017, 31(2), 1650–1664 CrossRef CAS , Available from: https://www.btg-btl.com/.
- K. Sipilä, E. Kuoppala, L. Fagernäs and A. Oasmaa, Characterization of biomass-based flash pyrolysis oils, Biomass Bioenergy, 1998, 14(2), 103–113 CrossRef.
- A. C. Dyer, M. A. Nahil and P. T. Williams, Catalytic co-pyrolysis of biomass and waste plastics as a route to upgraded bio-oil, J. Energy Institute, 2021, 97, 27–36 CrossRef CAS.
- H. E. Toraman, T. Dijkmans, M. R. Djokic, K. M. van Geem and G. B. Marin, Detailed compositional characterization of plastic waste pyrolysis oil by comprehensive two-dimensional gas-chromatography coupled to multiple detectors, J. Chromatogr. A, 2014, 1359, 237–246 CrossRef CAS PubMed.
- Ö. Cepelioullar and A. E. Pütün, Products characterization study of a slow pyrolysis of biomass-plastic mixtures in a fixed-bed reactor, J. Anal. Appl. Pyrolysis, 2014, 110(1), 363–374 CrossRef.
- İ. Çit, A. Sınağ, T. Yumak, S. Uçar, Z. Mısırlıoğlu and M. Canel, Comparative pyrolysis of polyolefins (PP and LDPE) and PET, Polym. Bull., 2010, 64, 817–834 CrossRef.
- M. Mariappan, M. S. Panithasan and G. Venkadesan, Pyrolysis plastic oil production and optimisation followed by maximum possible replacement of diesel with bio-oil/methanol blends in a CRDI engine, J. Cleaner Prod., 2021, 312 Search PubMed.
- D. Xu, S. Yang, Y. Su, L. Shi, S. Zhang and Y. Xiong, Simultaneous production of aromatics-rich bio-oil and carbon nanomaterials from catalytic co-pyrolysis of biomass/plastic wastes and in-line catalytic upgrading of pyrolysis gas, Waste Manage., 2021, 121, 95–104 CrossRef CAS PubMed.
- K. B. Park, Y. S. Jeong, B. Guzelciftci and J. S. Kim, Two-stage pyrolysis of polystyrene: Pyrolysis oil as a source of fuels or benzene, toluene, ethylbenzene, and xylenes, Appl. Energy, 2020, 259, 114240 CrossRef CAS.
- I. Kalargaris, G. Tian and S. Gu, Combustion, performance and emission analysis of a DI diesel engine using plastic pyrolysis oil, Fuel Process. Technol., 2017, 157, 108–115 CrossRef CAS.
- R. Miandad, M. A. Barakat, A. S. Aburiazaiza, M. Rehan, I. M. I. Ismail and A. S. Nizami, Effect of plastic waste types on pyrolysis liquid oil, Int. Biodeterior. Biodegradation, 2017, 119, 239–252 CrossRef CAS.
- J. A. Onwudili, N. Insura and P. T. Williams, Composition of products from the pyrolysis of polyethylene and polystyrene in a closed batch reactor: Effects of temperature and residence time, J. Anal. Appl. Pyrolysis, 2009, 86(2), 293–303 CrossRef CAS.
- I. Graca, J. M. Lopes, H. S. Cerqueira and M. F. Ribeiro, Bio-oils Upgrading for Second Generation Biofuels, Ind. Eng. Chem. Res., 2012, 52(1), 275–287 CrossRef , Available from: https://pubs.acs.org/doi/abs/10.1021/ie301714x.
- Z. Li, M. Garedew, C. H. Lam, J. E. Jackson, D. J. Miller and C. M. Saffron, Green Chemistry Mild electrocatalytic hydrogenation and hydrodeoxygenation of bio-oil derived phenolic compounds using ruthenium supported on activated carbon cloth, Green Chem., 2012, 14(9), 2540–2549 RSC , Available from: https://www.rsc.org/greenchem.
- T. E. Lister, L. A. Diaz, M. A. Lilga, A. B. Padmaperuma, Y. Lin and V. M. Palakkal, et al., Low-Temperature Electrochemical Upgrading of Bio-oils Using Polymer Electrolyte Membranes, Energy Fuels, 2018, 32(5), 5944–5950 CrossRef CAS.
- B. Zhang, J. Zhang and Z. Zhong, Low-Energy Mild Electrocatalytic Hydrogenation of Bio-oil Using Ruthenium Anchored in Ordered Mesoporous Carbon, ACS Appl. Energy Mater., 2018, 1(12), 6758–6763 CrossRef CAS , Available from: https://pubs.acs.org/sharingguidelines.
- Y. Zhou, Y. Gao, X. Zhong, W. Jiang, Y. Liang and P. Niu, et al., Electrocatalytic Upgrading of Lignin-Derived Bio-Oil Based on Surface-Engineered PtNiB Nanostructure, Adv. Funct. Mater., 2019, 29(10), 1807651 CrossRef , Available from: https://onlinelibrary.wiley.com/doi/full/10.1002/adfm.201807651.
- J. D. Adjaye and N. N. Bakhshi, Catalytic conversion of a biomass-derived oil to fuels and chemicals I: Model compound studies and reaction pathways, Biomass Bioenergy, 1995, 8(3), 131–149 CrossRef CAS.
- P. M. Mortensen, J. D. Grunwaldt, P. A. Jensen, K. G. Knudsen and A. D. Jensen, A review of catalytic upgrading of bio-oil to engine fuels, Appl. Catal., A, 2011, 407(1–2), 1–19 CrossRef CAS.
- A. Gutierrez, R. K. Kaila, M. L. Honkela, R. Slioor and A. O. I. Krause, Hydrodeoxygenation of guaiacol on noble metal catalysts, Catal. Today, 2009, 147(3–4), 239–246 CrossRef CAS.
- Y. H. E. Sheu, R. G. Anthony and E. J. Soltes, Kinetic studies of upgrading pine pyrolytic oil by hydrotreatment, Fuel Process. Technol., 1988, 19(1), 31–50 CrossRef CAS.
- W. Baldauf, U. Balfanz and M. Rupp, Upgrading of flash pyrolysis oil and utilization in refineries, Biomass Bioenergy, 1994, 7(1–6), 237–244 CrossRef CAS.
- J. Wildschut, F. H. Mahfud, R. H. Venderbosch and H. J. Heeres, Hydrotreatment of Fast Pyrolysis Oil Using Heterogeneous Noble-Metal Catalysts, Ind. Eng. Chem. Res., 2009, 48(23), 10324–10334 CrossRef CAS , Available from: https://pubs.acs.org/sharingguidelines.
- P. T. Williams and P. A. Horne, Characterisation of oils from the fluidised bed pyrolysis of biomass with zeolite catalyst upgrading, Biomass Bioenergy, 1994, 7(1–6), 223–236 CrossRef CAS.
- A. R. K. Gollakota, M. Reddy, M. D. Subramanyam and N. Kishore, A review on the upgradation techniques of pyrolysis oil, Renewable Sustainable Energy Rev., 2016, 58, 1543–1568 CrossRef CAS.
- G. Chen, L. Liang, N. Li, X. Lu, B. Yan and Z. Cheng, Upgrading of Bio-Oil Model Compounds and Bio-Crude into Biofuel by Electrocatalysis: A Review, ChemSusChem, 2021, 14(4), 1037–1052 CrossRef CAS PubMed , Available from: https://onlinelibrary.wiley.com/doi/full/10.1002/cssc.202002063.
- A. Fukazawa, Y. Shimizu, N. Shida and M. Atobe, Organic & Biomolecular Chemistry Electrocatalytic hydrogenation of benzoic acids in a proton-exchange membrane reactor, Org. Biomol. Chem., 2021, 19, 7363–7368 RSC.
- K. Takano, H. Tateno, Y. Matsumura, A. Fukazawa, T. Kashiwagi and K. Nakabayashi, et al., Electrocatalytic Hydrogenation of Toluene Using a Proton Exchange Membrane Reactor, Bull. Chem. Soc. Jpn., 2016, 89(10), 1178–1183 CrossRef CAS.
- Z. Li, S. Kelkar, C. H. Lam, K. Luczek, J. E. Jackson and D. J. Miller, et al., Aqueous electrocatalytic hydrogenation of furfural using a sacrificial anode, Electrochim. Acta, 2012, 64, 87–93 CrossRef CAS.
- B. Zhao, Q. Guo and Y. Fu, Electrocatalytic Hydrogenation of Lignin-Derived Phenol into Alkanes by Using Platinum Supported on Graphite, Article Electrochem., 2014, 82(11), 954–959, DOI:10.5796/electrochemistry.82.954.
- M. Garedew, D. Young-Farhat, J. E. Jackson and C. M. Saffron, Electrocatalytic Upgrading of Phenolic Compounds Observed after Lignin Pyrolysis, ACS Sustainable Chem. Eng., 2019, 7(9), 8375–8386 CrossRef CAS , Available from: https://pubs.acs.org/doi/10.1021/acssuschemeng.9b00019.
- X. H. Chadderdon, D. J. Chadderdon, J. E. Matthiesen, Y. Qiu, J. M. Carraher and J. P. Tessonnier, et al., Mechanisms of Furfural Reduction on Metal Electrodes: Distinguishing Pathways for Selective Hydrogenation of Bioderived Oxygenates Scheme 1. Proposed Pathways of Electrochemical Reduction of Carbonyls in Acidic Electrolytes, J. Am. Chem. Soc., 2017, 139, 41 CrossRef PubMed , Available from: https://pubs.acs.org/sharingguidelines.
- C. H. Lam, C. B. Lowe, Z. Li, K. N. Longe, J. T. Rayburn and M. A. Caldwell, et al., Electrocatalytic upgrading of model lignin monomers with earth abundant metal electrodes, Green Chem., 2015, 17(1), 601–609 RSC , Available from: https://www.rsc.org/greenchem.
- W. Liu, W. You, Y. Gong and Y. Deng, High-efficiency electrochemical hydrodeoxygenation of bio-phenols to hydrocarbon fuels by a superacid-noble metal particle dual-catalyst system, Energy Environ. Sci., 2020, 13, 917 RSC.
- W. Deng, K. Xu, Z. Xiong, W. Chaiwat, X. Wang and S. Su, et al., Evolution of Aromatic Structures during the Low-Temperature Electrochemical Upgrading of Bio-oil, Energy Fuels, 2019, 33(11), 11292–11301 CrossRef CAS , Available from: https://pubs.acs.org/sharingguidelines.
- A. S. May and E. J. Biddinger, Strategies to Control Electrochemical Hydrogenation and Hydrogenolysis of Furfural and Minimize Undesired Side Reactions, ACS Catal., 2020, 10(5), 3212–3221 CrossRef CAS.
- Y. P. Wijaya, T. Grossmann-Neuhaeusler, R. D. Dhewangga Putra, K. J. Smith, C. S. Kim and E. L. Gyenge, Electrocatalytic Hydrogenation of Guaiacol in Diverse Electrolytes Using a Stirred Slurry Reactor, ChemSusChem, 2020, 13(3), 629–639 CrossRef CAS PubMed.
- Y. Kwon and M. T. Koper, Electrocatalytic Hydrogenation and Deoxygenation of Glucose on Solid Metal Electrodes, ChemSusChem, 2013, 6(3), 455–462 CrossRef CAS PubMed.
- A. Roessler, O. Dossenbach and P. Rys, Electrocatalytic Hydrogenation of Indigo, J. Electrochem. Soc., 2003, 150(1), D1 CrossRef CAS.
- Y. Song, O. Y. Gutiérrez, J. Herranz and J. A. Lercher, Aqueous phase electrocatalysis and thermal catalysis for the hydrogenation of phenol at mild conditions, Appl. Catal., B, 2016, 182, 236–246 CrossRef CAS.
- Y. Du, X. Chen and C. Liang, Selective electrocatalytic hydrogenation of phenols over ternary Pt3RuSn alloy. Molecular, Catalysis, 2023, 535 Search PubMed.
- D. C. Cantu, A. B. Padmaperuma, M. T. Nguyen, S. A. Akhade, Y. Yoon and Y. G. Wang, et al., A Combined Experimental and Theoretical Study on the Activity and Selectivity of the Electrocatalytic Hydrogenation of Aldehydes, ACS Catal., 2018, 8(8), 7645–7658 CrossRef CAS , Available from: https://pubs.acs.org/sharingguidelines.
- J. A. Lopez-Ruiz, U. Sanyal, J. Egbert, O. Y. Gutiérrezgutiérrez and J. Holladay, Kinetic Investigation of the Sustainable Electrocatalytic Hydrogenation of Benzaldehyde on Pd/C: Effect of Electrolyte Composition and Half-Cell Potentials, ACS Sustainable Chem. Eng., 2018, 6(12), 16073–16085 CrossRef CAS , Available from: https://pubs.acs.org/sharingguidelines.
- A. Roessler, O. Dossenbach and P. Rys, Electrocatalytic Hydrogenation of Indigo: Process Optimization and Scale-Up in a Flow Cell, J. Electrochem. Soc., 2002, 150, D1 CrossRef.
- K. Amouzegar and O. Savadogo, Electrocatalytic hydrogenation of phenol on highly dispersed Pt electrodes, Electrochim. Acta, 1994, 39(4), 557–559 CrossRef CAS.
- T. S. Dalavoy, J. E. Jackson, G. M. Swain, D. J. Miller, J. Li and J. Lipkowski, Mild electrocatalytic hydrogenation of lactic acid to lactaldehyde and propylene glycol, J. Catal., 2007, 246(1), 15–28 CrossRef CAS.
- Z. Li, S. Kelkar, L. Raycraft, M. Garedew, J. E. Jackson, D. J. Miller and C. M. Saffron, A mild approach for bio-oil stabilization and upgrading: electrocatalytic hydrogenation using ruthenium supported on activated carbon cloth, Green Chem., 2014, 16, 844–852 RSC , Available from: https://www.rsc.org/greenchem.
- M. Kusenberg, G. C. Faussone, H. D. Thi, M. Roosen, M. Grilc and A. Eschenbacher, et al., Maximizing olefin production via steam cracking of distilled pyrolysis oils from difficult-to-recycle municipal plastic waste and marine litter, Sci. Total Environ., 2022, 838, 156092 CrossRef CAS PubMed.
- B. Song, F. X. Collard, K. Torr, R. Vellacheri, L. Sandström, et al., IEA Bioenergy Task 34 Report: Electrochemical transformations of fast pyrolysis bio-oils and related bio-oil compounds. International Energy Agency (IEA) Bioenergy Technology Collaboration Programme, 2022, https://www.ieabioenergy.com/blog/publications/electrochemical-transformations-of-fast-pyrolysis-bio-oils-and-related-bio-oil-compounds/.
- M. Tamura, Y. Nakagawa and K. Tomishige, Recent Developments of Heterogeneous Catalysts for Hydrogenation of Carboxylic Acids to their Corresponding Alcohols, Asian J. Org. Chem., 2020, 9(2), 126–143 CrossRef CAS , Available from: https://onlinelibrary.wiley.com/doi/full/10.1002/ajoc.201900667.
- S. Salakhum, T. Yutthalekha, S. Shetsiri, T. Witoon and C. Wattanakit, Bifunctional and Bimetallic Pt–Ru/HZSM-5 Nanoparticles for the Mild Hydrodeoxygenation of Lignin-Derived 4-Propylphenol, ACS Appl. Nano Mater., 2019, 2(2), 1053–1062 CrossRef CAS.
- A. Paiva, R. Craveiro, I. Aroso, M. Martins, R. L. Reis and A. R. C. Duarte, Natural Deep Eutectic Solvents – Solvents for the 21st Century, ACS Sustainable Chem. Eng., 2014, 2(5), 1063–1071 CrossRef CAS.
- E. L. Smith, A. P. Abbott and K. S. Ryder, Deep Eutectic Solvents (DESs) and Their Applications, Chem. Rev., 2014, 114(21), 11060–11082 CrossRef CAS PubMed.
- B. B. Hansen, S. Spittle, B. Chen, D. Poe, Y. Zhang and J. M. Klein, et al., Deep Eutectic Solvents: A Review of Fundamentals and Applications, Chem. Rev., 2021, 121(3), 1232–1285 CrossRef CAS PubMed.
- V. Pace, P. Hoyos, L. Castoldi, P. Domínguez de María and A. R. Alcántara, 2-Methyltetrahydrofuran (2-MeTHF): a biomass-derived solvent with broad application in organic chemistry, ChemSusChem, 2012, 5(8), 1369–1379 CrossRef CAS PubMed.
- R. Zevenhoven, M. Karlsson, M. Hupa and M. Frankenhaeuser, Combustion and Gasification Properties of Plastics Particles, J. Air Waste Manage. Assoc., 1997, 47(8), 861–870 CrossRef CAS PubMed , Available from: https://www.tandfonline.com/action/journalInformation?journalCode=uawm20.
- Z. Manžuch, R. Akelytė, M. Camboni and D. Carlander, Chemical Recycling of Polymeric Materials from Waste in the Circular Economy, August 2021, Final Report, Quality Assurance, Project reference/title ECHA/2020/571, Report status, Final report.
- bp. Statistical Review of World Energy 2022.
| This journal is © The Royal Society of Chemistry 2024 |


