
Bio-conjugated carbon dots for the bimodal detection of prostate cancer biomarkers via sandwich fluorescence and electrochemical immunoassays†
Jyoti
Korram‡
a,
Amarnath Chellachamy
Anbalagan‡
a,
Anannya
Banerjee
 b and
Shilpa N.
Sawant
*ac
b and
Shilpa N.
Sawant
*ac
aChemistry Division, Bhabha Atomic Research Centre, Trombay, Mumbai 400085, India. E-mail: stawde@barc.gov.in; Tel: +91 22 25593869
bFuel Chemistry Division, Bhabha Atomic Research Centre, Trombay, Mumbai 400085, India
cHomi Bhabha National Institute, Anushaktinagar, Mumbai 400094, India
First published on 11th December 2023
Abstract
Bimodal detection facilitates the accurate and reliable detection of cancer biomarkers, which can assist in the early diagnosis of cancer. Herein, S-doped carbon dots (OCDs) with a size of 3 nm and blue emission were synthesized by the hydrothermal treatment of onion extract. The S-doped carbon dots were bioconjugated with an antibody (OCDs@PSAAbHRP) to design a nanoprobe for the detection of prostate specific antigen (PSA), an important serum based prostate cancer biomarker. The detection probe enabled the biomodal assay of PSA via fluorescence immunoassay (FIA) and electrochemical immunoassay (ECIA). In both assays, polyethylenimine stabilized polyaniline nanoparticles (PNPs) were used as the immobilization matrix, which played a major role in widening the linear range of biosensors (0.1 to 100 ng ml−1 for ECIA and 5 to 120 ng ml−1 for FIA). Paper-based and smartphone-integrated fluorescence immuno-array developed using the OCDs@PSAAbHRP detection probe provided cost-effective and rapid detection, while the electrochemical immunoassay provided a high sensitivity (7.8 μA ng−1 ml−1 cm−2) and low detection limit (38 pg ml−1) for PSA detection. The role of OCDs in enhancing the sensor performance was deciphered by carrying out detailed electrochemical studies with HRP enzyme-loaded OCDs. The biosensor was used to detect PSA in human blood serum samples and the results were consistent with conventional techniques. Owing to its analytical properties coupled with simplicity, cost-effectiveness, and portability, the bimodal sensor system has potential for application in clinical analysis.
Introduction
In recent years, the number of cancer-associated deaths has exceeded that of heart diseases in many countries. Among the various cancers, prostate cancer (PCa) is one of the leading causes of death among men worldwide. It is more likely to occur in older men, and 1 in 8 is diagnosed with PCa during their lifetime. PSA is a single-chain glycoprotein (32–33 kDa) secreted by the prostate gland and its levels elevate during the progression of the PCa tumour. Hence, it is considered an important biomarker for PCa diagnosis. A serum PSA level below 4 ng ml−1 is considered normal, while a level between 4 and 10 ng ml−1 is considered an indication of PCa.1 To avoid mortality, it is essential to detect PCa at an earlier stage. Rapid, reliable, and sensitive methods of detection of cancer biomarkers play a significant role in the early diagnosis of cancer, which also improves the survival of cancer patients. Biosensors can detect and quantify cancer biomarkers in the blood or tissues. Common biosensing methods employed to detect CBs are radio-immunoassay, surface-enhanced Raman spectroscopy, surface plasmon resonance (SPR), enzyme-linked immunosorbent assay, and electrochemical immunoassay. Among these methods, the electrochemical method has attracted much attention because of its advantages, including high sensitivity, portability, simple operation, cost-effectiveness, and easy fabrication.2 To further improve the reliability of detection, electrochemical immunoassay can be integrated with optical detection techniques, such as fluorescence measurements, to develop dual-mode detection strategies.3,4 Dual-mode detection mostly relies on the signalling capability of the detection probe under different conditions. Compared to a single-output conventional sensing system, a sensor with dual-output can ensure better reliability and accuracy of detection and accomplish accurate quantification of the target.3,4CDs are zero-dimensional carbon-based nanomaterials with diameters of less than 10 nm. In recent scenarios, CDs have been extensively used as probes for detecting various analytes in biological and environmental systems mainly owing to their size, biocompatibility, functionality, less cytotoxicity, fluorescence and catalytic properties.5,6 Heteroatom doping can enhance the optical characteristics of CDs, imparting a high quantum yield. Several researchers have doped CDs with heteroatoms, such as nitrogen, sulfur, phosphorus, and boron, to obtain CDs with a high fluorescence quantum yield. Hence, heteroatom-doped CDs have been developed as versatile materials for fluorescence-based sensing applications. The synthesis of CDs from greener biomass sources paves the way for scalable and sustainable CD production. Biomass containing heteroatom sources has the additional advantage of providing N- or S-doped CDs after carbonization. Green pepper seeds were used to produce N-, S-, and P-doped CDs, which can be used for the detection of Fe3+ in solution and living cells.7 Carbon dots with sulphur doping have attracted significant attention owing to their distinctive properties, such as hydrogen adsorption, high electrochemical capacity, photoactivity, rechargeable battery performance, and electrocatalytic activity.8 Various sulphur-doped carbon-based materials, such as microporous carbons, carbon microspheres, activated carbons, carbon quantum dots and co-doped graphenes, have been reported.9–13 Sulfur atoms can also regulate the density of states and afford emissive trap states (ETSs), which result in electrons being excited to revise the band gap energy. Therefore, S doping can tune the maximum fluorescence emission of CDs to a longer wavelength and improve the fluorescence intensity.14
Herein, bio-conjugated OCDs have been developed as the probe to detect PSA in a bimodal electrochemical and fluorescence immunosensor. OCDs were synthesized by the hydrothermal treatment of onion extract and investigated by TEM, FTIR, UV and fluorescence spectroscopy. Polyethylenimine stabilized polyaniline nanoparticles (PNPs) modified paper-based FIA and SPE-based ECIA sensing platforms were designed to detect PSA using bio-conjugated OCDs as detection probe.
Experimental details
Materials and characterization
Materials utilized and characterization details are elaborated in the (ESI† page 2).Synthesis of onion-derived CDs (OCDs)
Fresh onion was chopped and crushed with a mortar and pestle with 20 ml of deionized water and filtered with a muslin cloth. The mixture was placed in a hydrothermal autoclave reactor and heated at 180 °C for 5 h. After the reaction, the autoclave was cooled to room temperature. The resulting solution was dispersed in DI water and centrifuged at 6000 rpm for 30 min, and the supernatant was dialyzed against deionized water through dialysis tubing (MWCO = 3 kDa) for 24 h and stored at 4 °C for further use.Detection probe: bio-conjugated OCDs
To 1 ml OCDs (1 mg ml−1), a 1![[thin space (1/6-em)]](https://www.rsc.org/images/entities/char_2009.gif) :1 mixture of EDC (0.1 M)/NHS (0.05 M) and HRP-conjugated PSA antibody (PSAAbHRP) was incubated at 4 °C for 24 h to obtain PSAAbHRP bio-conjugated OCDs (OCDs@PSAAbHRP). This was used as the common detection probe in sandwich FIA and ECIA for PSA detection.
:1 mixture of EDC (0.1 M)/NHS (0.05 M) and HRP-conjugated PSA antibody (PSAAbHRP) was incubated at 4 °C for 24 h to obtain PSAAbHRP bio-conjugated OCDs (OCDs@PSAAbHRP). This was used as the common detection probe in sandwich FIA and ECIA for PSA detection.
Immobilization matrix: synthesis of PNPs
PNPs were synthesized by a chemical oxidative polymerization pathway as per our previous report.15 To 50 ml of 2 M HCl solution containing 0.9313 g aniline and 1.862 g polyethylenimine (PEI), 50 ml of 2 M HCl containing 1.14 g ammonium persulfate was added drop-wise and kept under constant stirring at room temperature for 4 h. Thus, the obtained green dispersion was precipitated in 25 ml ethanol, centrifuged, re-dispersed in water to obtain 5 mg ml−1 PEI stabilized polyaniline nanoparticles (PNPs) and used as the immobilization matrix for FIA and ECIA assays.Fabrication of paper-based fluorescence immunosensor
Whatman Grade 1 cellulose filter paper (100 mm) was modified with PNPs and used as a sensing platform for PSA detection. In the first stage, the paper was cut into circles (3 mm in diameter) and then stuck over wax-coated glass slides. PNPs were drop-casted on paper circles and dried at room temperature for 30 min. PSAAbcap was immobilized on PNP-modified paper circles using glutaraldehyde coupling. The paper circles were then incubated in BSA solution to block the remaining active sites to avoid non-specific binding. After each stage, the paper circles were rinsed with PBS (pH = 7.4). Standard PSA solutions of different concentrations were incubated with the prepared paper circles for 30 min. This was followed by the incubation of the paper circles with a detection probe for 60 min. After rinsing the circles with PBS to remove the physically bound detection probe, the circles were examined under a UV lamp with an excitation wavelength of 365 nm.Construction of PSA sandwich electrochemical biosensor
As depicted in Scheme 1, PNPs (5 mg ml−1, 5 μl) were deposited on the SPE and used as a sensing platform (SPE-PNPs) for PSA detection. Initially, the capture antibody, PSAAbcap (10 μl of 500 ng ml−1; 30 min incubation) was incubated on the SPE-PNPs via glutaraldehyde (1% w/v solution for 10 min) coupling, followed by blocking of active sites by BSA (1% w/v solution for 10 min). Then, PSA of different concentrations was incubated over different sensor films for 30 min, followed by incubation with detection probe OCDs@PSAAbHRP for 60 min. CV and CA were conducted in PBS containing hydroquinone and H2O2. The amperometric current obtained on the reduction of H2O2 by OCDs@PSAAbHRP bound to PSA was recorded. Chronoamperometry (CA) was carried out at 0 V for 10 s and −0.1 V for 10 s as the reduction of H2O2 catalysed by HRP present on the detection probe occurred at this potential in the presence of HQ. For an individual PSA concentration, the difference in the value of the current (ΔI) for 4.5 mM H2O2 and 0 mM H2O2 (ΔI = IH2O2 − Iblank) was used to obtain a calibration plot of ΔI vs. [PSA]. For the real sample analysis, 10 μl of human blood serum was used instead of the standard PSA solution.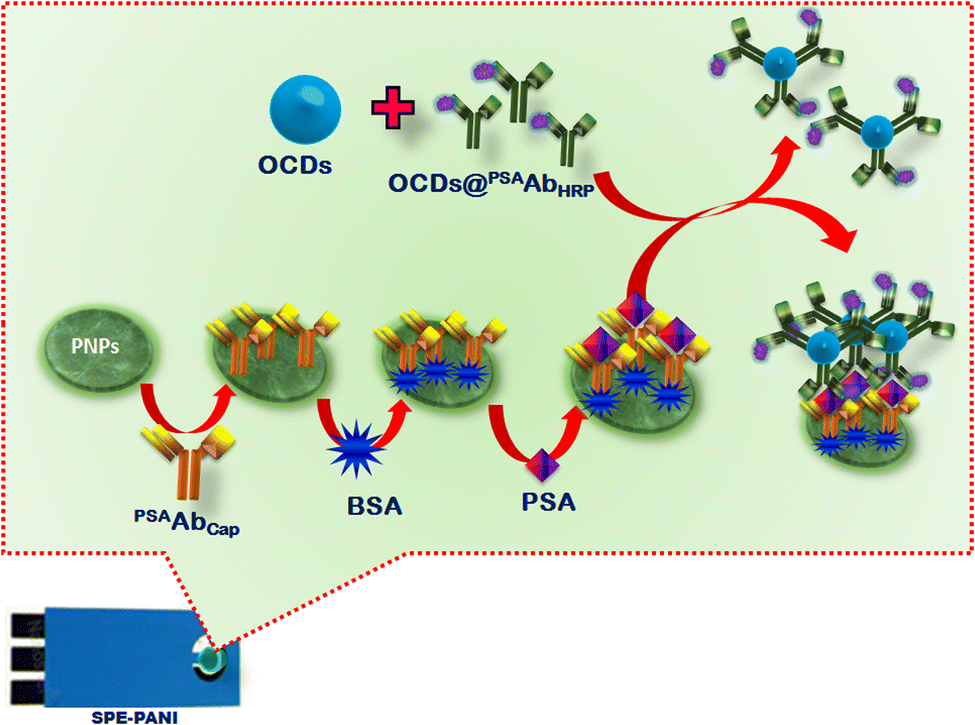 | ||
| Scheme 1 Schematic representation of sandwich immunosensor fabrication for PSA detection depicting signal amplification by OCDs during electrochemical immunoassay. | ||
Results and discussion
Onion contains organosulfur compounds, polyphenolic compounds, flavonoids, phenolic acids and ascorbic acid, which are responsible for its color, flavor and aroma. The major organosulfur compounds present in onions are diallyl-monosulfide, disulfide, trisulfide, and tetrasulfide, which are responsible for their aroma. It is an excellent source of carbon as well as sulphur; hence, it can be used as the precursor for the synthesis of sulfur-doped CDs without adding any other heteroatom containing precursors.16 Hydrothermal treatment of the onion extract at 180 °C facilitated carbonization to form fluorescent CDs. The reaction conditions used herein are similar to those of previous reports on the preparation of CDs from the green natural polysaccharide alginic acid (from brown algae).17,18 The synthesis of some biomass-derived CDs required tedious reaction conditions, followed by difficult post-synthesis treatments. Many researchers utilized strong acids, surface passivating agents, oxidizing agents and inorganic salts for CD synthesis.19–22 However, in the present work, such additives were not required, and fluorescent CDs were obtained with simple processing steps.The optical properties of this synthesized OCD solution are presented in Fig. 1a and b. The UV-Vis absorption spectrum (Fig. 1a) exhibits a shoulder at 280 nm attributed to the π–π* transition of the aromatic sp2 domains and an absorption broad peak at 340 nm ascribed to the n–π* transition of the C–O bond.23 The OCD solution exhibited excitation-dependent emission behavior (Fig. 1b) similar to that reported in previous literature,17 which may be associated with the surface states affecting the band gap. As the excitation wavelength increased from 300 to 470 nm (with a 10 nm increment), the emission gradually shifted to higher wavelengths, and the most intense emission could be observed upon excitation at 370 nm. However, the sharp and intense excitation FL spectra were observed at 360 nm and emission FL at around 450 nm (blue line in Fig. 1a) and exhibit a light yellow color in daylight and a bright blue color under 365 nm UV light (see inset, Fig. 1a).
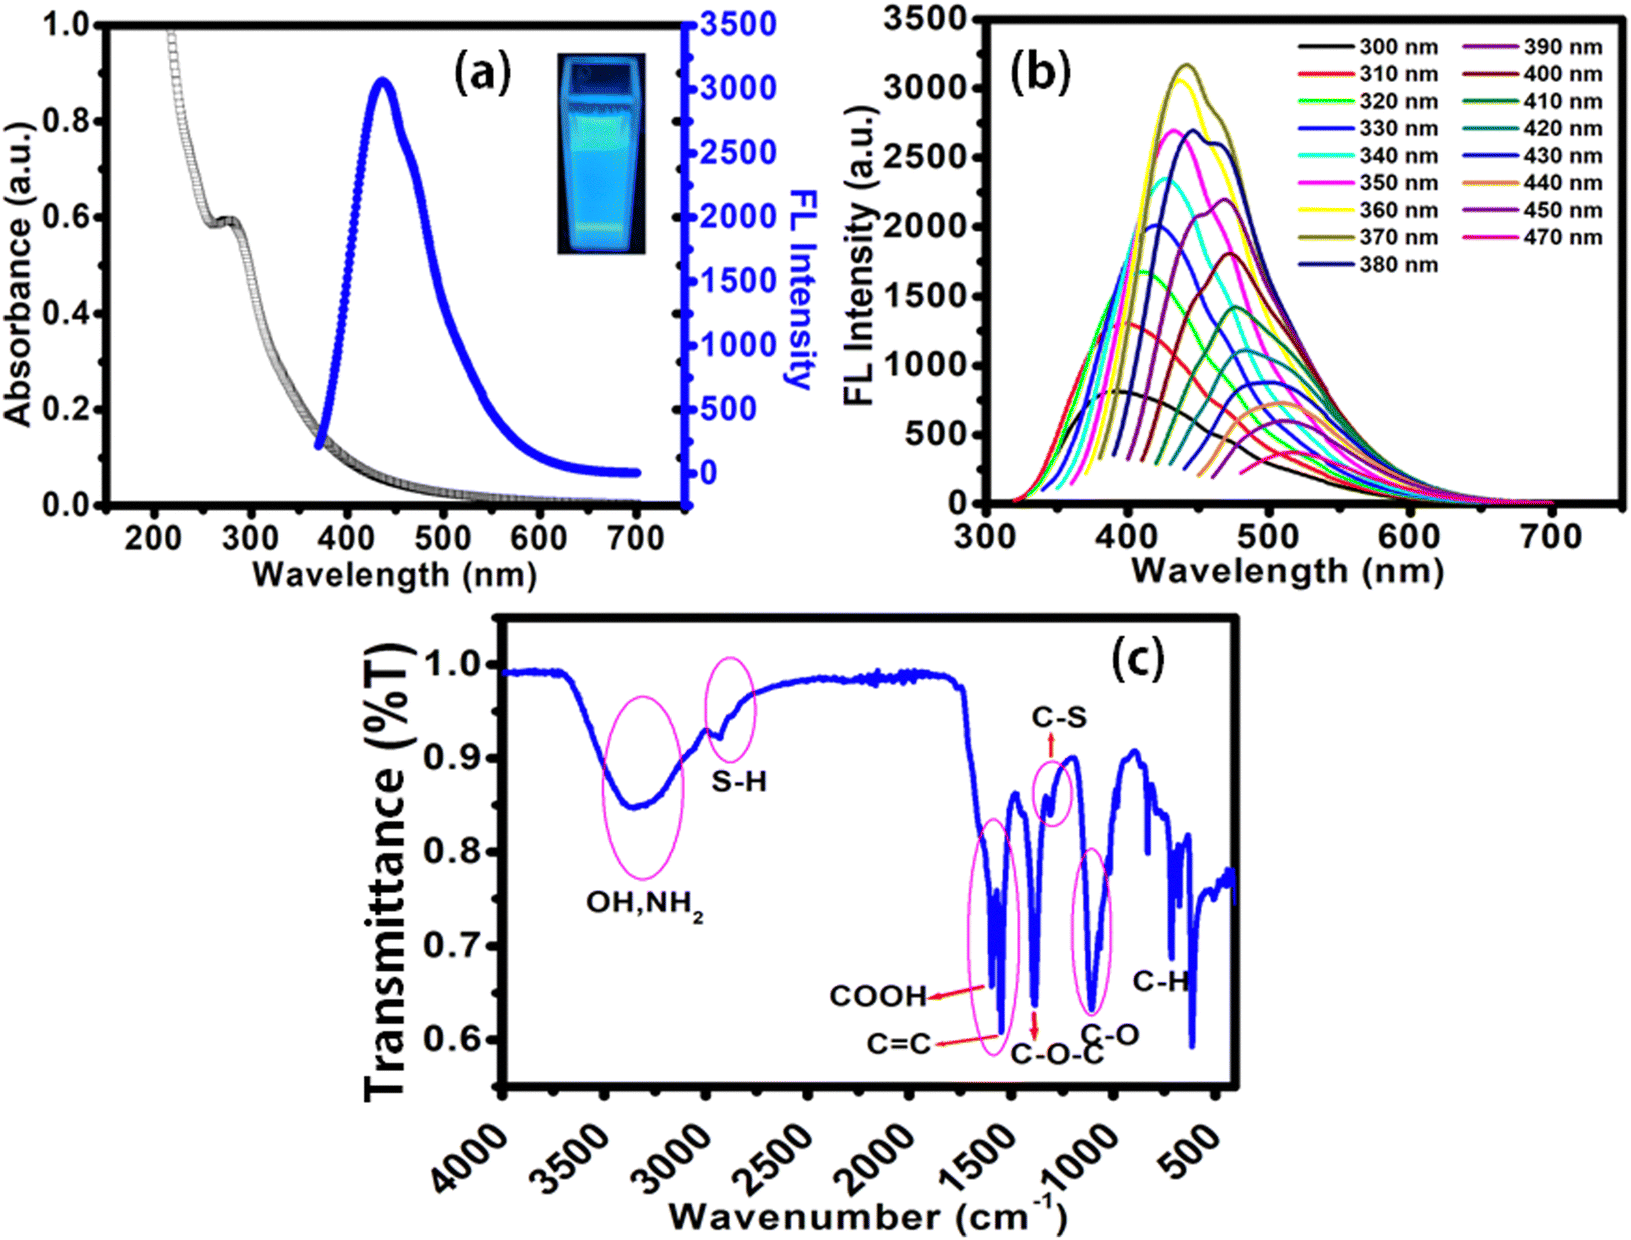 | ||
| Fig. 1 (a) Absorption and FL spectra of OCDs excited at 360 nm. Inset: Strong blue FL of OCD solution observed by the naked eyes under 365 nm UV lamp illumination. (b) FL spectra of OCDs excited at different wavelengths ranging from 300 nm to 470 nm and (c) FT-IR spectra of OCDs. | ||
The surface functional groups of the OCDs were revealed by FTIR spectroscopy. A broad peak centered at around 3300 cm−1 and peaks at around 2580 and 1700 cm−1 confirmed the presence of amino, hydroxyl, sulfur and carboxylic groups on the surface of OCDs, which provided polarity and water solubility to the OCDs.24 An elaborate discussion on the FT-IR spectra of OCDs (Fig. 1c) and the source of OCDs, i.e. onion biomass (Fig. S1), is provided in the ESI.† Electron dispersive X-ray spectroscopy analysis shows the presence of 6.05% N and 0.31% S in the OCDs (ESI† Fig. S2).
The morphology and size of the OCDs were observed by TEM (Fig. 2a), where the image shows that the OCDs are nearly spherical and exhibit uniform dispersion. The inset of Fig. 2a shows the HRTEM image (fringes image) of the prepared OCDs, which displayed a d-spacing of 0.34 nm. Fig. 2b shows that OCDs presented a size range of 2–6.32 nm with an average diameter of 3.38 nm. The inset of Fig. 2a shows a lattice fringe image with a d-spacing of around 0.33 nm, which is consistent with the (0 0 2) facet of graphitic carbon.25
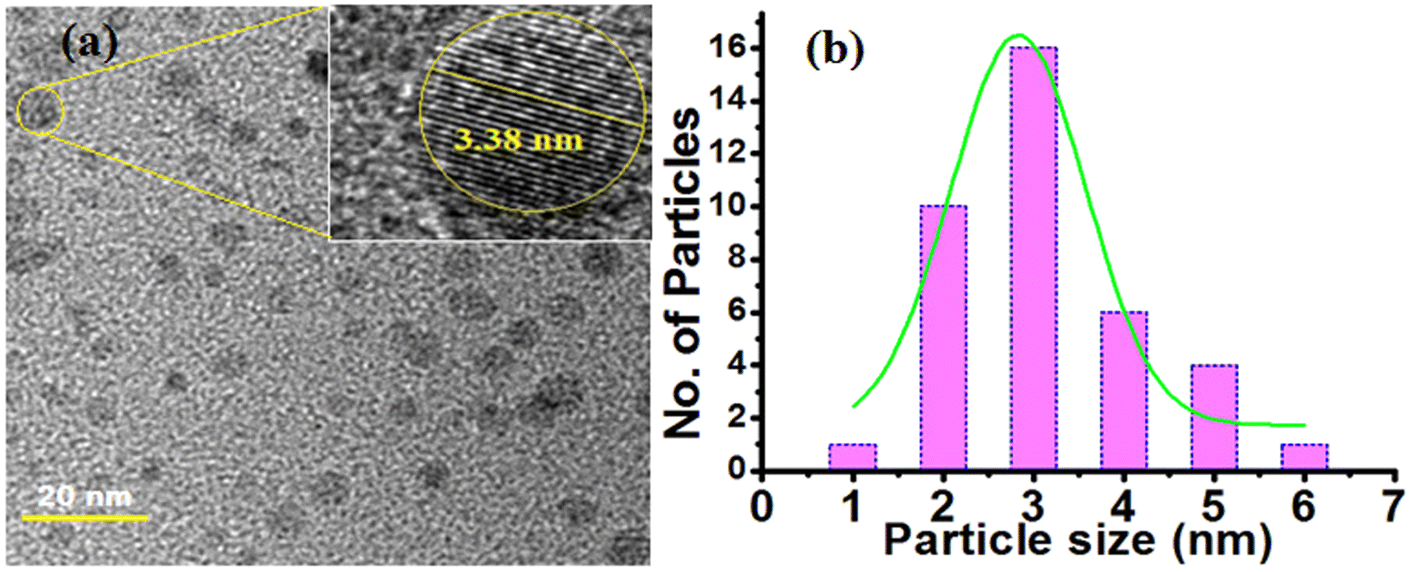 | ||
| Fig. 2 (a) TEM images and inset is the magnified image of HRTEM and (b) the size distribution histogram of OCDs. | ||
OCDs as common detection probes for optical and electrochemical biosensors
Generally, enzyme or redox molecule-conjugated antibody-modified nanoparticles are used as the detection probes for signal amplification in electrochemical immunosensors. In the case of fluorescence assay, a detection signal is obtained via FRET, IFE, PET and DET mechanisms.26 In most fluorescence-based sensing systems, a decrease in fluorescence intensity was observed during detection events. However, a detection probe that amplifies fluorescence intensity during immune-complex formation is desired, which authenticates the reliability of the sensing system. Hence, a common detection probe was designed to amplify the fluorescence and electrochemical responses during the detection of PSA in the fluorescence and electrochemical biosensors, respectively.Smartphone-paper-based optical sensor
Paper-based optical biosensors have attracted significant attention owing to their rapid and cost-effective analyses.27 Furthermore, a paper-based sensing matrix integrated with smartphone-based measurement facilitates point-of-care analysis biosensors not only for monitoring and diagnosing cancer but also for other diseases.28 In this work, PNP-modified paper was used to immobilize antibodies, followed by PSA and detection probe binding. Different concentrations (5, 10, 25, 50, 100, and 120 ng ml−1) of PSA standard were used to bind to the sensor surface. Then, the sensor was irradiated under a UV lamp. During the UV irradiation of the sensor circles, a photographic image was captured, and its intensity (RBG) was used to obtain the calibration curve with respect to PSA concentration (Scheme 2).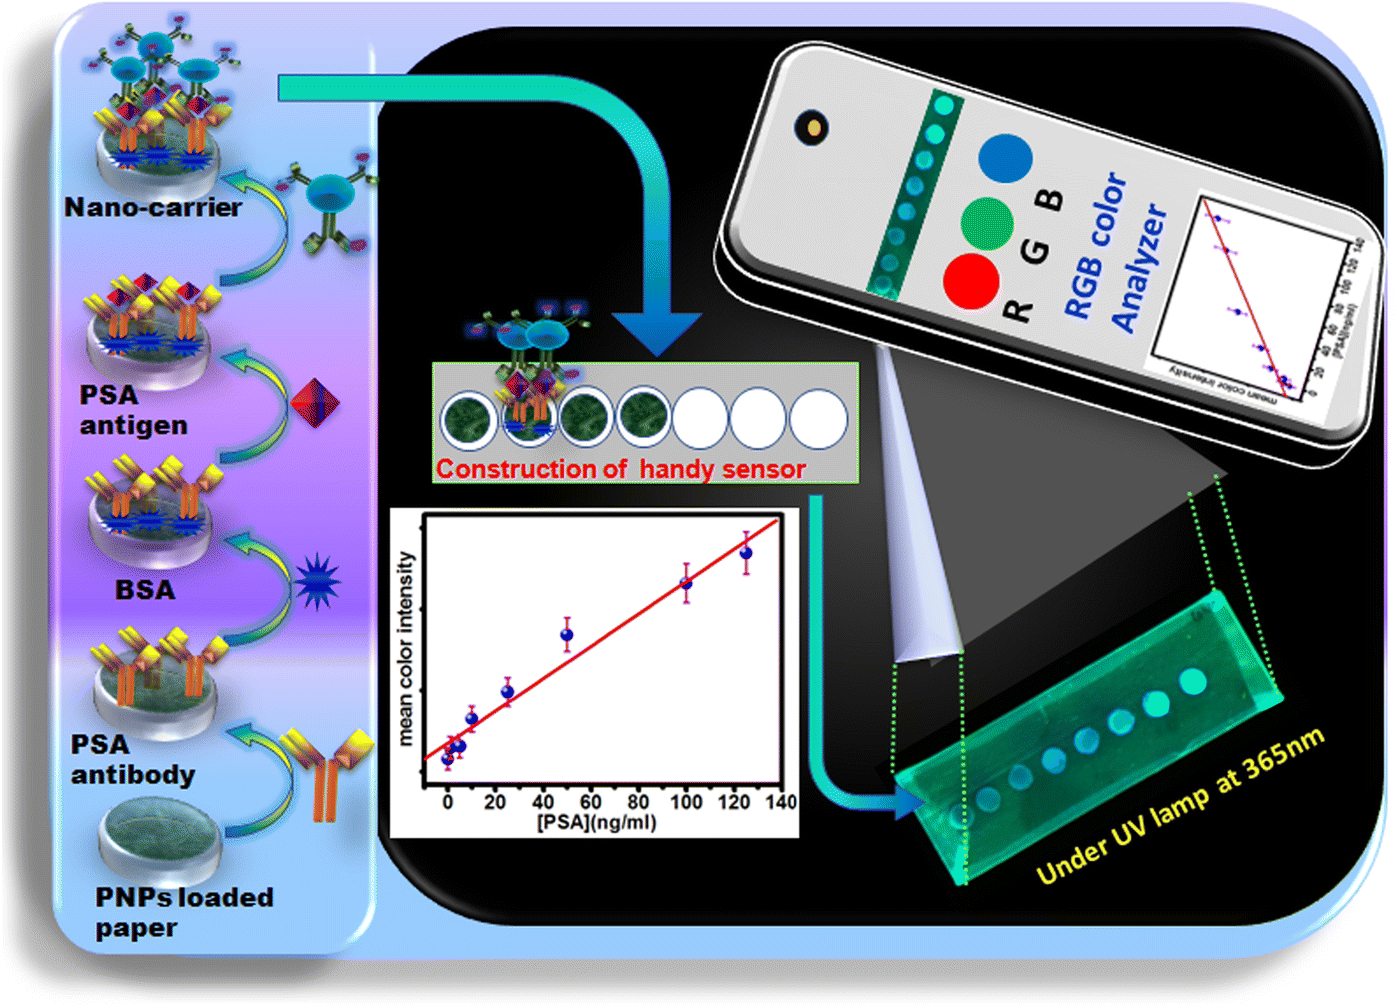 | ||
| Scheme 2 Schematic representation of smartphone paper-based optical sensors for the detection of PSA cancer biomarkers. | ||
Significance of OCDs in FIA
To recognize the presence of PSA on the sensor circles, OCDs@PSAAbHRP was used as the detection probe. The significance of OCDs as the fluorescence tag was evaluated by carrying out several experiments on the sensor circles during sensor construction, and a photographic image was captured under a UV lamp. Photographic images of sensor circles with (a) PNPs, (b) PNPs-PSAAbcap, (c) PNPs-PSAAbcap-PSA, (d) PNPs-PSAAbcap-PSA-PSAAbHRP and (e) PNPs-PSAAbcap-PSA-OCDs@PSAAbHRP under UV lamp are shown in Fig S3 (ESI†). For samples (a) to (d), no blue emission was observed under the UV lamp owing to the non-fluorescence nature of the biomolecules bound on the paper. However, blue emission was observed after the binding of the OCD-based detection probe on the PSA bound sensor circles. This is due to the fluorescent nature of OCDs conjugated with PSA antibodies. In this assay, OCDs not only acted as the carrier for recognition antibody but also acted as the fluorescence tag to produce intense blue emission during immune-complex formation on the sensor circles. This signifies the importance of FL signal generation originating from OCDs.29Detection of PSA using FIA
With different concentrations of PSA, the fluorescence intensity of the PNP-modified paper-based immunosensor gradually increased to blue (Fig. 3a) with increasing concentrations of PSA antigen (5–120 ng ml−1), as shown in Fig. 3b. These results encouraged us to develop a smartphone-paper-based user friendly sensing system for potential biomedical applications. Photographs of the detection zone were captured using a smartphone camera under UV illumination, and the image was analysed using ImageJ software (Scheme 2). For a quantitative estimation, a graph was generated by plotting the mean color intensity of the OCDs obtained via ImageJ software against the concentration of PSA (Fig. 3a). The sensor afforded a wide linear range (5–120 ng ml−1) with low LOD (55 pg ml−1) and LOQ (0.18 ng ml−1) for PSA detection, which is suitable for clinical evaluation for prostate cancer diagnosis. The linear range observed in the present work is better than that reported for paramagnetic beads conjugated with streptavidin,30 SiO2 NPs,31 and MoS2-g-C3N4 nanosheets-chitosan-Au NP32-based systems. A comparison of various optical biosensor systems reported in the literature for the detection of PSA is compiled in Table S1 (ESI†). Researchers have used a combination of many materials32 to afford fluorescence properties. However, the present method utilized cost-effective bio-derived carbon dots as a fluorescence tag and carrier. Further, the simple smartphone-based detection for the immunoassay makes the method cost-effective for point-of-care applications.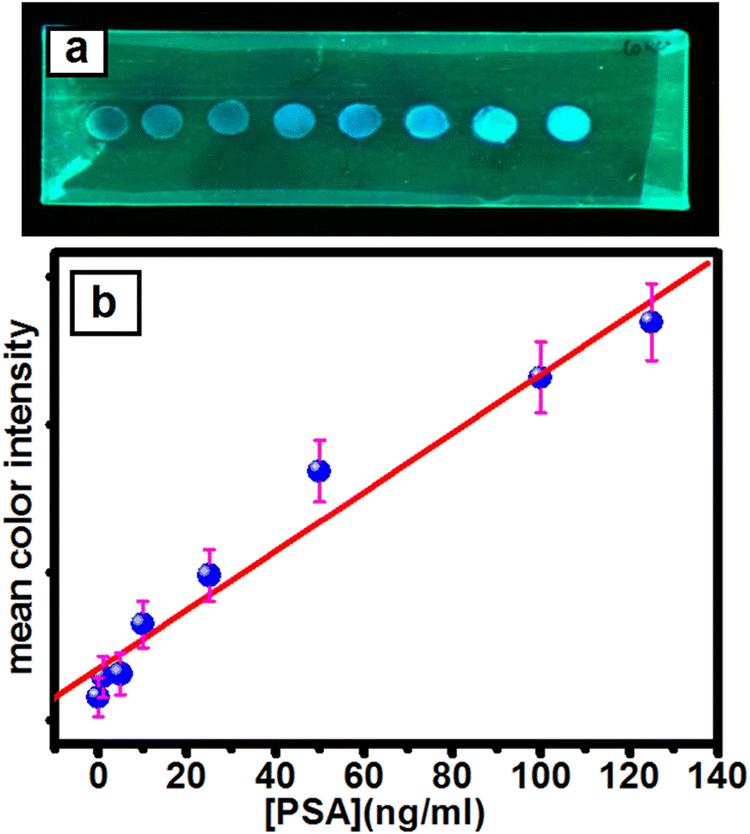 | ||
| Fig. 3 Smartphone-paper-based colorimetric sensor, analysed using ImageJ software to plot the (a) photographic image captured under UV lamp with the excitation wavelength at 365 nm. (b) Calibration curve for the mean color intensity of OCDs vs. the concentration of PSA antigen. | ||
Electrochemical biosensor
An electrochemical sandwich biosensor was constructed for the detection of PSA using PNPs as an immobilization matrix and OCDs@PSAAbHRP as a detection probe. Optimization of experimental conditions, such as the concentration of redox mediator (HQ) and substrate (H2O2), is important for conducting electrochemical detection, which is elaborated in ESI† (optimization of experimental conditions, Fig. S4). The optimum concentration of the redox mediator and substrate for electrochemical detection were 3 mM HQ and 4 mM H2O2, respectively.Mechanism for signal amplification
To understand the catalytic efficiency of PSAAbHRP on the surface of OCDs and the immobilization capacity of OCDs, several cyclic voltammetric studies were carried out in PBS (pH 7.4). To decipher the role of OCDs in enhancing the performance of the sensor, detailed studies were carried out with HRP-modified OCDs to mimic the HRP-tagged antibody (PSAAbHRP), which was used in the immunoassay. HRP is an oxidoreductase and heme containing enzyme used in immunoassays because it catalyses the reduction of H2O2.33 In HRP, the active site heme is buried deep in the polypeptide macromolecules, which forms an insulating layer and eventually impedes direct electron transfer between the enzyme and electrode.34,35 However, freely diffusing electron transfer mediators, such as hydroquinone, can shuttle electrons between the active site of the enzyme and the electrode surface during the electro-catalytic reaction between HRP and H2O2.36 Hence, to elaborate on the role of the mediator, the electro-catalytic property of HRP-modified OCDs (OCDs@HRP) over PNP SPE (SPE-PNPs-OCDs@HRP) was evaluated by cyclic voltammetry in the presence of H2O2 with and without redox mediator HQ (Fig S5, ESI†). As depicted in Fig S5 (ESI†), in the absence of HQ, no redox peak was observed for SPE-PNPs-OCDs@HRP in PBS, and no change in the current was observed during the addition of H2O2. However, in the presence of HQ, a typical redox peak and a significant increase in the reduction current were observed during the addition of H2O2. This clearly dictates that a redox mediator is required for the present system. To understand the specificity of the enzyme, CV was carried out for OCDs over PNP-modified SPE (without HRP) in the presence of HQ containing PBS with and without the addition of H2O2. Electrode without HRP did not display an increase in reduction current, whereas the electrode with HRP showed a significant increase in the reduction current owing to the electro-catalytic reduction of H2O2 by HRP in the presence of redox mediator HQ. This finding confirms that the increase in the current is only due to the HRP present in the system and not due to the matrix and OCDs, the probe carrier. Furthermore, different amounts of HRP (0.1, 0.5 and 1 mg ml−1) were loaded on OCDs, and its electro-catalytic property towards H2O2 reduction was studied. Fig. 4a shows the CV of SPE-PNPs-OCDs@HRP in PBS containing HQ and different concentrations of H2O2. CV displayed a significant increase in the reduction current during the addition of H2O2, which is due to the reduction of H2O2 by HRP bound to the OCDs (Fig. 4a). Electrode modified using 1 mg ml−1 HRP displayed higher reduction current, sensitivity, wider linear range and low detection limit than other modified electrodes (Table S2, ESI†).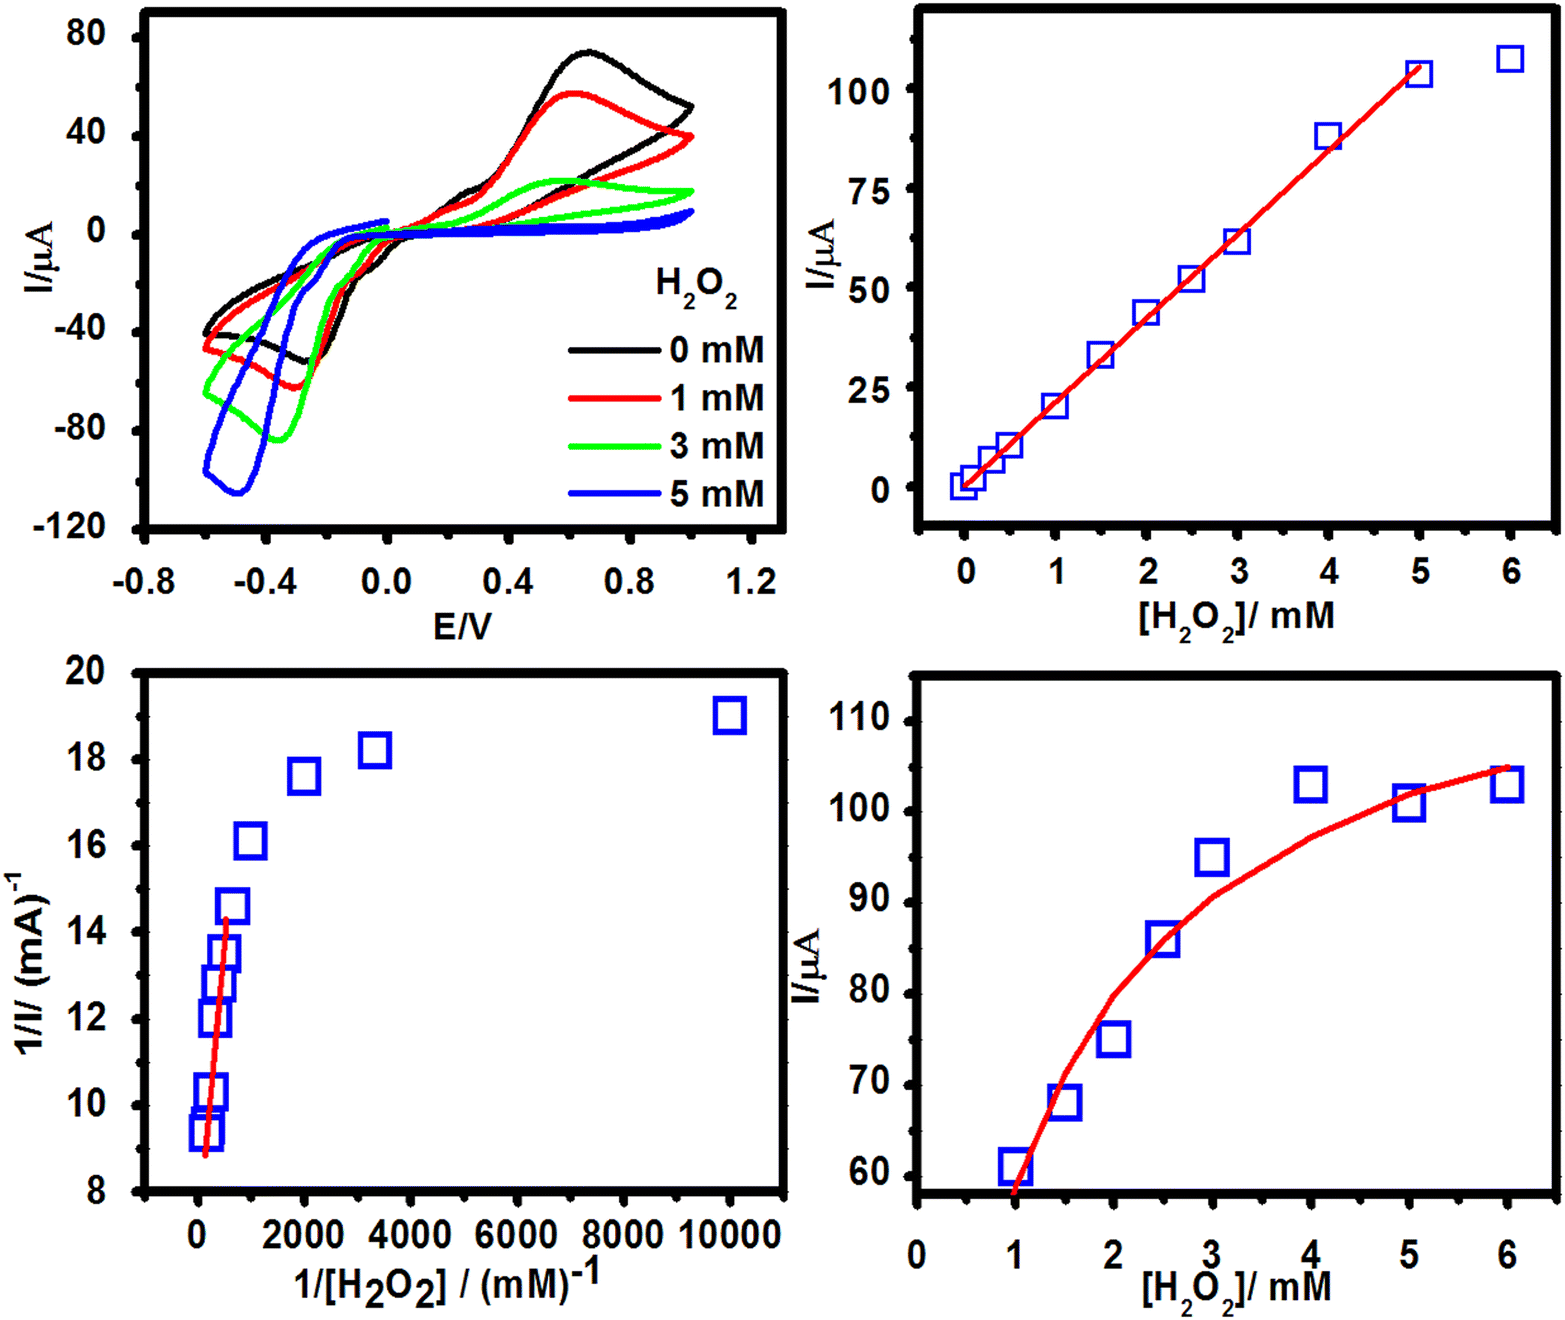 | ||
| Fig. 4 (a) CV curves of PNPs-OCDs@HRP in PBS with an increasing concentration of H2O2 in 3 mM HQ at a scan rate of 50 mV s−1 ranging from 1 to −0.6 V vs. Ag/AgCl and (b) cyclic voltammetric reduction current response in 3 mM HQ at a scan rate of 50 mV s−1 ranging from 1 to −0.6 V vs. Ag/AgCl of PNPs-OCDs@HRP towards H2O2 addition. (c) Lineweaver–Burk plot for a current response of PNPs-OCDs@HRP towards H2O2 addition, and (d) cyclic voltammetric reduction current response towards H2O2 addition with the fitted curve based on the Michaelis–Menten equation. | ||
OCDs could accommodate large amounts of HRP and facilitate the electro-catalytic reduction of H2O2. The normalized current response towards H2O2 addition (Fig. 4a and b) follows a typical Michaelis–Menten behaviour showing linearity in the lower concentration range and saturation at a higher concentration of H2O2 (Fig. 4c). A linear relationship was observed between the reciprocal of current response and the reciprocal of H2O2 concentration (1/C) in the concentration range of 0.1–2 mM. Evaluation of the data based on the Lineweaver–Burk equation gave a Michaelis–Menten constant (Km) value of 1.93 mM, which is lower than that reported in the literature for some of the H2O2 biosensors.37 A lower value of Km for the OCDs@HRP biosensor indicates a higher binding affinity of the immobilized HRP with H2O2, resulting in improved electro-catalytic activity.38 These results confirm the efficiency of OCDs as nano-carriers for loading enzymes in biosensing applications. To tap the efficiency of the OCDs, HRP-conjugated antibody functionalized OCDs were designed and used as the detection probe in the sandwich electrochemical biosensor for PSA detection.
In most sandwich electrochemical biosensors, an enzyme-conjugated antibody is used to produce the signal during the detection event in the presence of a substrate and freely diffusing an electron transfer redox mediator. Furthermore, the obtained signal can be amplified by loading the enzyme-conjugated antibody on nano-carriers. Hence, to understand the signal amplification strategy, several CVs were recorded in PBS containing 3 mM HQ in the absence and presence of H2O2 for (a) immobilization matrix, (b) antibody bound immobilization matrix, (c) PSA immuno-complex bound matrix, (d) sandwich sensor with PSAAbHRP and (e) sandwich sensor with OCDs@PSAAbHRP. As depicted in Fig. 5, it is observed that none of the electrodes showed an increase in reduction current, except for the sandwich sensor with PSAAbHRP and OCDs@PSAAbHRP (Fig. 5d and e). The signal obtained is attributed to the HRP present in the sensor, which reduces the substrate H2O2 in the presence of redox mediator hydroquinone. Moreover, the sensor with OCDs@PSAAbHRP displayed a 3 times higher reduction current (27 μA) than that of the PSAAbHRP bound electrode (9 μA), indicating the immobilization efficiency of OCDs (Fig. 5e).
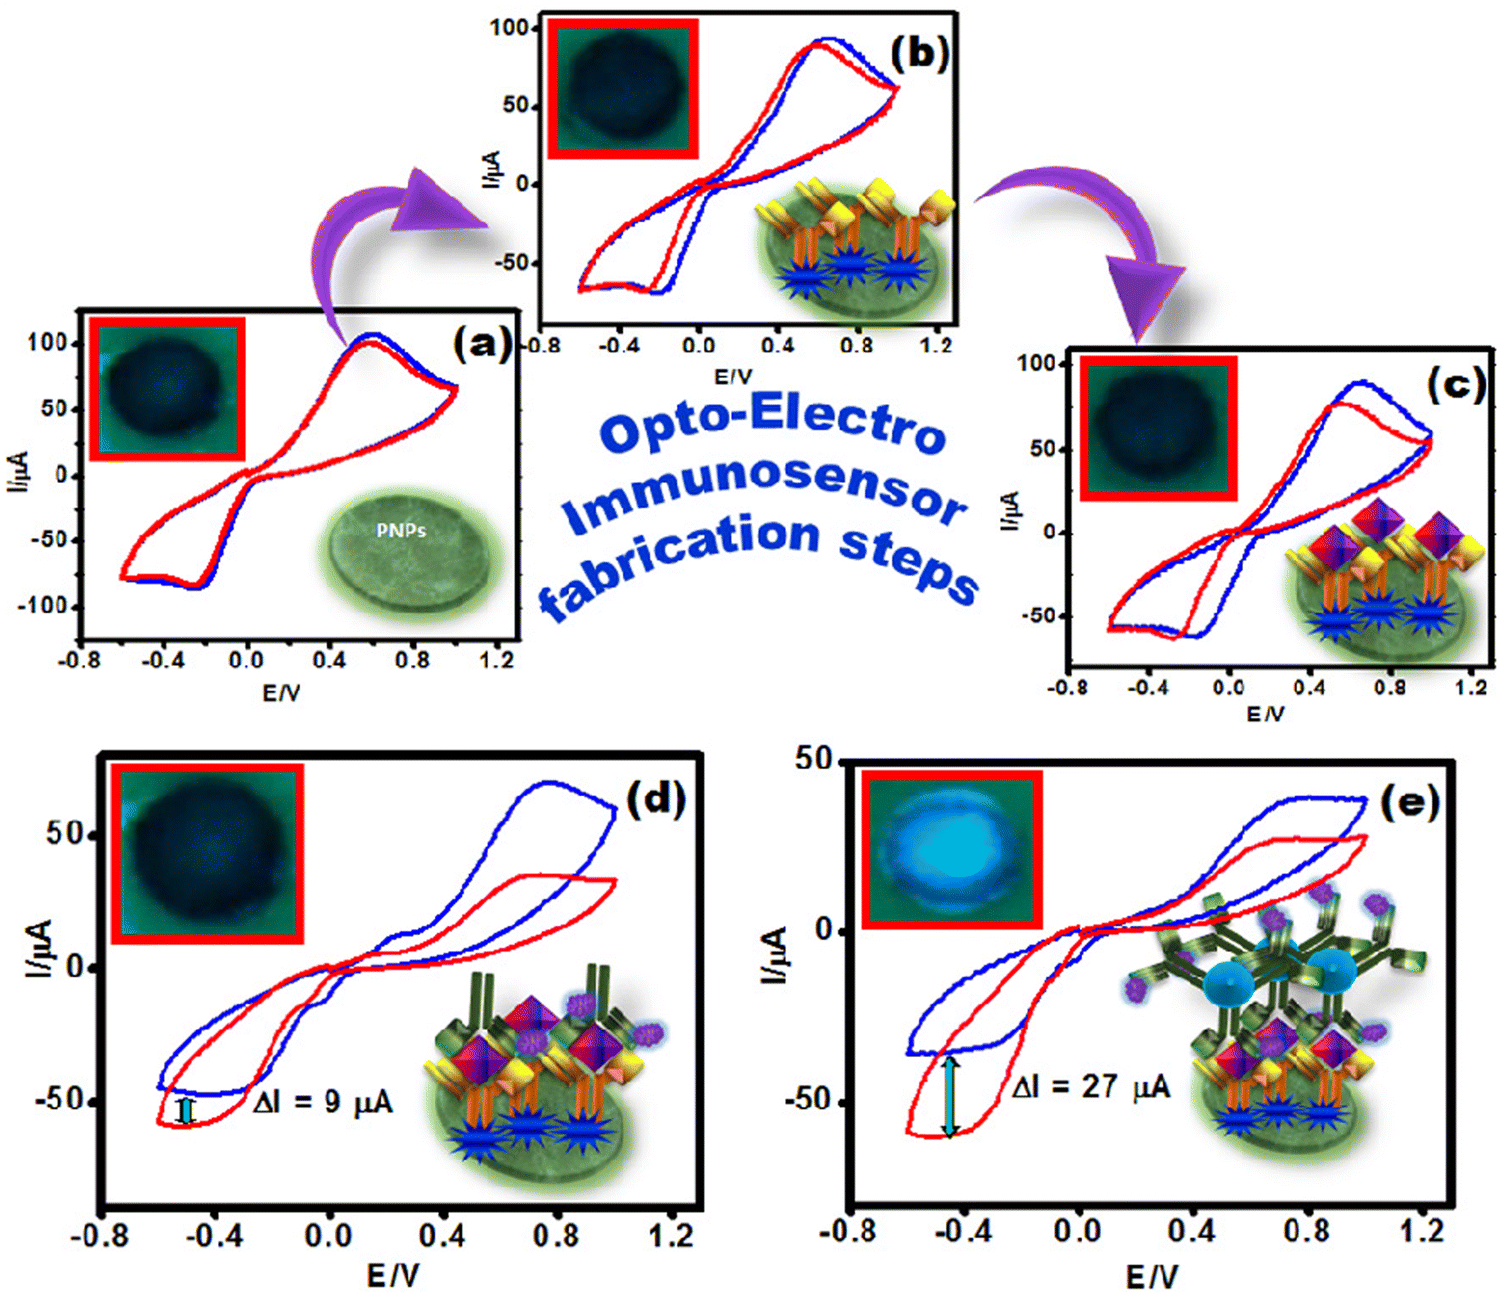 | ||
| Fig. 5 Cyclic voltammetry during the construction of biosensor (a) SPE-PNPs, (b) SPE-PNPs-PSAAbcap, (c) SPE-PNPs-PSAAbcap-PSA, (d) SPE-PNPs-PSAAbcap-PSA-PSAAbHRP, and (e) SPE-PNPs-PSAAbcap-PSA-OCDs@PSAAbHRP in PBS containing 3 mM HQ (blue) and 4.5 mM H2O2 (red) at 50 mV s−1 from 1 to −0.6 V vs. Ag/AgCl (inset: corresponding photographic images of sensor circles under UV lamp [FIA]). | ||
Sandwich biosensor for the detection of PSA
A sandwich immunosensor was fabricated by following multiple steps, as depicted in the schematic in Scheme 1, and PSA sensing was carried out using chronoamperometry measurements. Under optimal conditions, when OCDs@PSAAbHRP was used as the detection probe, the amperometric current of the PSA biosensor increased linearly with an increase in the concentration of PSA (Fig. S6, ESI† and Fig. 6a). The amperometric current response was proportional to the PSA in the concentration range of 0.1–100 ng ml−1 (Fig. 6b).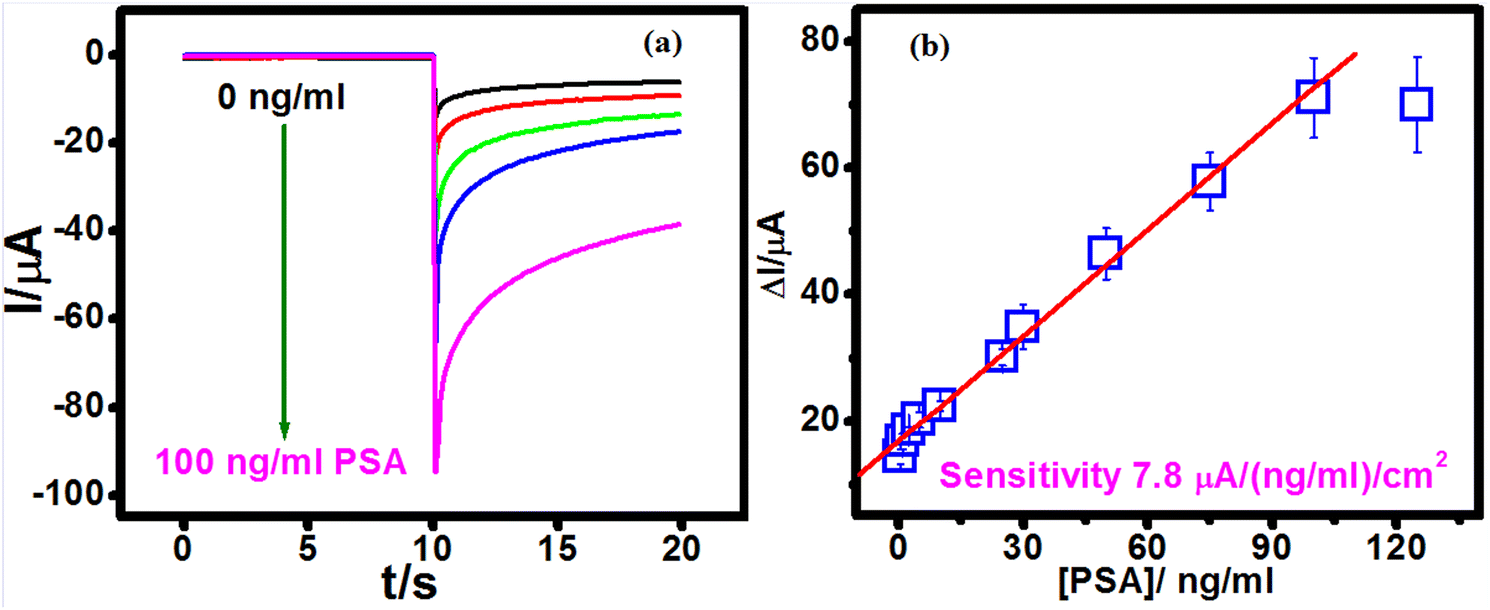 | ||
| Fig. 6 (a) Amperometric curves of OCD@PSAAb2 detection probe-based PSA biosensor in the presence of 3 mM HQ and 4.5 mM H2O2 at different concentrations of PSA and (b) the calibration plot for the OCD@PSAAbHRP-based PSA biosensor. | ||
OCD present in the detection probe accommodated a large amount of HRP-conjugated antibody and sensitized the immuno-reaction between the detection probe and antigen, facilitating sensitive detection (7.8 μA ng−1 ml−1 cm−2). Furthermore, the sensor provided a low detection limit of 38 pg ml−1 for PSA detection (at S/N ratio of 3). This linear range is better than graphene oxide39 and CNT-chitosan40-based immunosensors and comparable to Au nanospindles41-based biosensors for PSA detection. Furthermore, the LOD of the proposed work is better than most works reported in the literature (Table S3, ESI†).
Interference, stability and reproducibility evaluation of PSA biosensor
An interference study was carried out by incubating typical interfering species that exist in serum, including cancer biomarkers (e.g. Alphafetoprotein [AFP], carcinoembryonic antigen [CEA]), common proteins (e.g. BSA and FBS), amino acids (L-cysteine, L-Cyst, L-arginine, L-Arg), uric acid (UA) and ascorbic acid (AA). As depicted in Fig. 7a, it is observed that the current response for interfering species was significantly less compared to the response for PSA, reflecting the high specificity of the sensor towards PSA. To assess the stability of the sensor, continuous CV scans for 100 cycles were performed for the PSAAbcap bound sensor electrode in PBS containing 3 mM HQ (Fig. S7, ESI†). The cathodic peak current observed was almost consistent with less than a 4% decrease after 100 cycles, indicating good stability of the proposed biosensor (Fig. 7b). Furthermore, the reproducibility of the PSA biosensor was examined by measuring the response for 10 ng ml−1 PSA in six sensor electrodes. All the six biosensors prepared independently afforded a consistent response with a relative standard deviation (RSD%) of 5.7%, signifying good reproducibility of the biosensor (Fig. 7c).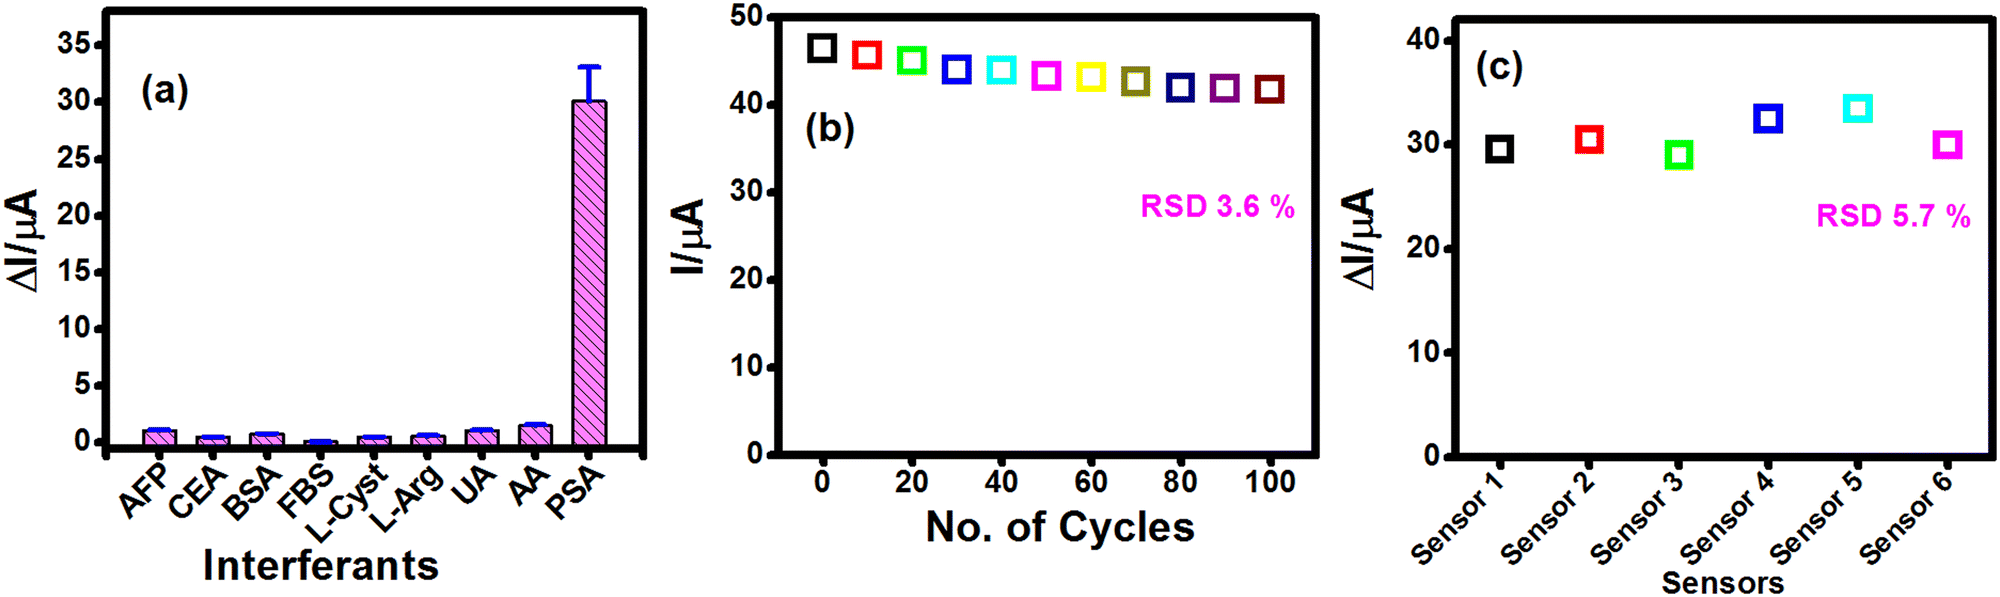 | ||
| Fig. 7 (a) Specificity studies of the biosensor in the presence of AFP, CEA, BSA, FBS, L-cysteine, L-arginine, AA, and UA; (b) cathodic current obtained from PSAAbcap-bound immobilization matrix during cyclic voltammetry for 100 cycles in PBS containing HQ, and (c) the response of 6 different biosensors to 10 ng ml−1 of PSA. | ||
Analysis of PSA in the serum sample
The serum sample was analysed using the designed immunosensor to demonstrate its sensing capability in clinical applications. The serum sample-incubated sensors were studied by applying CA and FL measurements, and the PSA concentration was calculated using the respective calibration curves (Fig. 6b). Table S4 (ESI†) shows the PSA measured by the designed immunosensors (using FIA and ECIA) and conventional chemiluminescent immunoassay (CLIA), indicating that the designed immunosensors can afford consistent performance in clinical sample analysis. Consequently, standard solutions of different amounts of PSA (5 and 10 ng ml−1) were spiked into the serum sample, and PSA was detected using FIA (Table S5, ESI†) and ECIA (Table S6, ESI†). As shown in Tables S5 and S6 (ESI†), excellent recovery (99.3 to 111%) of PSA was obtained using the proposed sensors, emphasizing reliability and capability in using it in a clinical assay for cancer diagnostics.PNPs contain a dense –NH2 group on their surface owing to the presence of poly(ethyleneimine). This facilitates the binding of a large amount of antibody on its surface, affording a wider linear range to the detection system. Although there are several reports on PNP-based sandwich electrochemical biosensors, most of them utilize combinations of various nanomaterials, such as graphene, carbon nanotubes, and metal nanoparticles, as the sensing matrix to improve immobilization efficiency. However, multi-component systems always require tedious synthesis protocols and systematic optimization as the performance of the constructed sensor relies on the nature, composition and spatial orientation of the individual components. Hence, a densely functionalized sensing platform constructed using a single functional material is highly desirable for biosensing applications, as demonstrated in the present work. CDs have been extensively used in sensing applications mainly owing to their optical properties. However, in the present work, CDs have been utilized as the common detection probe for fluorescence and electrochemical immunoassays by utilizing their functional surface and fluorescence properties. In ELIA, CDs acted as the functional nanocarrier by accommodating a large amount of antibodies on its surface, whereas in FIA, CDs acted as the nanocarrier and fluorescence tag for the immunoassay.
Conclusion
A blue emissive S-doped carbon dot was synthesized by hydrothermal treatment of the onion extract. The resulting particles were nearly spherical with ∼3 nm diameter and possessed amino, hydroxyl, sulfur and carboxylic functional groups on the surface. Its fluorescence property, surface functional groups and immobilization efficiency have enabled the design of a detection probe common for fluorescence and electrochemical immunoassays for PSA detection. FIA and ECIA performed using a polyethylenimine stabilized polyaniline nanoparticle-based sensing matrix, and the OCD-based detection probe provided a wide linear range (5–120 ng ml−1 and 0.1–100 ng ml−1) and high sensitivity (LOD 55 and 38 pg ml−1) for PSA detection. In FIA, carbon dots played a dual role as a carrier and fluorescence tag along with antibodies. Furthermore, FIA enabled simple paper and smartphone-based detection, which has the potential as a cost-effective point-of-care testing device. In ECIA, the OCD-based detection probe provided a 3 times higher response compared to conventional antibody, which is attributed to a higher amount of HRP-tagged antibody bound to the OCD-based probe. Enhancing the catalytic property of the probe by OCDs was confirmed using the Km value obtained for the OCDs@HRP-based mimic system, which showed the efficient binding of biomolecules on OCDs and its effective interaction with the substrate. FIA and ECIA were used to detect PSA in the serum samples, which gave consistent results compared to the conventional CLIA method. Owing to its high sensitivity, good specificity, simplicity, reliability and cost-effectiveness, the carbon quantum dot-based bimodal bio-analytical system demonstrated herein is a promising candidate for clinical analysis in point-of-care settings.Author contributions
JK contributed to methodology, investigation, formal analysis, writing-original draft and visualization; ACA contributed to methodology, formal analysis, and investigation, writing-original draft; AB contributed to investigation and validation; SNS contributed to conceptualization, writing – review & editing and supervision.Conflicts of interest
The authors declare no competing interests.Acknowledgements
Authors are thankful to Mr Asheesh Kumar, Chemistry Division, Bhabha Atomic Research Centre for EDX measurements.Notes and references
- S. Saini, Cell. Oncol., 2016, 39, 97 CrossRef CAS PubMed
.
- S. N. Topkaya, M. Azimzadeh and M. Ozsoz, Electroanalysis, 2016, 28, 1402 CrossRef CAS
- X. Li, Y. Lu and Q. Liu, Talanta, 2021, 235, 122726 CrossRef CAS PubMed
- H. Shang, X. Zhang, M. Ding and A. Zhang, Talanta, 2023, 260, 124584 CrossRef CAS PubMed
- S. N. Baker and G. A. Baker, Angew. Chem., Int. Ed., 2010, 49, 6726 CrossRef CAS PubMed
- J. Y. Hou, J. Dong, H. S. Zhu, X. Teng, S. Y. Ai and M. L. Mang, Biosens. Bioelectron., 2015, 68, 20 CrossRef CAS PubMed
- W. Wang, J. Chen, D. Wang, Y. Shen, L. Yang, T. Zhang and J. Ge, Anal. Methods, 2021, 13, 789 RSC
- Z. Kang and S. T. Lee, Nanoscale, 2019, 11, 19214 RSC
- H. Seema, K. C. Kemp, N. H. Le, S. W. Park, V. Chandra, J. W. Lee and K. S. Kim, Carbon, 2014, 66, 320 CrossRef CAS
- S. A. Wohlgemuth, F. Vilela, M. M. Titirici and M. Antonietti, Green Chem., 2012, 14, 741 RSC
- W. Kiciński, M. Szala and M. Bystrzejewski, Carbon, 2014, 68, 1 CrossRef
- Y. Zhi, Z. Yao, G. Li, G. Fang, H. Nie, Z. Liu, X. Zhou, X. Chen and S. Huang, ACS Nano, 2012, 1, 205 Search PubMed
- W. Wang, Z. Zeng, G. Zeng, C. Zhang, R. Xiao, C. Zhou, W. Xiong, Y. Yang, L. Lei, Y. Liu, D. Huang, M. Cheng, Y. Yang, Y. Fu, H. Luo and Y. Zhou, J. Chem. Eng., 2019, 378, 122132 CrossRef CAS
- W. Kwon, J. Lim, J. Lee, T. Park and S. W. Rhee, J. Mater. Chem. C, 2013, 1, 2002 RSC
- C. A. Amarnath, N. Venkatesan, M. Doble and S. N. Sawant, J. Mater. Chem. B, 2014, 31, 5012 RSC
- N. A. Sagar, S. Pareek, N. Benkeblia and J. Xiao, Front. Food Nutr. Res., 2022, 3, 380 CAS
- J. Korram, P. Koyande, S. Mehetre and S. N. Sawant, ACS Omega, 2023, 34, 31410 CrossRef PubMed
- Y. Liu, Y. Liu, S.-J. Park, Y. Zhang, T. Kim, S. Chae, M. Park and H.-Y. Kim, J. Mater. Chem. A, 2015, 3, 17747 RSC
- N. Puvvada, B. N. P. Kumar, S. Konar, H. Kalita, M. Mandal and A. Pathak, Sci. Technol. Adv. Mater., 2012, 13, 045008 CrossRef PubMed
- J. Zhang, W. Shen, D. Pan, Z. Zhang, Y. Fang and M. Wu, New J. Chem., 2010, 34, 591 RSC
- X. Zhai, P. Zhang, C. Liu, T. Bai, W. Li, L. Dai and W. Liu, Chem. Commun., 2012, 48, 7955 RSC
- X. Tang, H. Wang, H. Yu, B. Bui, W. Zhang, S. Wang, M. Chen, L. Yuan, Z. Hu and W. Chen, Mater. Today Phys., 2022, 22, 100576 CrossRef CAS
- J. Korram, L. Dewangan, R. Nagwanshi, I. Karbhal, K. K. Ghosh and M. L. Satnami, New J. Chem., 2019, 43, 6874 RSC
- L. Dewangan, J. Korram, I. Karbhal, R. Nagwanshi and M. L. Satnami, ACS Appl. Nano Mater., 2021, 12, 13612 CrossRef
- G. Niu, F. Gao, C. Li, Y. Wang, H. Li and Y. Jiang, J. Mater. Chem. B, 2023, 11, 8916 RSC
- M. P. Sousa, A. M. L. Piloto, A. C. Pereira, F. C. Schmitt, R. Fernandes and F. T. C. Moreira, Chemosensors, 2022, 10, 518 CrossRef CAS
- R. Jiang, Y. Zhang, Q. Zhang, L. Li and L. Yang, ACS Appl. Nano Mater., 2021, 9, 9760 CrossRef
- K. J. Goswami, A. Boruah and N. S. Sarma, ACS Appl. Nano Mater., 2023, 12, 10191 CrossRef
- S. Reagen, Y. Wu, X. Liu, R. Shahni, J. Bogenschuetz, X. Wu, Q. R. Chu, N. Oncel, J. Zhang, X. Hou, C. Combs, A. Vasquez and J. X. Zhao, ACS Appl. Mater. Interfaces, 2021, 37, 43952 CrossRef PubMed
- J. Chong, H. Chong and J. H. Lee, Anal. Biochem., 2019, 564, 102 CrossRef PubMed
- R. M. Kong, X. Zhang, L. Ding, D. Yang and F. Qu, Anal. Bioanal. Chem., 2017, 409, 5757 CrossRef CAS PubMed
- F. Duan, S. Zhang, L. Yang, Z. Zhang, L. He and M. Wang, Anal. Chim. Acta, 2018, 1036, 121 CrossRef CAS PubMed
- C. A. Amarnath and S. N. Sawant, Electroanalysis, 2020, 32, 2415 CrossRef CAS
- M. Dequaire, B. Limoges, J. Moiroux and J. M. Savéant, J. Am. Chem. Soc., 2002, 2, 240 CrossRef PubMed
- W. Gao, H. Eastwood and X. Xia, J. Mater. Chem. B, 2023, 11, 8404 RSC
- C. A. Amarnath and S. N. Sawant, Microchim. Acta, 2021, 188, 403 CrossRef PubMed
- W. H. Abdulaal, Y. Q. Almulaiky and R. M. El-Shishtawy, Catalysts, 2020, 10, 181 CrossRef CAS
- B. Thakur, C. A. Amarnath and S. N. Sawant, RSC Adv., 2014, 4, 40917 RSC
- Y. Wang, Y. Qu, G. Lui, X. Hou, Y. Huang, W. Wu, K. Wu and C. Li, Microchim. Acta, 2015, 11, 2061 CrossRef
- F. Tahmasebi and A. Noorbakhsh, Electroanalysis, 2016, 28, 1134 CrossRef CAS
- N. Sattarahmady, A. Rahi and H. Heli, Sci. Rep., 2017, 7, 11238 CrossRef PubMed
Footnotes |
| † Electronic supplementary information (ESI) available: The details of the materials and characterization techniques are given in supplementary information. Additional experimental findings, including FTIR of OCDs; comparison table of analytical performances of optical method that are reported in other literature; cyclic voltammetric response of matrix with and without hydroquinone and H2O2; analytical properties of SPE-PNPs-OCDs@HRP vs. [H2O2]; optimization of experimental conditions (such as hydroquinone and H2O2 concentration); amperometric curves of constructed biosensor in different concentrations of PSA in PBS containing 3 mM HQ and 4.5 mM H2O2; comparison table of analytical performances of electrochemical immunosensors for the detection of PSA and table with PSA concentration in human serum sample determined by FIA, ECIA and conventional CLIA and its spike-recovery of PSA. See DOI: https://doi.org/10.1039/d3tb02090h |
| ‡ Equal contribution. |
| This journal is © The Royal Society of Chemistry 2024 |