
 Open Access Article
 This Open Access Article is licensed under a Creative Commons Attribution-Non Commercial 3.0 Unported Licence
A Mo–salicylaldehyde-linker (Mo–Tp) based 2D MOF as a single-atom catalyst for the nitrogen reduction reaction†
Hassan A.
Alhadidi Almheiri
 ad,
Nirpendra
Singh
bd,
Dinesh
Shetty
*cd,
Kyriaki
Polychronopoulou
de and
Ali A.
Alhammadi
*ad
ad,
Nirpendra
Singh
bd,
Dinesh
Shetty
*cd,
Kyriaki
Polychronopoulou
de and
Ali A.
Alhammadi
*ad
aDepartment of Chemical Engineering, Khalifa University of Science and Technology, P.O. Box 127788, Abu Dhabi, United Arab Emirates. E-mail: ali.aalhammadi@ku.ac.ae
bDepartment of Physics, Khalifa University of Science and Technology, P. O. Box 127788, Abu Dhabi, United Arab Emirates
cDepartment of Chemistry, Khalifa University of Science and Technology, P. O. Box 127788, Abu Dhabi, United Arab Emirates
dCenter of Catalysis and Separation, Khalifa University of Science and Technology, Main Campus, Abu Dhabi, United Arab Emirates
eMechanical Engineering Department, Khalifa University of Science and Technology, Main Campus, P.O. Box 127788, Abu Dhabi, United Arab Emirates
First published on 23rd February 2024
Abstract
Two-dimensional (2D) materials for the electrocatalytic nitrogen reduction reaction (NRR) can offer a groundbreaking and sustainable alternative to the traditional Haber–Bosch process. Two-dimensional metal–organic frameworks (2D MOFs) have the potential to serve as single-atom catalysts (SACs), enabling the utilization of active metal centers up to 100% in the eNRR and also capable of reducing the HER effectively. This work outlines the screening of a new series of TM–Tp 2D MOFs (where Tp = 1,3,5-triformylphloroglucinol; TM = Cu, Ni, Cr, Mo, Os, Ru, and W) for the NRR, using density functional theory. Two screening stages based on the activation of the N2 molecule and stabilization of the NNH intermediate showed that the Mo–Tp MOF monolayer is the most viable catalyst to be studied further. Mo–Tp shows outstanding stability and high potency towards being an efficient NRR catalyst with high selectivity. An investigation of the NRR pathway showed a limiting potential (UL) of −0.38 V in the distal pathway. Furthermore, the theoretical faradaic efficiency (FEt) is 100% towards the NRR. Our findings show that Mo-based 2D MOFs exhibit outstanding performance as NRR catalysts.
1 Introduction
The discovery of the Haber–Bosch process marks a pivotal moment in human history, enabling the large-scale production of ammonia (NH3) from nitrogen gas (N2). Evidently, NH3 is the second highest-produced chemical worldwide finding applications in the production of fertilizers, chemicals, and pharmaceuticals.1 Nevertheless, the Haber–Bosch process has significant drawbacks, requiring high temperatures (300–500 °C) and pressures (10–30 MPa).1 In fact, it accounts for 1–2% of the global energy consumption, highlighting the pressing need for alternative approaches today.The electrocatalytic nitrogen reduction reaction (NRR) has attracted a lot of research interest due to its ability to produce NH3 under ambient conditions.2 The NRR can harness renewable energy and transform NH3 to an intermediate of energy storage eliminating the need for hydrogen (H2) as an intermediary. However, the NRR suffers from incompetence due to the low faradaic efficiencies and competition coming from the parasitic hydrogen evolution reaction (HER).3 In a recent review article by our group4 the design criteria for efficient NRR catalysts have been critically discussed as well as experimental protocols that need to be followed for the validation of the reaction. Part of addressing NRR drawbacks is the investigation of the reaction mechanism with/without engaging isotopic studies and/or computational tools4 over the most efficiently designed electrocatalysts.
Metal–organic frameworks (MOFs) have the potential to become efficient NRR catalysts because they have an active metal site surrounded by built-in tunable organic ligands.4 Their applications in the NRR have yet to be fully exploited. The flexibility of metal-center variation and control over building block selection allows precision in targeting nitrogen activation in MOFs. Unfortunately, even the most porous MOFs face grand challenges of access to their active sites. One strategy to overcome these limitations involves harnessing reduced dimensionality within MOF systems by exfoliating a single monolayer5 to expose the active sites and reduce the diffusion distance to reactants.
Two-dimensional (2D) MOFs are promising materials, compared with their bulk 3D MOFs because they exhibit enhanced electrical conductivity through conjugation, decreased electron transfer, and better exposure of the active sites.6,7 The tunability of 2D MOFs at the molecular level makes them excellent single atom catalysts (SACs) for the NRR.7 Recently, a salicylaldehyde-based 2D MOF film was reported with unique coordination of the functional groups in a new series of copper-based 2D MOFs.8 Moreover, they benefit through their scalability compared to other MOFs due to possessing an economical molecular building block.8
A plethora of metal centers (e.g. Ru, Pd… etc.) including molybdenum (Mo) have been advocated in literature as suitable NRR catalysts.9 Mo atoms help promote NH3 production naturally in biological nitrogenases.9,10 Cui et al.11 showed a Mo3(HAB)2 2D MOF possessing a low limiting potential of −0.34 V. In a similar study conducted by Feng et al.,12 a Mo3(C2O)12 2D MOF had given an almost similar value with a limiting potential of −0.36 V. The current understanding of how the coordination sphere affects reactivity through different frameworks is limited. It is of interest to investigate an asymmetric coordination sphere such as the one present in salicylaldehyde conjugated MOFs as a means of reducing nitrogen to ammonia.
We propose studying TM–Tp through density functional theory (DFT) computations to investigate different 2D transition metal (TM)–organic frameworks TM–Tp [TM = Cu, Ni, Cr, Mo, Os, Ru, and W; Tp = 1,3,5-triformylphloroglucinol] for the NRR. By investigating the ability of N2 adsorption on MOFs and stabilizing the NNH intermediate, we show that Mo–Tp could be an efficient NRR catalyst. Previously studied Mo-based 2D MOFs have been the result of screened TM-MOF variations with their own screening procedures, such as TM = Co, Ni, Cu, and Mo11 and TM = Sc–Au.12 The limiting potential attained in our 2D Mo–Tp MOF is a competing one of −0.38 V. At most, this study could become a tremendous sequel to previously studied Mo-based 2D MOFs and help build a greater understanding of different organic ligands' roles during selective nitrogen-to-ammonia conversion.
1.1 Computational details
The DFT calculations were performed using the Vienna ab initio simulation package (VASP).13 Van der Waals (vdW) interactions were considered using the DFT-D3 correction14 in our spin-polarized calculations. The generalized gradient approximation (GGA) within the Perdew–Burke–Ernzerhof (PBE)15 functional is used to express the exchange-correlation potential. The projected augmented wave (PAW)16 method is used to describe ion–electron interactions with a cutoff energy of 500 eV. For bulk optimization calculations, a Monkhorst–Pack of 3 × 3 × 3 k-point mesh was used. A Monkhorst–Pack k-point mesh of 7 × 7 × 1 was employed for structural optimization and electronic properties of monolayers. Thermal stability of the Mo–Tp MOF structure was investigated using ab initio molecular dynamics (AIMD) with the canonical (NVT) ensemble.17 The convergence of atomic forces and energy was set to 0.01 eV Å−1 and 10−5 eV respectively. Additionally, a 15 Å vacuum space was added in the z-direction to avoid interactions between periodic images. For the band structure and density of states (DOS) calculations, DFT+U was used.18 The crystal orbital Hamiltonian population (COHP) analysis was carried out using the Lobster package.19 The VASPkit post-processing software was used to deal with electronic properties.20 The VASPsol with an implicit solvation model was used to incorporate solvent effects.21 Gibbs free energy calculations were calculated using the computational hydrogen electrode (CHE) model22 {Note S1†}.2 Results and discussion
2.1 Monolayer isolation from the bulk
The structure of bulk Cu–Tp8 was used as a starting point for building other MOFs and used for further calculations after optimization. Fig. 1a shows the structure of the bulk Cu–Tp system after optimization. The experimental lattice parameters of the Cu–Tp MOF were a = b = 14.5708 Å and c = 9.8014 Å (ref. 8) whereas the DFT values changed to a = b = 14.67286 Å and c = 9.70718 Å. The cell volume and lattice parameters follow an increasing trend compared to that originally in the experiment. The rest of the TM–Tp bulk systems were optimized individually with varying lattice parameters outlined in Table S1.† The intrinsic pore diameter (Dpore) and interlayer distance (n) of each MOF system vary due to changes in the cell volume. However, all systems maintain a similar square planar coordination environment to the pristine Cu–Tp MOF film.8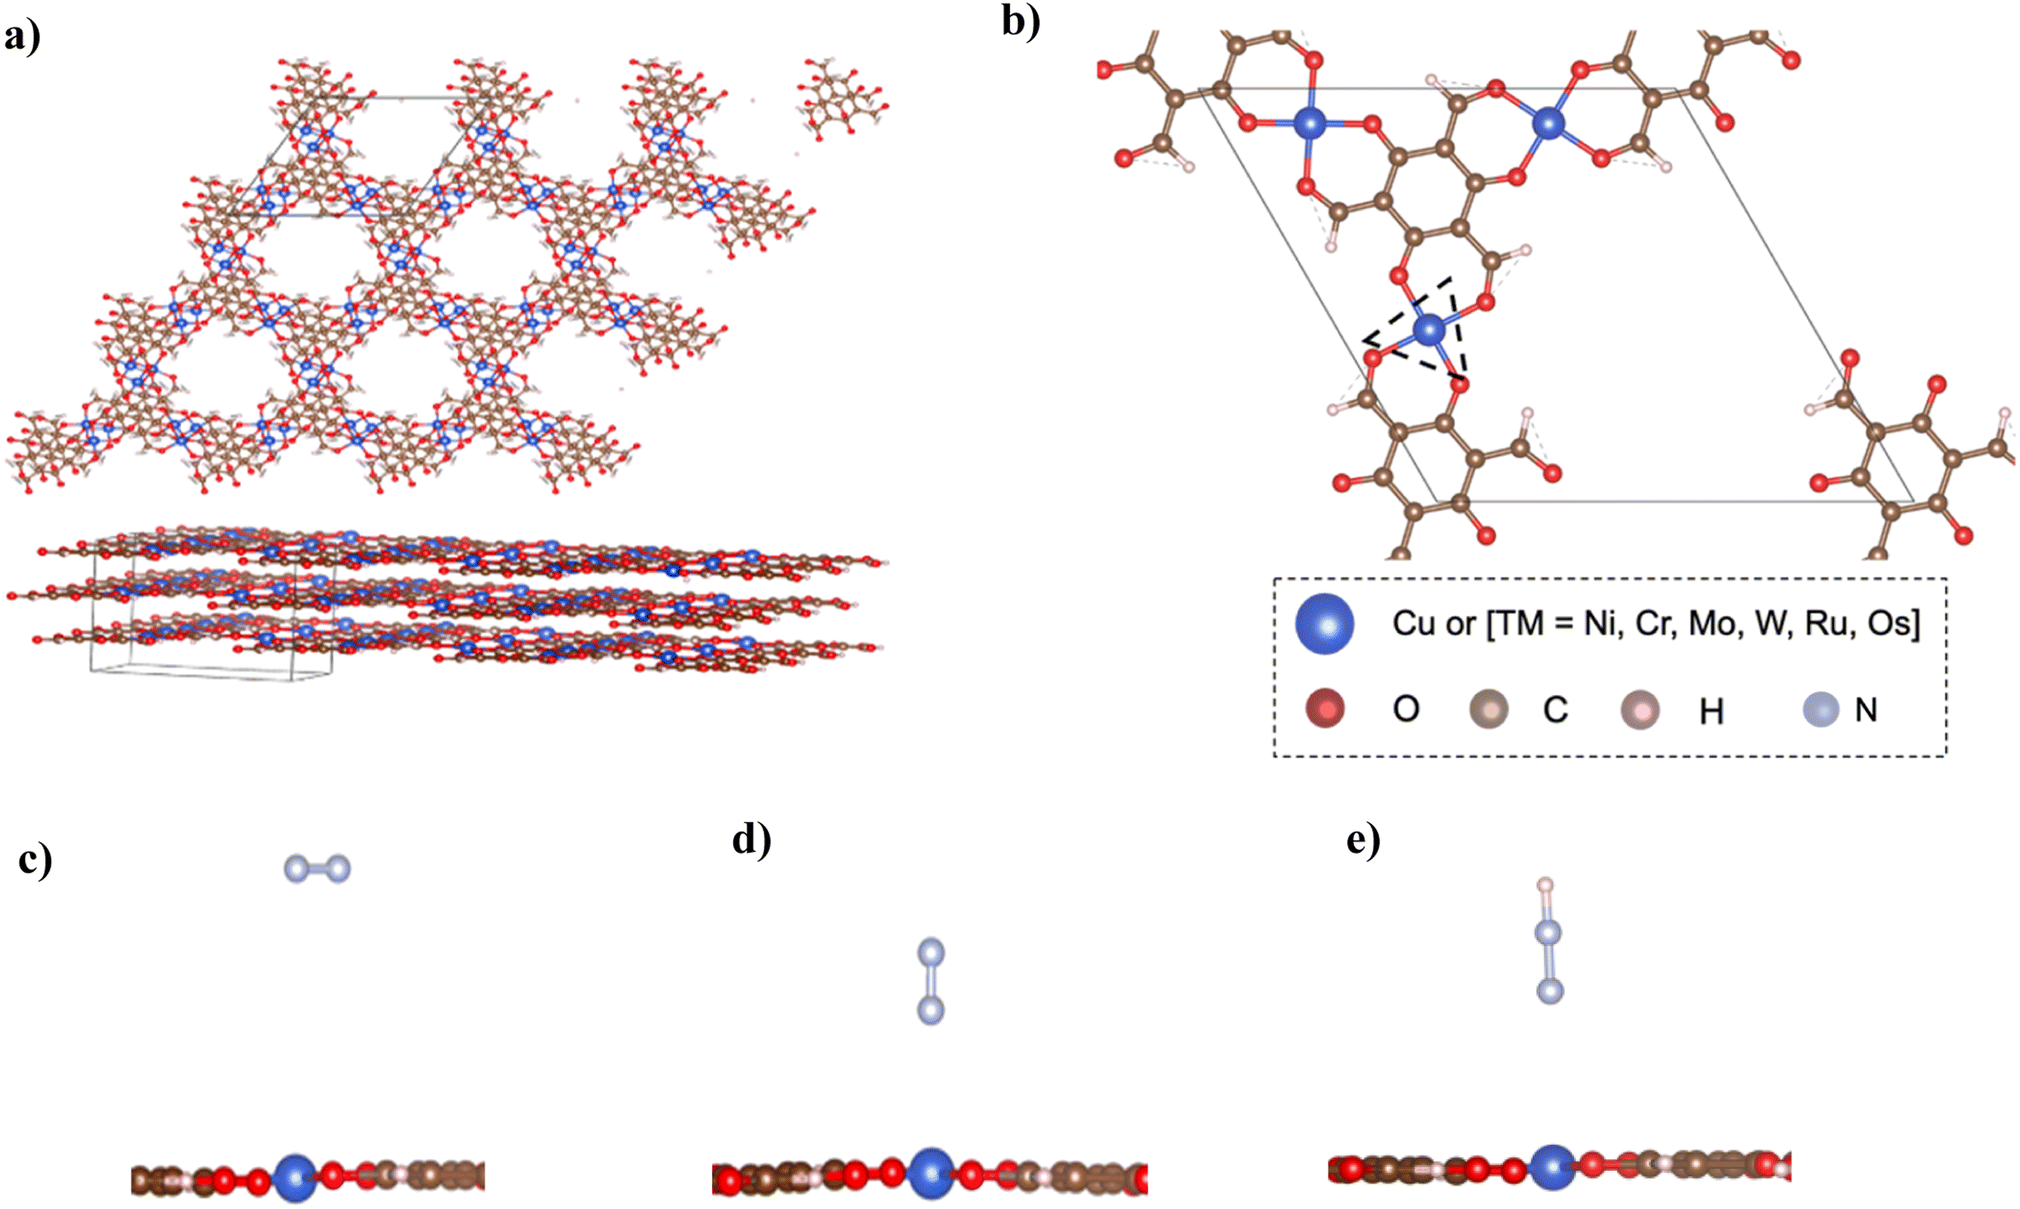 | ||
| Fig. 1 (a) Cu–Tp bulk after optimization with lattice parameters a = b = 14.67286 Å and c = 9.70718 Å. (b) Unit cell of Cu–Tp {the dotted triangle denotes the N2 adsorption location} [blue: TM; brown: C; red: O; pink: H; cyan: N]. (c) Side-on configuration of the N2 molecule on the Cu–Tp MOF monolayer. (d) End-on configuration of the N2 molecule on the Cu–Tp MOF monolayer. (e) The *NNH intermediate adsorbed in the end-on configuration on the Cu–Tp MOF monolayer. | ||
In order to harness the actual benefits of reduced dimensions we consider an exfoliated monolayer in the rest of our DFT simulations. The exfoliation energies were computed as [E(3-layers) − E(2-layers) + E(1-layer)]/A, where E(3-layers), E(2-layers), and E(1-layer) correspond to relaxed energies of 3 layers, 2 layers, and 1 layer of atoms respectively, and A is the exfoliation surface area of the unit cell. The exfoliation energies (Eexf) required to remove a single layer of TM–Tp from the bulk are outlined in Table S2† with ranges 13–44 meV Å−2. The exfoliation energies are only slightly higher than that of graphene.23Fig. 1b shows the unit cell of the isolated monolayer of atoms. The coordination sphere around each atom is an asymmetric one with each metal atom surrounded by four oxygen atoms. The primitive cell contains an atomic formula of TM3(C3O2H)6.
Fig. 2a shows the energy levels of the d-band center of each TM–Tp MOF. The band energy levels are decomposed into spin-up (up) and spin-down (dn) states. As the energy level of the d-band center increases, the antibonding orbitals shift towards the Fermi level.24 The d-band centers of Mo and Cr are located higher across the Fermi level than the other MOF systems. This is consistent with N2 adsorption energies shown later in this work. Magnetism has been used intrinsically to tune the NRR activity of materials.25 This is due to the possible formation of polarized charges around the metal sites which facilitate the activation of N2 molecules. According to Hund's rule, many of the transition metals used in this work possess unfilled d-orbitals. The Ni–Tp MOF is nonmagnetic. The difference in the spin-up and spin-down energy states is causing magnetic moment in Cu, Cr, Mo, Os, Ru, and W in the TM–Tp MOFs. The calculated magnetic moments (μB) are summarized in Table S2.† Fig. S1† illustrates the band gap of different TM–Tp MOFs for both the bulk and monolayer. The simulated band gap of the Cu–Tp monolayer lies in the range of the experimental values, which is 1.6 eV for Cu–Tp.8 The electronic bandgaps increase in monolayers due to quantum confinement.26
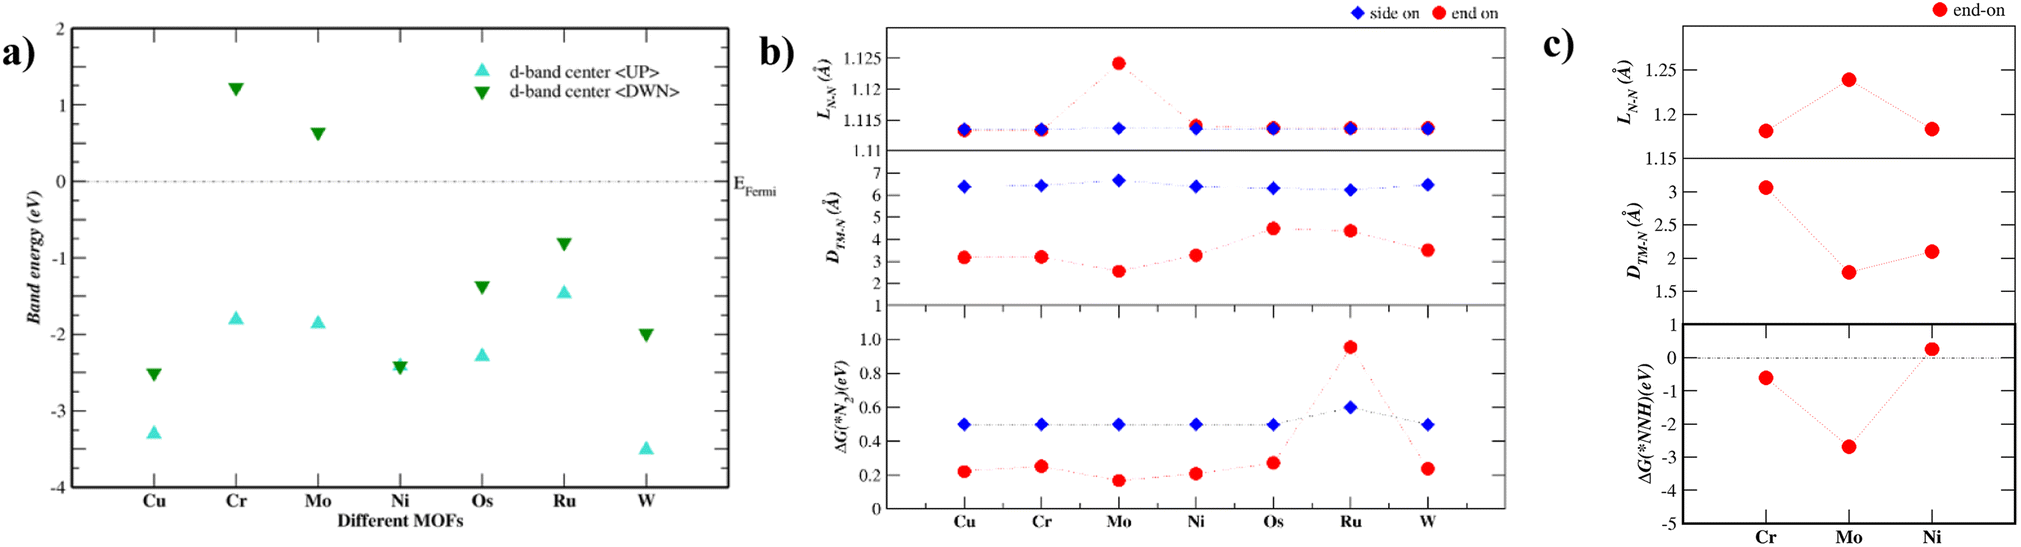 | ||
| Fig. 2 (a) Energy levels of the d-band center in each TM–Tp MOF monolayer system [TM = Cu, Ni, Cr, Mo, Os, Ru, and W] decomposed into spin-up (UP) and spin-down (DOWN) states. (b) The first screening step consisting of the adsorption free energy of N2 {ΔG(*N2)}, the distance between the transition metal (TM) and nearest N atom {DTM–N}, and the N–N bond length {LN–N} for our *N2/TM–Tp MOF systems (c) the second screening step consisting of the adsorption free energy of the NNH intermediate {ΔG(*NNH)}, the distance between the transition metal (TM) and nearest N atom {DTM–N}, and the N–N bond length {LN–N} for our *NHH/TM–Tp MOF systems. | ||
2.2 Screening favorable TM–Tp 2D MOFs for the NRR
Accordingly, we screen NRR electrocatalysts based on their ability to adsorb N2 (ΔGN2) as a first screening layer and the ability to stabilize the NNH intermediate as a second screening layer. These activity descriptors are proposed based on the two most possible potential limiting steps (PLS).26–31 Moreover, Nørskov et al.27,30 showed that the adsorption energy of N2 scales with the rest of the intermediate adsorption energies.The metal active center is usually the active site for the NRR. In our investigation, we consider the metal active centre for N2 adsorption. The side-on and end-on configurations are considered, as shown in Fig. 1c and d, respectively. The reaction step N2 + * ⇒ *N2 is investigated as the first screening step, as shown in Fig. 2b. None of the TM–Tp (TM = Cu, Ni, Cr, Mo, Os, Ru, and W) systems can adsorb nitrogen spontaneously. Mo–Tp possessed the lowest value of ΔGN2 of 0.17 eV; Ni–Tp, Cu–Tp, and Cr–Tp come after that with free energies of adsorption of 0.20 eV, 0.22 eV, and 0.25 eV, respectively. Only Mo–Tp, Ni–Tp, and Cr–Tp proceed to the next stage of the screening process. Selecting Cr–Tp was done instead of Cu–Tp because of the higher energy level occupied by the d-band center.
The stabilization of the NNH intermediate is used as a second step to screen the remaining possible NRR catalysts. The configuration of the NNH intermediate depends on the prior adsorption of the N2 molecule, in our case, we have worked with the end-on configuration of NNH shown in Fig. 1e. The reaction in the first protonation step of N2 is *N2 + H+ + e− ⇒ *NNH. The TM–Tp MOF possessing the lowest value of ΔGNNH was Mo–Tp with a free energy of −2.68 eV in Fig. 2c. Additionally, the N–N bond distance (LN–N) elongates to 1.24 Å and the distance between Mo and N is 1.78 Å. We proceed to investigate Mo–Tp with the N2 molecule in the end-on configuration.
2.3 Stability and electronic structure of Mo–Tp
Having exceptional stability is required for using 2D MOFs as possible NRR electrocatalysts. Mo–Tp has a lattice constant a = b = 15.12 Å, which is slightly larger than that of the Cu–Tp MOF (a = b = 14.57 Å).8 The Mo–O bond length is 2.06 Å and the diameter of each pore (Dpore) is of 13.74 Å. Structural stability is assessed via calculating the cohesive formation energy of the Mo–Tp MOF monolayer. The required binding energy per metallic atom was evaluated for the Mo–Tp monolayer using the equation Eb = [Etot − Eligand − EMo]/3; Etot, Eligand, EMo are the total energy of the unit cell, the energy of an isolated organic ligand, and the energy of an isolated Mo atom respectively. The magnitude of the binding energy (Eb) is −9.24 eV, which is comparable to that of other Mo-based 2D MOFs studied computationally.11,12Thermal stability of the Mo–Tp monolayer is checked using ab initio molecular dynamics (AIMD) in the NVT ensemble at 300 K, 500 K, and 1000 K and for different simulation times (Fig. S2–S4†). Fig. S2† shows the top and side views of the Mo–Tp structure after an AIMD run at 500 K and 2500 fs. There is neither significant distortion of the Mo–Tp monolayer nor was there a breakage of the Mo–O bond at 300 K (Fig. S2†), 500 K (Fig. S2†), and 1000 K (Fig. S3†). Moreover, the energy fluctuations at different temperatures are almost imperceptible meaning no lower-level structures were present during the AIMD runs. Temperatures as high as 1000 K will most likely not be reached due to MOFs getting pyrolyzed. Yet, it is assuring that theoretically the Mo–Tp monolayer possesses excellent thermodynamic stability under different conditions.
The Mo–Tp monolayer has a magnetic moment of 12.0μB and is mainly due to the Mo-atoms. The spin-polarized energy difference was computed through ΔEspin = Emagnetic − Enon-magnetic, where Emagnetic and Enon-magnetic are the energies of the magnetic states and the non-magnetic states, respectively. The magnitude of the spin energy is −1.89 eV which is comparable to that on Mo atoms from reported work.11
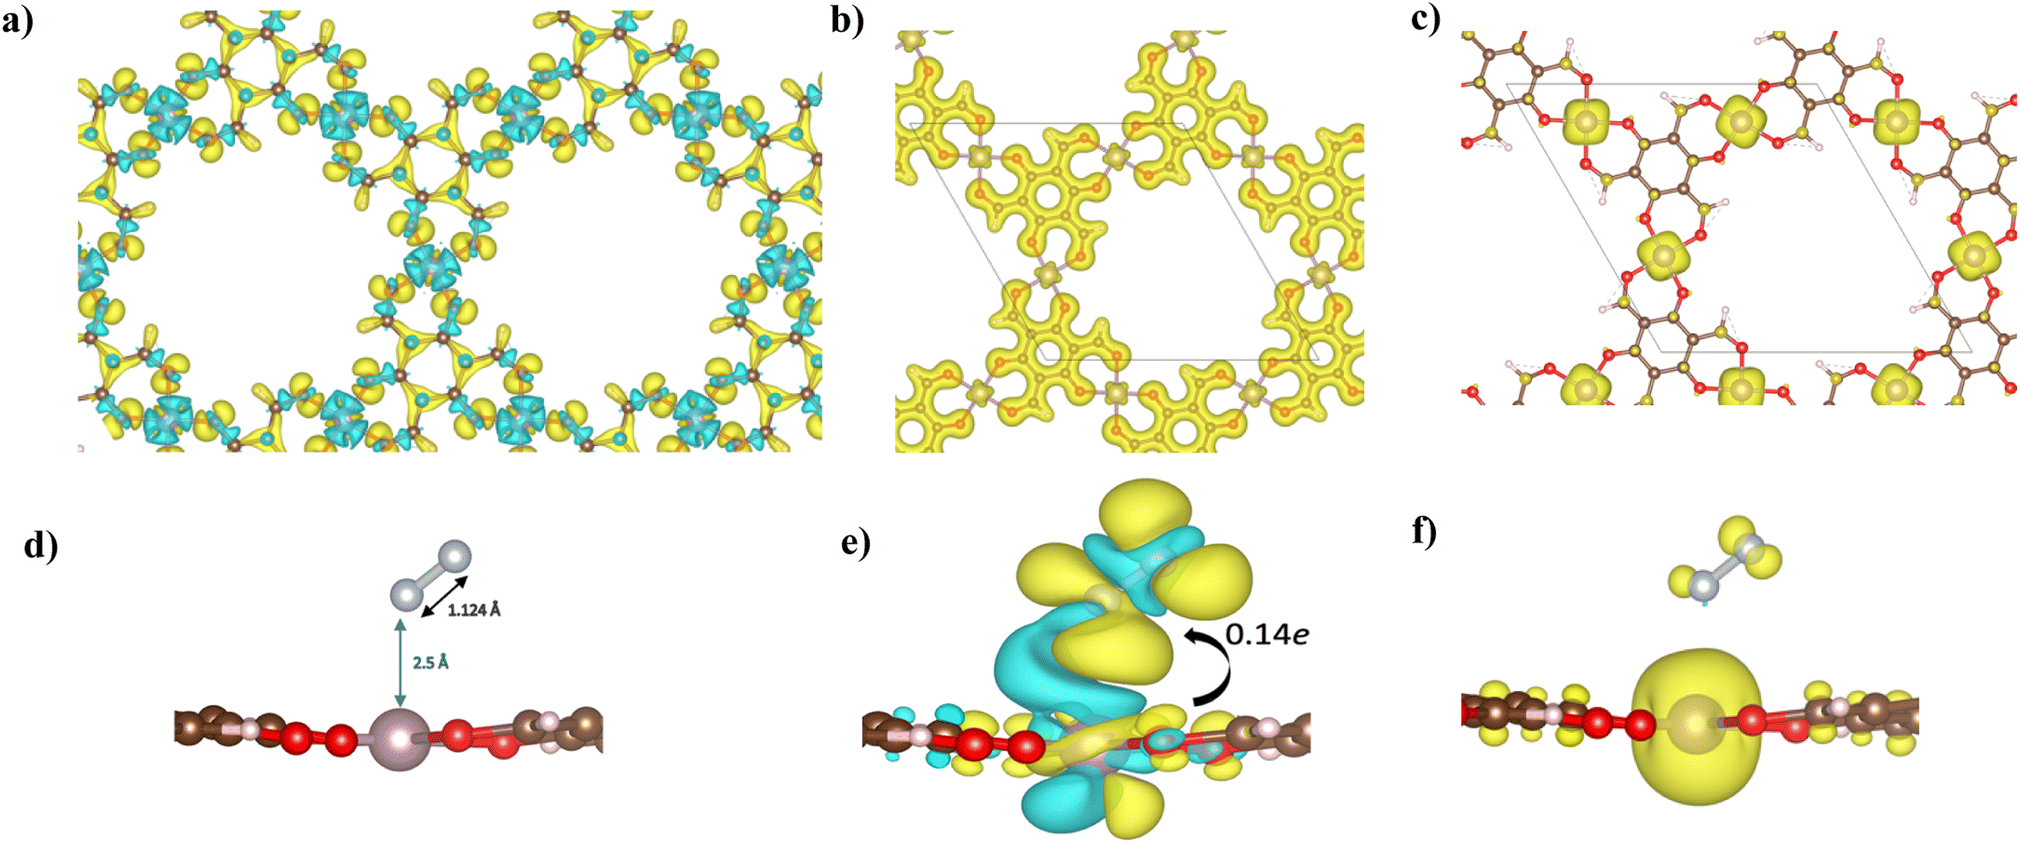
The electronic structure of Mo–Tp was studied through the total density of states (TDOS) and projected density of states (PDOS) of Mo, C, O and H in Fig. 3a and S5.† The asymmetry in the DOS leads to the magnetism in our material. The eg orbitals are present at a higher energy level than the t2g orbitals, consistent with crystal field theory.32 The magnetism of Mo–Tp can be related to the asymmetry of the spin-up and spin-down states.33 Moreover, the charge density difference in Fig. 4a and the crystal orbital Hamiltonian population (COHP) in Fig. 3b show that bonding is a result of the charge donation from Mo-d orbitals to the O-pz orbitals. However C and O interact through their pz orbitals as shown in the DOS in Fig. S5.†
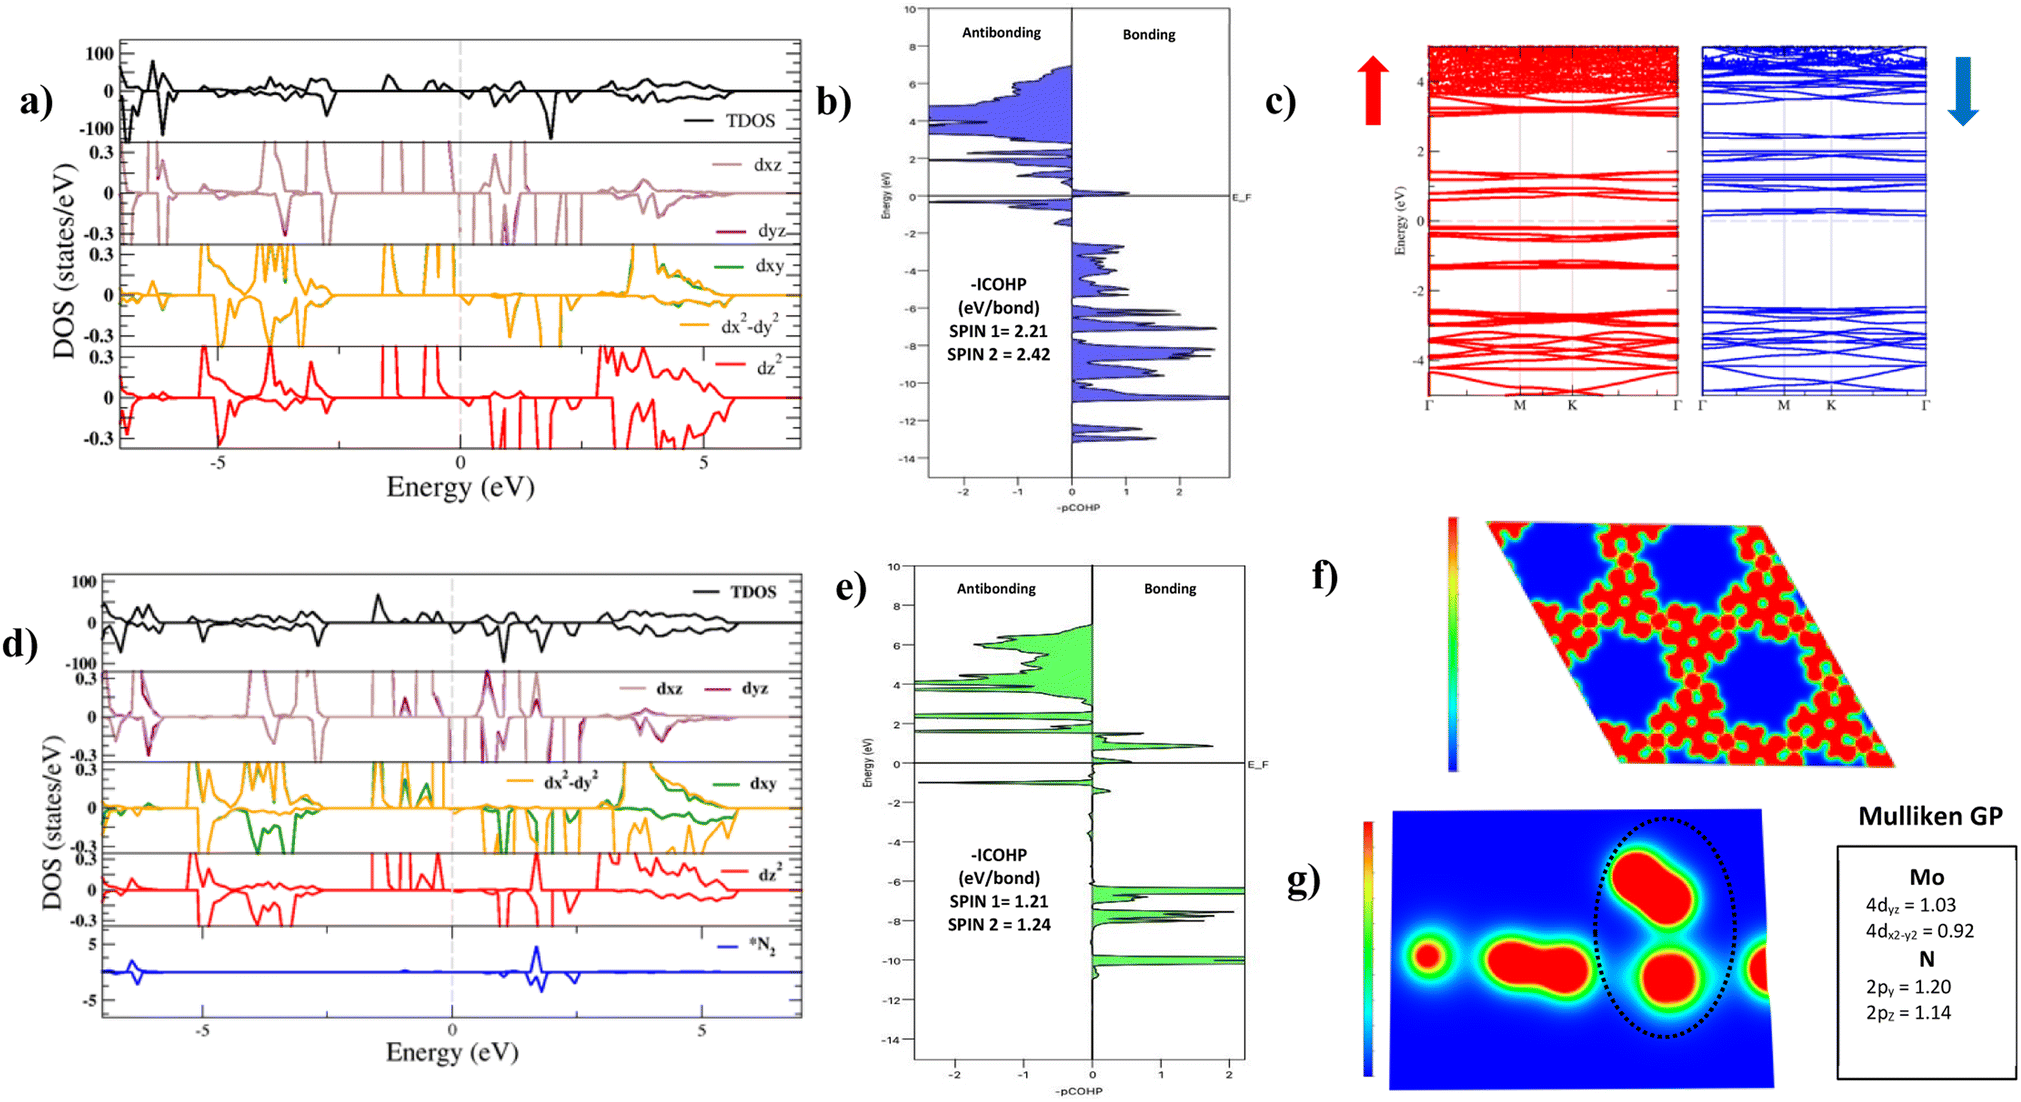 | ||
| Fig. 3 (a) Density of states plot showing the total density of states (TDOS) and projected density of states (pDOS) of Mo, C, O, and H in our Mo–Tp MOF monolayer. (b) Projected crystal orbital Hamiltonian population (pCOHP) between Mo and the nearest O atom. (c) Band structure of the Mo–Tp MOF monolayer decomposed into spin-up (red) and spin-down (blue) states. (d) Density of states plot showing the total density of states (TDOS) and projected density of states (pDOS) of Mo, C, O, H and N in the *N2/Mo–Tp MOF system. (e) Projected crystal orbital Hamiltonian population (pCOHP) between Mo and the nearest N atom in N2. Electron localization function (ELF) mapping of (f) the Mo–Tp MOF monolayer. (g) The *N2/Mo–Tp MOF system in the z-axis with the dominant Mulliken orbital gross population (GP) values. | ||
 | ||
| Fig. 4 (a) Charge density difference, (b) charge density distribution (CDD), and (c) spin density of the Mo–Tp MOF monolayer. (d) Top view of the optimized structure of the adsorbed N2/Mo–Tp MOF monolayer system. (e) Total charge density difference. (f) Spin density of the *N2/Mo–Tp MOF monolayer system. Charge accumulation (+) is shown in yellow while charge depletion (−) is in blue. Similarly, spin-up density is shown in yellow while spin-down density is in blue. Isosurfaces are set to 0.10 a.u. | ||
A uniform distribution of charges is observed in our Mo–Tp conjugated MOF through the charge density distribution (CDD) in Fig. 4b and the electron localization function (ELF) mapping in Fig. 3f. In Table S6† we demonstrate through a charge analysis that Mo loses a charge of 1.40e while O atoms gain a charge of 1.13e. The Mo atom gains a slight positive charge due to charge donation, making it a suitable site for N2 activation. Finally, the electronic structure was studied by plotting the band structure of the spin-up and spin-down states in Fig. 3c. A semi-conducting behaviour of the material was observed, featuring a smaller bandgap in the spin-up states than the spin-down states. A small bandgap value ensures that charge can be donated to the adsorbate species at ease throughout the reaction process.
2.4 Adsorption of the N2 molecule on Mo–Tp
The end-on N2 adsorption is shown in Fig. 4d. The overlap of Mo and N2 states is sufficient to transfer charges between the Mo atom to N2. This claim is supported by the charge density difference (CDD) in Fig. 4e where the Mo atom transfers 0.14e charge to weaken the N2 bond. Charge accumulates on the edges of the N atom allowing it to be easily hydrogenated. The equivalent occurs for depletion (blue) of charges which helps weaken the N2 triple bond. This proves that Mo is able to activate the N2 bond, as shown in previous experimental studies.34The density of states (DOS) and COHP plots in Fig. 3d and e were analysed to uncover the shift of electronic states in the N2/Mo–Tp monolayer system. The pDOS of adsorbed N2 (*N2) shows that the states are shifted lower across the Fermi level in a sense of strengthening the Mo–N bond. A weak overlap of the bonding states is initially observed in the pCOHP analysis between Mo and the nearest N atom. This can be quantitatively assessed through the Mulliken gross orbital population (GP) and −ICOHP values. The ELF mapping of the N2/Mo–Tp system is shown in Fig. 3g. Mulliken GP values in Mo are dominant via the 4dyz and 4dx2–dy2 orbitals, making them the most likely orbitals that hold electrons participating in the charge donation process.
As the NRR progresses, Mo starts to interact with the first N atom. In Fig. S6,† the pCOHP plot of *NNH is shown. The −ICOHP values increase from 1.21 and 1.24 eV per bond to 4.45 and 4.55 eV per bond for the first and second spin channels respectively. This conforms to the strong bonding facilitating between Mo and N during *NNH formation allowing further hydrogenation.
The magnetic state of Mo–Tp shifts from 12.00μB to 11.994μB after N2 adsorption. This indicates that some of the uncoupled electrons contributing to the overall spin have taken part in the bonding process between N2 and Mo. Moreover, the spin density diagrams shown in Fig. 4f indicate spin density change as N2 adsorbs. The depletion of the spin density on the N atom closer to Mo signifies the beginning of a bond formation between Mo and N.35
2.5 Performance of Mo–Tp towards the NRR
Fig. S8† shows alternating and distal mechanisms and their intermediates studied for the Mo–Tp monolayer. The bonding between intermediates and the Mo-atom provides evidence that it is the active site for the NRR. In the alternating mechanism, the N–N bond is broken through the protonation of alternate N atoms successively. Finally, two NH3 molecules are released in succession. The distal mechanism proceeds with the protonation of only one N atom at a time. The N atom located at the further end is first released as NH3, after which the remaining N atom is hydrogenated again until it leaves the surface as an NH3 molecule.The free energy NRR diagrams for both the alternating and distal mechanisms are depicted in Fig. 5a and b, respectively. The first step of N2 adsorption is the same for both mechanisms. The free energy of N2 adsorption is uphill by 0.17 eV with a reaction step N2 + * ⇒ *N2; where “*” refers to being adsorbed on Mo–Tp. Following that is the first hydrogenation step, common for the two mechanisms. The NNH intermediate forms spontaneously with a downhill free energy of 2.854 eV in the reaction step *N2 + H+ + e− ⇒ *NNH. The following reaction steps consist of different intermediates for the distal and alternating pathways.
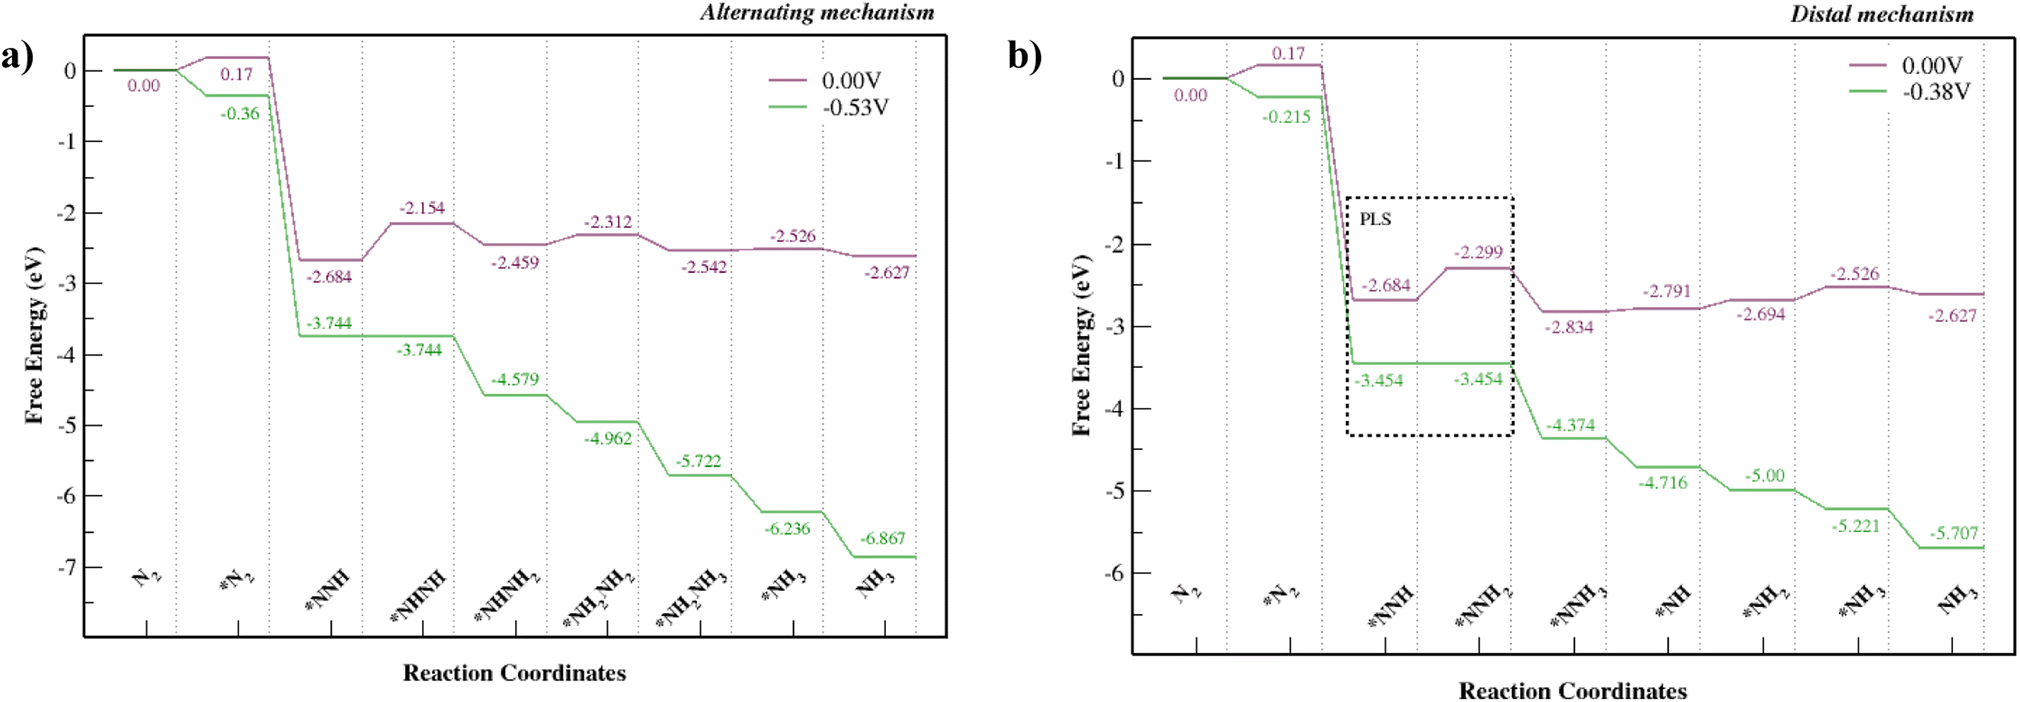 | ||
| Fig. 5 NRR free energy diagrams for the (a) alternating mechanism and (b) the distal mechanism, where * denotes being adsorbed on Mo–Tp MOF. | ||
The potential limiting step for the alternating mechanism consists of hydrogenating the NNH intermediate into NHNH. This step has the largest uphill free energy change ΔGNHNH with 0.53 eV for the reaction *NNH + H+ + e− ⇒ *NHNH. Thus, it sets the limiting potential (UL) for the alternating mechanism as −0.53 V. Next, the free energy change ΔGNHNHH of the reaction step *NHNH + H+ + e− ⇒ *NHNH2 is downhill by 0.31 eV. Following that is the reaction *NHNH2 + H+ + e− ⇒ *NH2NH2 with an uphill free energy change ΔGNHHNHH of 0.15 eV. The first NH3 molecule is released during the reaction *NH2NH2 + H+ + e− ⇒ *NH2NH3 with a downhill free energy change ΔGNHHNHHH of 0.23 eV. Finally, the second NH3 molecule is formed and released from the Mo–Tp surface with a minor uphill free energy change ΔG*NH3 = 0.016 eV in the corresponding reaction step *NH2 + H+ + e− ⇒ *NH3.
The potential limiting step for the distal mechanism is the formation of NNHH from the NNH intermediate. This step is the highest uphill distal free energy change ΔG*NNHH by 0.38 eV for the reaction *NNH + H+ + e− ⇒ *NNHH. It sets the limiting potential (UL) for the distal mechanism as −0.38 V. Next, the free energy change ΔG*NNHHH of the formation step *NNHH + H+ + e− ⇒ *NNH3 is downhill by 0.53 eV. This is also where the first NH3 molecule forms and leaves the remaining N atom on the Mo–Tp surface. Protons then attach to the remaining N atom with an uphill free energy change ΔG*NH of 0.043 eV in the reaction step *NNH3 + H+ + e− ⇒ *NH + NH3. Following that is the reaction step *NH + H+ + e− ⇒ *NH2 with an uphill free energy change ΔGNHH of 0.097 eV. Finally, the second NH3 molecule forms during the reaction *NH2 + H+ + e− ⇒ *NH3 with an uphill free energy change ΔG*NHHH of 0.17 eV. The desorption of NH3 from the Mo–Tp surface occurs similarly for both the distal and alternating mechanisms. The free energy change corresponding to the desorption of ammonia ΔGNHHH is slightly uphill by 0.009 eV with the reaction step *NH3 ⇒ NH3 + *. This means the active sites free up more N2 molecules to form ammonia.
The lowest limiting potential (UL) is at a value of −0.38 V and corresponds to the distal mechanism. Therefore, the path that the NRR would proceed in to form ammonia is via the distal mechanism. The overpotential (η) can be computed using the equation η = Ueq − UL, where Ueq corresponds to the equilibrium potential for the NRR and is at a constant value of −0.16 V according to Zhao et al.36 We consider a UL value of −0.38 V and obtain an overpotential of 0.22 V. Considering some of the Mo-based NRR catalysts36–46 and other benchmark NRR catalysts35,47–59 with limiting potentials UL = [−0.35 ⇔ −0.71, the Mo–Tp monolayer is considered one of the best catalysts for the NRR. It shows similar proficiency towards being a good NRR catalyst to the other Mo-based 2D MOFs.11,12
2.6 Analysis of selectivity
The greatest challenge faced by NRR catalysts is the parasitic HER.3 A selectivity analysis needs to be carried out on the competitive adsorption process between nitrogen and the hydrogen proton. The Mo–Tp MOF monolayer consists of an additional O–CH group which could bring in H protons due to forces of hydrogen bonding. Therefore, we have considered three possible adsorption sites: the Mo atom, the carbon atom in the O–CH group (C1), and the carbon atom not connected to the O–CH group (C2) shown in Fig. S9a.†The free energy difference [ΔG*H − ΔG*N2] can be used to study the competitive adsorption of *H protons and N2,60 thus addressing the selectivity of the Mo–Tp monolayer MOF. Values of [ΔG*H − ΔG*N2] are summarized in Table S9† for adsorption sites Mo, C1, and C2. Accordingly, ΔG*H is the free energy of H adsorption and ΔG*N2 is the free energy of N2 adsorption. The metal centre Mo is the main adsorption site for the NRR, which shows to be very selective for N2 adsorption due to having a positive [ΔG*H − ΔG*N2] value of 0.36 eV. However, the C1 and C2 adsorption sites are more selective towards H adsorption with [ΔG*H − ΔG*N2] values of −0.113 eV and −0.241 eV respectively. The Mo site could adsorb N2 while the C1 and C2 sites could ensure that there is a good supply of protons for the reaction.
The selectivity of Mo–Tp can be attributed to the shift of its magnetic states with the adsorption process. The magnetic moment increases from 12.00μB to 13.00μB as the H proton adsorbs. Fig. S9b† shows the spin density diagram consisting of a top and side view. An increase in the magnetic moment comes from unpaired electrons between Mo–Tp and the H proton. Unlike N2, the spin density surrounding the H proton does not decrease. This is due to the impairment of spins featuring the electrons surrounding the two atoms. Therefore, the Mo atom should be highly selective towards N2 adsorption.
The theoretical faradaic efficiency (FEt) was estimated through the Boltzmann distribution. Its value can be obtained using the formula FEt = {1/(1 + exp (−[ΔG*H − ΔG*N2]/kBT))}, where kBT is the product of the Boltzmann constant (kB) and temperature (T = 300 K).38 The calculated faradaic efficiency was 100% for the Mo–Tp MOF which is an excellent value agreeing with previous Mo-based 2D MOFs.11
2.7 Magnetic and charge variation across intermediates and Mo–Tp moieties
Previous work11 suggests that intuition on the NRR catalytic process can be developed by analysing the intermediate N–N bond lengths, distance between Mo and the nearest N atom, Bader charge analysis, and the magnetic moment variation of the NRR intermediates. These are summarized in Fig. 6 and Table S6.† The elongation and eventual cleavage of the N–N bond can be observed through monitoring the N–N bond distance (LN–N) in Fig. 6a and b for the distal and alternating mechanisms respectively. The bond stretches in the distal mechanism and finally ruptures during the *N⋯NHHH step, while in the alternating mechanism the bond ruptures during the *NHH⋯NHHH step. Mo–Tp is able to steadily break the N–N triple bond in both mechanisms, showing that it could be an efficient NRR catalyst.61,62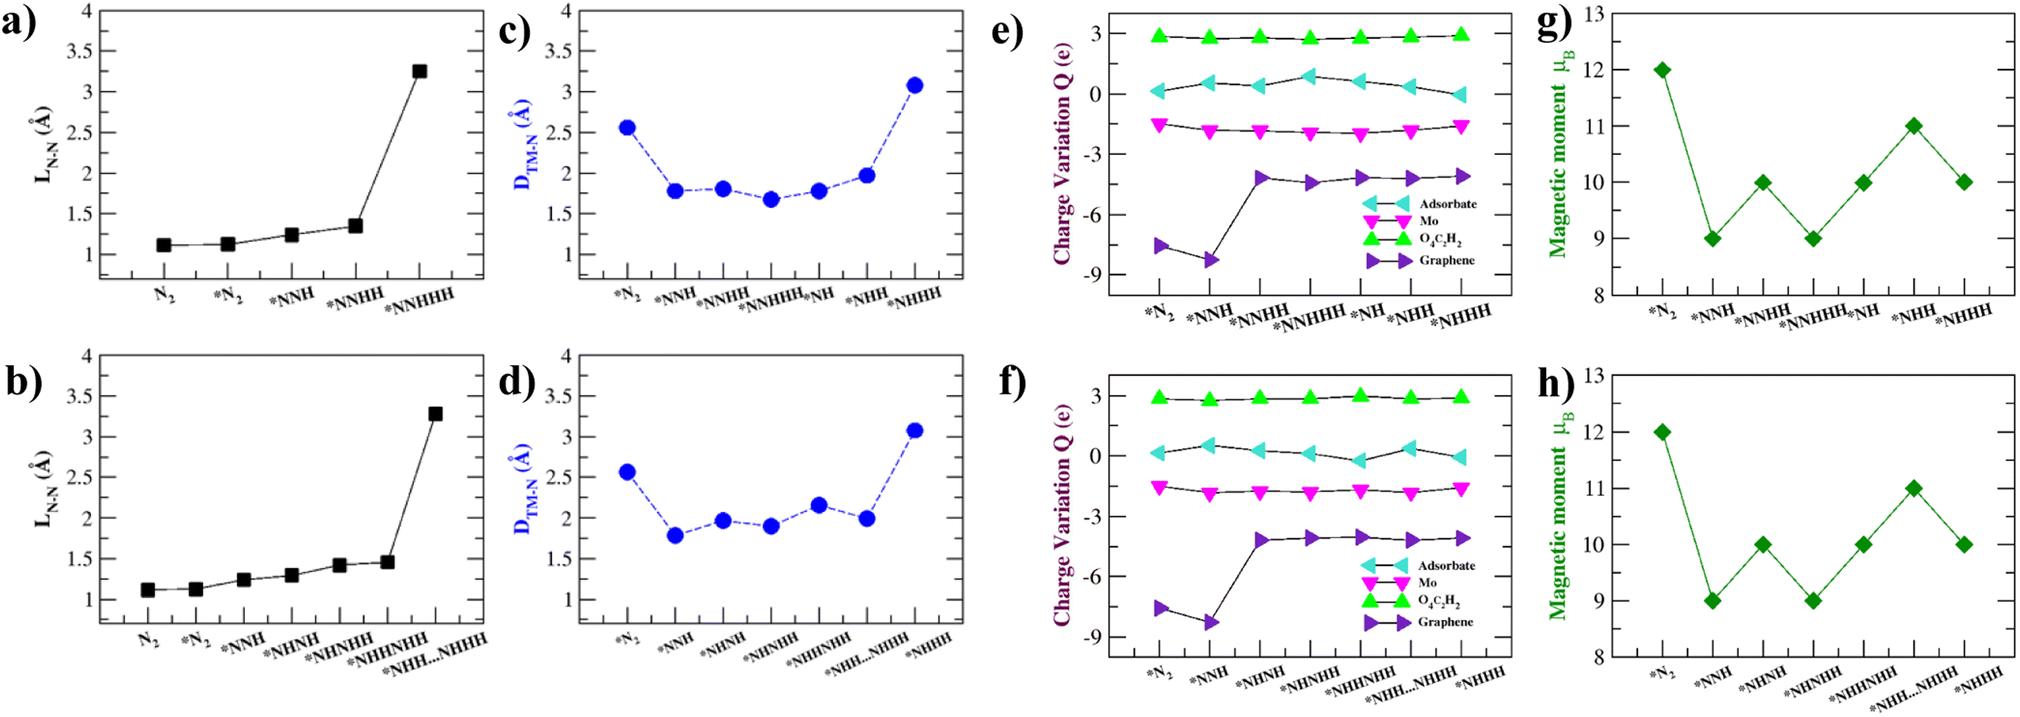 | ||
| Fig. 6 N–N bond length (LN–N) in Å throughout the (a) distal mechanism and the (b) alternating mechanism. The distance between Mo (TM) and the nearest N atom across all intermediates in Å for the (c) distal mechanism and (d) alternating mechanism. Charge variation in intermediates by Bader charge analysis of the adsorbate, Mo, O4C2H2, and graphene moieties across the (e) distal mechanism and (f) alternating mechanism. Magnetic moment variation of intermediates across the (g) distal mechanism and (h) alternating mechanism, where * denotes being adsorbed on Mo–Tp MOF. | ||
The intermediates have to be brought close enough to the Mo atom to complete the NRR without them escaping the surface. The distance between the Mo atom and the nearest N atom in intermediates was monitored throughout the course of the reactions; this is shown in Fig. 6c and d for the distal and alternating mechanisms respectively. In both mechanisms, N2 adsorbs at 2.56 Å from the surface. The intermediates are then brought closer to the surface at Mo–N distances 2.00–1.50 Å. Finally, the *NHHH intermediate is pushed away from the surface at the end of the reaction with a Mo–N distance of 3.1 Å. This ensures that the NH3 product easily leaves the surface of Mo–Tp after completing the reaction.63
To study the process of charge transfer a Bader charge analysis was carried out. On average, charge depletes from the Mo atom to force the completion of the NRR. The Mo–Tp MOF charge transfer is studied based on moieties, including that of the adsorbate, Mo atom, O4C2H2, and graphene. The results are summarized in Fig. 6e and f and Table S6† for the distal and alternating mechanisms respectively. As N2 adsorbs, it gains a charge of 0.14e. Meanwhile, the Mo atom depletes 1.50e and gains a net positive charge. Graphene supplies charges by depleting 7.56e amounts of charge. O4C2H2 linkers around the Mo atom accumulate 2.84e. As for the rest of the intermediates, the adsorbates accumulate charges in the range of 0.128–0.87e. Similarly, the Mo atom depletes 1.55–1.97e, the O4C2H2 linkers accumulate 2.71–2.98e, and graphene depletes 4.04–8.26e charge. The catalytic activity of the Mo–Tp MOF monolayer comes from the charge transfer between Mo and adsorbate moieties.
Variations in magnetism are used to designate the ground states of different NRR intermediates. Fig. 6g and f show the changes in magnetic moment (μB) for the distal and alternating mechanisms respectively. Clearly seen is that the magnetic moment decreases as the reaction proceeds. The spin density is highly localized around the Mo atom for all intermediates (Fig. S7†) and decreases somewhat because of charge transfer. Localization of spin is critical to having an efficient NRR process as observed with some of the different catalysts.64
3 Conclusions
In conclusion, we have used density functional theory (DFT) calculations to analyse a TM–Tp 2D MOF [TM = Cu, Ni, Cr, Mo, Os, Ru, and W; Tp = 1,3,5-triformylphloroglucinol] as a single-atom catalyst for the NRR. We begin by isolating a single layer of atoms from the bulk, from which 2D MOFs are likely to be synthesized. Through using current state-of-the-art screening methods featuring the ability of the MOF systems to adsorb N2 and stabilize the NNH intermediate, we isolate Mo–Tp as an NRR catalyst to focus on. Moreover, we provide evidence of outstanding stability and NRR catalytic activity of Mo–Tp. The potential limiting step (PLS) *NNH + H+ + e− ⇒ *NNHH sets the limiting potential (UL) for the distal mechanism as −0.38 V. Moreover, it shows a 100% theoretical faradaic efficiency (FEt) towards the NRR. Mo–Tp shows great promise as an efficient NRR catalyst and is able to exploit the uniqueness of the salicylaldehyde linkers. This could introduce the prospective of Mo-based 2D MOFs with various linkers for future applications in the NRR.Conflicts of interest
The authors declare no conflicts of interest.Acknowledgements
The authors would like to acknowledge the contribution of Khalifa University's high-performance research computing and research computing facilities and the Center of Catalysts and Separations (CeCaS) through the Khalifa University grant RC2-2018-024 to the results of this research. N. S. acknowledges the financial support from Khalifa University of Science and Technology under the Research Innovation grant (RIG-2023-01). We would like to acknowledge Zhen Feng for sharing his DFT input for us to build on. Finally, we would like to acknowledge Dr Sharmarke Mohammed and Dr Khalid Al Ali for their fruitful discussions towards this project.References
- C. Tang and S. Z. Qiao, Chem. Soc. Rev., 2019, 48, 3166–3180 RSC
.
- X. Guo, H. Du, F. Qu and J. Li, J. Mater. Chem. A, 2019, 7, 3531–3543 RSC
- S. L. Foster, Nat. Catal., 2018, 7, 490–500 CrossRef
- S. Singh, A. K. Mohammed, A. A. AlHammadi, D. Shetty and K. Polychronopoulou, Int. J. Hydrogen Energy, 2023, 48, 34700–34739 CrossRef CAS
- L. Xiao, Z. Wang and J. Guan, Coord. Chem. Rev., 2022, 472, 214777 CrossRef CAS
- Y. Wang, Q. Li, W. Shi and P. Cheng, Chin. Chem. Lett., 2020, 7, 1768–1772 CrossRef
- Y. Pang, C. Su, G. Jia, L. Xu and Z. Shao, Chem. Soc. Rev., 2021, 50, 12744–12787 RSC
- A. K. Mohammed, Chem. Commun., 2023, 59, 2608–2611 RSC
- K. Danyal, D. R. Dean, B. M. Hoffman and L. C. Seefeldt, Biochemistry, 2011, 50, 9255–9263 CrossRef CAS PubMed
- S. L. Foster, S. I. P. Bakovic and R. D. Duda, Nat. Catal., 2018, 1, 490–500 CrossRef
- Q. Cui, G. Qin, W. Wang, K. R. Geethalakshmi, A. Du and Q. Sun, J. Mater. Chem. A, 2019, 7, 14510–14518 RSC
- Z. Feng, Z. Yang, X. Meng, F. Li, Z. Guo, S. Zheng, G. Su, Y. Ma, Y. Tang and X. Dai, J. Mater. Chem. A, 2022, 10, 4731–4738 RSC
- G. Kresse and J. Furthmüller, Comput. Mater. Sci., 1996, 6, 15–50 CrossRef CAS
- S. Grimme, J. Antony, S. Ehrlich and H. Krieg, J. Chem. Phys., 2010, 132, 154104 CrossRef PubMed
- J. P. Perdew, K. Burke and M. Ernzerhof, Phys. Rev. Lett., 1996, 77, 3865–3868 CrossRef CAS PubMed
- G. Kresse, Phys. Rev. B: Condens. Matter Mater. Phys., 1999, 59, 1758–1775 CrossRef CAS
- G. J. Martyna, M. L. Klein and M. Tuckerman, J. Chem. Phys., 1992, 97, 2635–2643 CrossRef
- B. Himmetoglu, A. Floris, S. de Gironcoli and M. Cococcioni, Int. J. Quantum Chem., 2014, 114, 14–49 CrossRef CAS
- S. Maintz, V. L. Deringer, A. L. Tchougreeff and R. Dronskowski, J. Comput. Chem., 2016, 37, 1030–1035 CrossRef CAS PubMed
- V. Wang, N. Xu, J. C. Liu, G. Tang and W. T. Geng, Comput. Phys. Commun., 2021, 267, 108033 CrossRef CAS
- K. Mathew, R. Sundararaman, K. Letchworth-Weaver, T. A. Arias and R. G. Hennig, Chem. Phys., 2014, 140, 084106 Search PubMed
- J. K. Nørskov, J. Phys. Chem. B, 2004, 108, 17886–17892 CrossRef
- J. H. Jung, C.-H. Park and J. Ihm, Nano Lett., 2018, 18, 2759–2765 CrossRef CAS PubMed
- B. Hammer and J. K. Nørskov, Adv. Catal., 2000, 45, 71–129 CAS
- X. Guo and S. Huang, Electrochim. Acta, 2018, 284, 392–399 CrossRef CAS
- A. Chaves, npj 2D Mater. Appl., 2020, 4, 29 CrossRef CAS
- T. Bligaard, J. K. Nørskov, S. Dahl, J. Matthiesen, C. H. Christensen and J. Sehested, J. Catal., 2004, 224, 206–217 CrossRef CAS
- J. K. Nørskov, J. Catal., 2002, 209, 275–278 CrossRef
- C. J. H. Jacobsen, S. Dahl, B. G. S. Clausen, S. Bahn, A. Logadottir and J. K. Nørskov, J. Am. Chem. Soc., 2001, 123, 8404–8405 CrossRef CAS PubMed
- J. K. Nørskov, T. Bligaard, B. Hvolbæk, F. Abild-Pedersen, I. Chorkendorff and C. H. Christensen, Chem. Soc. Rev., 2008, 37, 2163–2171 RSC
- E. Skúlason, Phys. Chem. Chem. Phys., 2012, 14, 1235–1245 RSC
-
T. Wolfram and Ş. Ellialtıoğlu, Crystal Field Theory, Cambridge University Press, Cambridge, 2014, pp. 90–122 Search PubMed
- I. Garg, H. Sharma, N. Kapila, K. Dharamvir and V. K. Jindal, Nanoscale, 2011, 3, 217–224 RSC
- M. Arif, Chem. Eng. J., 2023, 451, 138320 CrossRef CAS
- C. Fang and W. An, Nano Res., 2021, 14, 4211–4219 CrossRef CAS
- J. Zhao and Z. Chen, J. Am. Chem. Soc., 2017, 139, 12480–12487 CrossRef CAS PubMed
- W. Zhao, L. Chen, W. Zhang and J. Yang, J. Mater. Chem. A, 2021, 9, 6547–6554 RSC
- X. Zhang, T. Zhao, L. Yan and Z. Su, Phys. Chem. Chem. Phys., 2023, 25, 12371–12378 RSC
- L. Gao, J. Mater. Chem. A, 2019, 7, 19838–19845 RSC
- X. Li, T. Li and Y. Ma, Adv. Energy Mater., 2018, 8, 1801357 CrossRef
- L. Zhang, X. Ji and X. Ren, Adv. Mater., 2018, 30, 1800191 CrossRef PubMed
- X. Ren, J. Zhao and Q. Wei, ACS Cent. Sci., 2019, 5, 116–121 CrossRef CAS PubMed
- H. Cheng, L. Xin Ding and G. Feng Chen, Adv. Mater., 2018, 30, 1803694 CrossRef PubMed
- J. Zhao and Z. Chen, J. Am. Chem. Soc., 2017, 139, 12480–12487 CrossRef CAS PubMed
- L. Hui, Y. Xue and H. Yu, J. Am. Chem. Soc., 2019, 141, 10677–10683 CrossRef CAS PubMed
- H. Niu, X. Wang and C. Shao, ACS Sustain. Chem. Eng., 2020, 8, 13749–13758 CrossRef CAS
- J. G. Howalt, T. Bligaard, J. Rossmeisl and T. Vegge, Phys. Chem. Chem. Phys., 2013, 15, 7785–7795 RSC
- X. Wang, Q. Zhang, W. Hao, C. Fang, J. Zhou and J. Xu, J. Mater. Chem. A, 2022, 10, 15036–15050 RSC
- A. Rasool, I. Anis, S. A. Bhat and M. A. Dar, Phys. Chem. Chem. Phys., 2023, 25, 22275–22285 RSC
- Y. Ling, J. Mater. Chem. A, 2020, 12996–13003 RSC
- Z. Feng, Y. Tang and W. Chen, Phys. Chem. Chem. Phys., 2020, 22, 9216–9224 RSC
- Z. Geng, Y. Liu and X. Kong, Adv. Mater., 2018, 30, 1803498 CrossRef PubMed
- D. Ma, Z. Zeng and L. Liu, J. Phys. Chem. C, 2019, 123, 19066–19076 CrossRef CAS
- J. Han, Z. Liu and Y. Ma, Nano Energy, 2018, 52, 52264–52270 CrossRef
- Y. Cao, Y. Gao and H. Zhou, Adv. Theory Simul., 2018, 1, 1800018 CrossRef
- D. Ma, Z. Zeng and L. Liu, J. Energy Chem., 2021, 54, 501–509 CrossRef CAS
- H. Zou, W. Rong and S. Wei, Proc. Natl. Acad. Sci. U.S.A., 2020, 117, 29462–29468 CrossRef CAS PubMed
- H. Yu, Y. Xue and L. Hui, Natl. Sci. Rev., 2021, 8, nwaa213 CrossRef CAS PubMed
- R. Hao, W. Sun and Q. Liu, Small, 2020, 2000015 CrossRef CAS PubMed
- C. Choi, S. Back, N. Y. Kim, J. Lim, Y. H. Kim and Y. Jung, ACS Catal., 2018, 8, 7517–7525 CrossRef CAS
- L. Shi, Y. Yin, S. Wang and H. Sun, ACS Catal., 2020, 10, 6870–6899 CrossRef CAS
- W. Guo, K. Zhang, Z. Liang, R. Zou and Q. Xu, Chem. Soc. Rev., 2019, 48, 5658–5716 RSC
- J. Wan, J. Zheng, H. Zhang, A. Wu and X. Li, Catal.: Sci. Technol., 2022, 12, 38–56 RSC
- Y. Zhang, J. Mater. Chem. A, 2022, 10, 23704–23711 RSC
Footnote |
| † Electronic supplementary information (ESI) available. See DOI: https://doi.org/10.1039/d3ta06666e |
| This journal is © The Royal Society of Chemistry 2024 |