Reaction kinetics for ammonia synthesis using ruthenium and iron based catalysts under low temperature and pressure conditions†
Received
22nd February 2024
, Accepted 4th April 2024
First published on 5th April 2024
Abstract
Ammonia (NH3) production using green hydrogen and its emerging application as carbon-free energy carrier or fuel is predicted to play an important role for the global energy transition. Yet, the inherently fluctuating production of hydrogen from renewable energy and the corresponding new boundary conditions for NH3 synthesis require efficient and intensified processes. A key strategy for the intensification of the NH3 synthesis is the shift of the synthesis conditions to lower temperature and pressure compared to the conventional Haber–Bosch process. In this work, the reaction kinetics of ruthenium- and iron-based catalysts are determined experimentally at pressures between 10 to 80 bar and at temperatures from 350 to 450 °C. Using axially resolved temperature and concentration measurement, detailed experimental data were obtained in the kinetic regime and utilized to develop kinetic models for both catalysts. Therefore, an ideal plug-flow model for a fixed bed reactor, considering the axial temperature profile, is used to estimate the kinetic parameters. The developed kinetic models are based on the extension of the Temkin equation, which is adapted for both catalysts. Remaining deviation between simulated and experimental data is reduced to a root-mean-square error for the molar fraction of NH3 of below 0.6%. The proposed extension of the Temkin equation allowed the reduction of this deviation by 20–30% compared to the conventional Temkin expression, which underlines the relevance of the novel kinetic expressions. Based on the validated kinetic models, concepts for process intensification and modularization of the NH3 synthesis can be developed towards industrial realization.
Introduction
Deceleration of the temperature rise to the limit of 1.5 °C has become a global goal for researchers. This goal can only be attained by drastic reduction of CO2 emissions across all sectors, emphasizing a substitution of fossil energy by renewable energy. Therefore, chemical energy carriers, fuels and chemical feedstocks need to be defossilized in the near future.1 Ammonia (NH3), produced from renewable energy, is considered as a promising hydrogen (H2) carrier for the global point-to-point trade, shipping fuel, and for combined power generation. Considering the high global demand for low-carbon H2 projected to reach 500–650 Mt per annum by 2050, the demand for NH3 as sustainable H2 carrier and fuel is expected to grow three to four-fold compared to today's market.2 Current NH3 production via the Haber–Bosch (HB) process based mainly on natural gas (NG) as feedstock is currently the major pathway with an estimated global production capacity of 190 Mt in 2021, while causing ca. 2% of the annual global CO2 emissions.3 The shift from fossil feedstock-based NH3 synthesis to a sustainable Power-to-Ammonia (PtA) process based on renewable energy therefore opens new horizons for NH3 as gamechanger in the transition of the global energy system.
The conventional NH3 synthesis is characterized by high reaction temperatures of 400 to 600 °C to obtain sufficient catalytic activity of commonly used Fe-based catalyst. Consequently, high pressures of 150 to 250 bar are required to achieve thermodynamic favorable conditions for the exothermic reaction given in eqn (1). However, the per pass conversion is limited under industrial synthesis conditions to 15 to 20% by thermodynamic equilibrium, making a product separation and recirculation of non-converted educts essential.4
| | | 3H2(g) + N2(g) ⇌ 2NH3(g) ΔHor = −92.44 kJ mol−1 | (1) |
In the centennial history of industrial NH3 synthesis, the specific energy demand for the process was reduced to the range of 26–28 GJ t−1 of NH3 approaching the thermodynamic limit of 22.5 GJ t−1 for the NG-based production.5 The reduction of energy consumption was mainly achieved by the scale-up of the production facilities to capacities exceeding 1000 t h−1 using positive scale-effects.6 However, the requirements for the sustainable PtA process differ significantly. On the one hand, the intermittency of H2 supply from renewable resources must be considered.7 On the other hand, the scale for the production is expected to decrease according to the capacity of electrolyzers and the remote production sites based on local renewable energy production.8 For small-scale PtA units based on the conventional HB process, scientific literature reported an energy demand of 33–46 GJ t−1, which is significantly higher compared to the conventional process.6 Moreover, the relatively high pressure conditions of the conventional process do not match the upstream operating pressure of current commercial electrolyzers, typically operating below 100 bar.9 Therefore, the PtA process can benefit significantly from a new process design, dedicated to small scale and dynamic operation at lower pressures and temperatures. A promising strategy to design processes for this application lies within process intensification, for example by shifting the thermodynamic equilibrium by the continuous removal of NH3 from the gas phase via in situ sorptive separation. Simulation-based evaluations of the sorption-enhanced approach pursued in our previous work indicates a significant energy saving potential up to 50% for the synthesis loop compared to conventional and other emerging technologies.7 As the thermodynamic equilibrium of the sorptive NH3 removal is favored by low temperatures, sorption enhanced reactors should be operated at lowest temperature possible.10,11 However, as low temperatures limit the NH3 synthesis reaction kinetically, catalysts with high activity at low temperature are necessary for this technology, which has been under investigation for many years.12,13 So far, the implementation to an industrial scale was only achieved for two catalyst materials. Most commonly used are Fe-based catalysts, in form of different oxidation states, such as wüstit or magnetite, promoted by various compounds such as K2O, BaO or Al2O3. These catalysts benefit from being comparatively cheap, as no noble metals or rare elements are used, and show a high chemical and thermal stability under conventional synthesis conditions.14 Drawbacks of Fe-based materials result from their high activation energies and the comparatively strong inhibition of the catalytic activity by NH3 formed along the reaction.15 Accordingly, industrial processes using Fe-based catalysts need to be operated under relatively high temperatures and pressures, using a higher recycle ratio to achieve reasonable conversions and to limit the NH3 concentration in the reactor. In fact, the NH3 inhibition led to the development of a synthesis process based on a carbon-supported ruthenium (Ru) catalyst. Therefore, the catalyst was implemented in the rear section of a multistage reactor, allowing the efficient synthesis at increased NH3 concentrations in the commercialized Kellogg's process.16 Ru-based catalysts benefit from a lower activation energy in comparison to Fe-based catalysts. Drawbacks are the higher cost and lower availability of Ru, as well as the need for a thermal and chemical stable support materials.17
To design NH3 synthesis reactors the development of suitable kinetic models has been in the focus of research since the early work by Mittasch et al. in the beginning of the 20th century.18 In their review, Nielsen et al.19 give an overview of existing kinetic models and introduce a classification into two general approaches. While the first approach is based on the model developed by Temkin and Pyzhev,20 the second class assumes a Langmuir-type adsorption according to the Langmuir–Hinshelwood approach. Yet, kinetic models available in the literature mainly focus reaction conditions typical for the conventional Haber–Bosch process, characterized by high pressures and temperatures. Consequently, this work focusses on a kinetic investigation under mild reaction conditions, needed to design small-scale PtA processes. Therefore, the commonly used Temkin–Pyzhev equation21–27 is used as basis and systematically extended, in order to achieve sufficient agreement between prediction and experimental data. The model discrimination and parameterization are performed based on experiments with Ru- and Fe-based catalysts using axially resolved temperature and concentration measurements.
Methodology
Experimental
Reactor setup.
Kinetic investigations were carried out in the reactor setup shown in Fig. 1. The reactor consists of a stainless-steel tube (din = 8 mm) with seven axially distributed sampling positions, enabling the measurement of the axial gas phase composition along the catalyst bed. Gas sampling from the different positions was performed using an automated multiport valve (Valco Vici), allowing to sequentially connect the sampling positions to the downstream gas phase analytics. To achieve a continuous flow through the catalyst bed independently of the selected sampling position, the gas stream was split into the gas sample stream at the sampling position and a continuous product stream controlled by a mass flow controller (Cori-Flow, Bronkhorst). Pressure inside the reactor was adjusted using a membrane back-pressure regulator (Equilibar ZF) placed downstream of the sampling position. Further, the reactor was mounted in an electrically heated, cylindrical alumina shell with two temperature control zones, for the top and bottom of the reactor. Hot-spot formation inside the catalyst bed was reduced by dilution of the catalyst with silicon carbide (SiC) in a mass ratio of 1 g catalyst to 2.5 g of SiC. Furthermore, to identify temperature increases induced by NH3 synthesis reaction, the axial temperature profile along the catalyst bed was measured using a fiber optical temperature measurement (Luna OdiSi 6100) with a high resolution (temporal resolution: 5 Hz, spatial resolution: 2.6 mm). Measurement noise was reduced by calculation of the median of a sequence of 5 measurements, leading to a temporal resolution of one temperature profile per second. The glass fiber used as temperature sensor was contained inside a stainless-steel capillary with an external diameter of 0.8 mm and placed concentrically in the reactor tube. The system was calibrated by temperature measurements with two additional Pt-100 sensors placed at the beginning and end of the catalyst bed during a reference experiment under inert atmosphere. Based on these reference temperatures, a calibration polynomial was defined to determine the spatial temperature profile along the fiber as described elsewhere.28
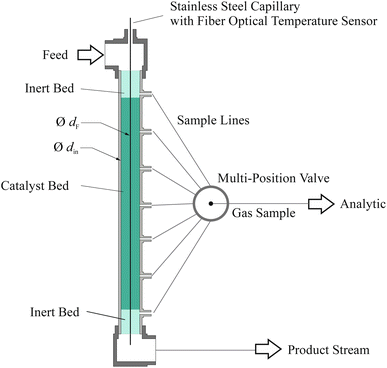 |
| | Fig. 1 Reactor concept used for the measurement of NH3 synthesis with different catalysts. | |
Catalyst materials.
The sample of a Ru/CeO2 catalyst was provided by Fukushima Renewable Energy Institute (FREA-AIST), while the iron (Fe) based catalyst was supplied by Clariant AG. To avoid wall effects and internal mass transfer limitations, the catalysts were sieved and crushed into particle sizes (dp) between 250 to 500 μm. For activation, 8.7 g Ru/CeO2 catalyst were reduced for 5 h at 500 °C and ambient pressure under a flow of 2.55 mol per h H2 and 0.85 mol per h N2, which corresponds to the stoichiometric H2/N2 ratio of 3.9.4 g Fe catalyst were reduced under the same flow rates at 425 °C for 12 h at 80 bar. Different masses of catalysts were used, due to the difference in the bulk densities of the catalysts.
Gas phase analytics.
The molar fraction of NH3 in the product was measured using an online Fourier-transform infrared spectroscopy (FTIR) measurement device (MKS MultiGas 2030G). The FTIR was equipped with a gas cell with an optical pathway of 2 cm, leading to low dead volume of the analysis line, allowing for fast sampling of different operational conditions in the reactor. Gas phase measurements were carried out with a frequency of 1 Hz.
Measurement procedure.
Temperature, pressure and feed gas composition were varied according to a full factorial experimental design in the range given in Table 1. The total catalyst amount mcat,tot was homogenously distributed along the total catalyst bed length Lbed,tot resulting in specific catalyst loadings in the order of 25 g m−1. The seven axially distributed sampling positions enabled the variation of the length of the catalyst bed between inlet and sampling position Lbed(z) at every 0.07 m while the molar flow rate at the reactor inlet, ṅtot,in, was kept constant over the whole experimental campaign. The variation of the catalyst bed length can also be expressed by the Gas Hourly Space Velocity (GHSV), defined by the standard volumetric flow rate of feed gases per volume of catalyst used. For each experiment, all process parameters were set to the desired value and held until steady-state was reached regarding the molar fraction of NH3. Steady-state was defined by a relative change in the measured molar fraction below 1% for a time span of at least 5 min. Once steady-state was reached, the sampling position was switched from bottom to top along the reactor axis, whereby the before mentioned criteria for steady-state was applied for each sampling position. All measured data (temperature profiles, FTIR measurements, sensor readings) were processed by a MATLAB script to a temporal resolution of 1 Hz. To improve data quality and to increase the signal-to-noise ratio, the mean values for one minute under steady-state conditions were calculated for each experimental point from data readings obtained with a frequency of 1 Hz. According to this procedure, 162 experimental points for each catalyst were measured.
Table 1 Experimental conditions applied for the respective catalyst defined by the total catalyst amount mcat,tot, the estiamted bulk desity ρb, the catalyst bed length between inlet and sampling position Lbed(z), the total inlet molar flow rate ṅtot,in, the catalyst particle diameter dp and the ranges for temperature T, pressure p and feed gas composition H2/N2
| Symbol |
Unit |
Ru/CeO2 |
Fe |
|
m
cat,tot
|
g |
8.7 |
9.4 |
|
L
bed(z) |
m |
0.06–0.35 |
0.05–0.36 |
|
ṅ
tot,in
|
mol h−1 |
2.7 |
2.8 |
|
d
p
|
μm |
250–500 |
250–500 |
|
T
|
°C |
350; 400; 450 |
350; 400; 450 |
|
p
|
bar (g) |
10; 45; 80 |
10; 45; 80 |
| H2/N2 |
mol mol−1 |
1.5; 2; 3 |
1.5; 2; 3 |
| GHSV |
h−1 |
12![[thin space (1/6-em)]](https://www.rsc.org/images/entities/char_2009.gif) 000–38000 000–38000 |
12000–38000 |
|
ρ
b
|
kg m−3 |
2100 |
2500 |
Validation of experimental conditions.
Ideal plug-flow behavior was validated by considering the guidelines provided by Dautzenberg.29 Radial gradients and axial dispersion were avoided by using a high Lbed,tot/dp ratio of around 700, which exceeds the recommended minimum 50. Bodenstein number (Bo) was evaluated to be 80 or higher for the most critical operating point concerning axial dispersion, meaning for the shortest catalyst bed at the first sampling position. Blind experiments with pure SiC were carried out to confirm absence of catalytic activity of the inert material or the reactor piping. The catalysts were activated and kept under steady-state conditions at 400 °C, 80 bar and a stoichiometric feed mixture, to confirm their stability for 12 h before the catalytic measurements. Deactivation of the catalyst was ruled out during the campaign duration of around 80 h for the Fe and 100 h for the Ru/CeO2 catalyst, respectively. The absence of external and internal mass transfer limitations was proven by checking the criteria by Carberry and Mears, respectively.30 The calculations are provided in the ESI.†
Modelling
Reactor model.
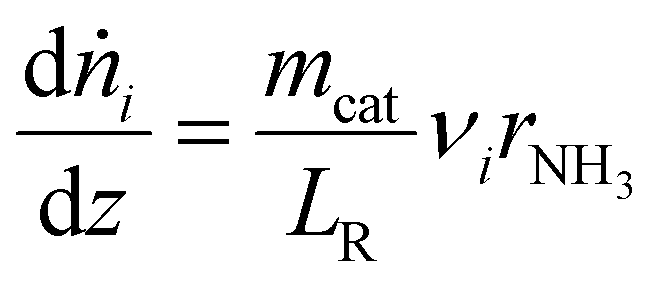
A pseudo-homogeneous, one-dimensional, ideal plug-flow reactor model was implemented using MATLAB to represent the experimental conditions. The according material balance for the component i is given in eqn (2). For solving this differential equation, the inlet molar flow rates for each component are used as boundary condition.| | 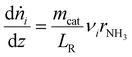 | (2) |
The available experimental data for the spatially resolved temperature profile was used for the model directly and the calculation of the energy balance could be omitted. As the measured pressure drop along the catalyst bed was less than 100 mbar for all experimental points, the impulse balance was neglected in the model.
Kinetic equations.
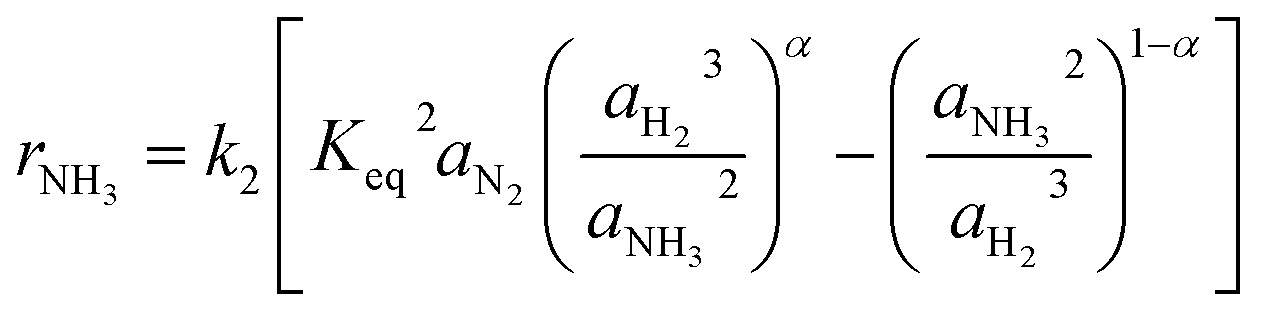
In this work, different kinetic models from the literature are used and compared to identify the most suitable model in regard to the experimental data obtained. The commonly used Temkin approach (eqn (3)) assumes the dissociative adsorption of N2 as the rate determining step,20 which was proven by the work of Ertl et al.31 The adsorption of any other species involved in the reaction as considered negligible. Hence, N2 is assumed as the most abundant species on the catalyst surface. In contrast to a Langmuir based kinetic approach, a heterogenous surface was assumed by Temkin et al. leading to a change in the heat of adsorption depending on the degree of coverage. The coefficient α, describing the reaction order was introduced by Temkin et al.20 and fitted to 0.5 in their work, yet in various works values between 0.25 and 0.75 are reported.19 The applied form of the Temkin equation based on the activities ai of the reaction species is given in eqn (3).| | 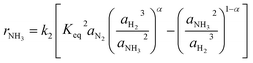 | (3) |
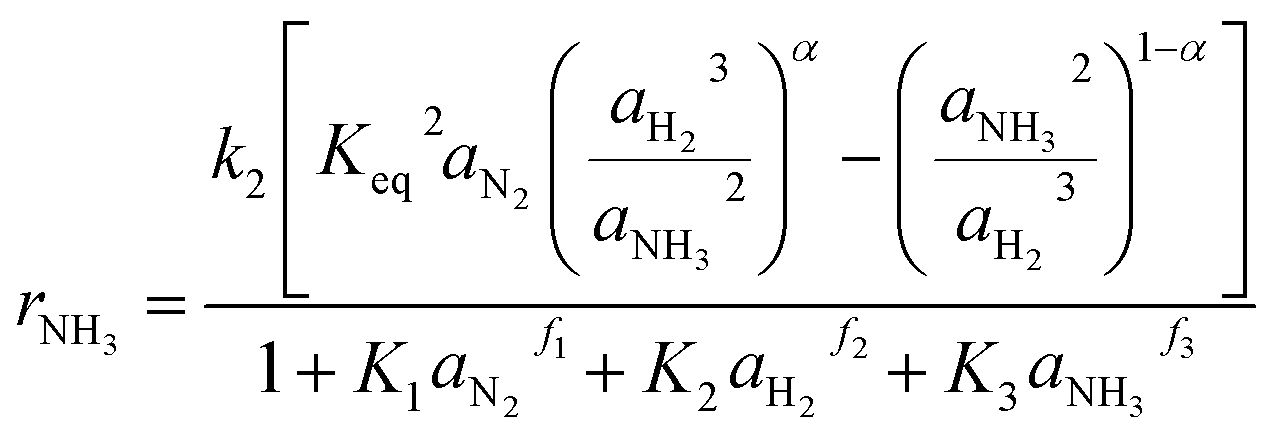
Especially at lower temperatures, competitive adsorption becomes significant, which was shown by Ozaki, Taylor and Boudart32 for NH species for example. Consequently, Rossetti et al.33 proposed the kinetic approach shown in eqn (4), which was developed for Ru-based catalysts. The numerator of the equation is equal to the Temkin equation (eqn (3)), hence, still assuming the adsorption of N2 as rate-determining step. The denominator considers the adsorption of each gaseous species at the solid surface assuming the sorption step to be in equilibrium. The effect of the competitive adsorption of the different reactants is considered by a coefficient fi.
| | 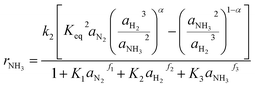 | (4) |
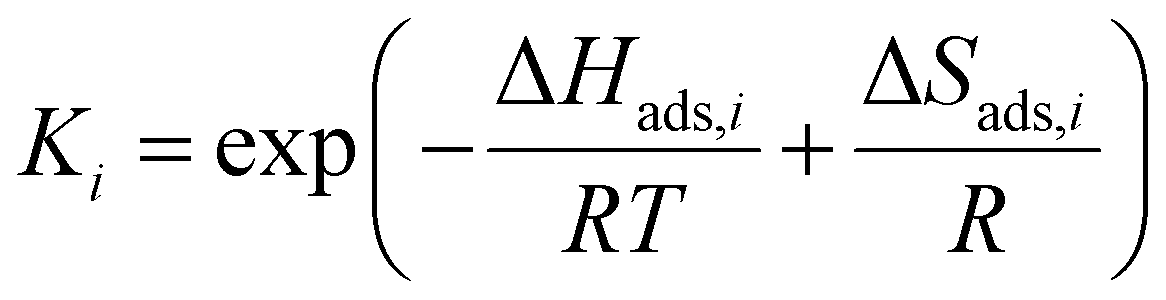
The kinetic models in eqn (3) and (4) are taken from the literature,33,34 while the reaction rate constant k2 and the equilibrium constants Ki were calculated according to the Arrhenius approach (eqn (5)) and the van't Hoff equation (eqn (6)).
| | 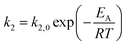 | (5) |
| | 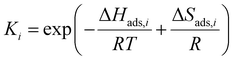 | (6) |
The model was used to fit the pre-exponential factor k2,0, the activation energy EA, and the coefficient α, as well as the parameters ΔHads,i, ΔSads,i, and the coefficient fi. All remaining parameters, i.e., the activities ai and the equilibrium constant Keq, were calculated according to the following section.
Thermodynamic calculations.
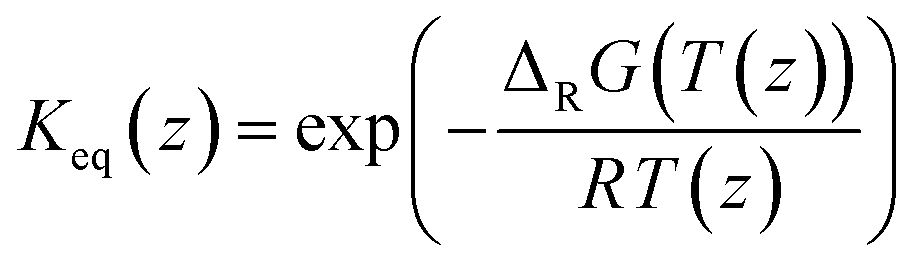
The equilibrium constant Keq for NH3 synthesis is calculated according to eqn (7) from the Gibbs free energy, ΔRG°, which depends on the measured axial temperature profile. Detailed calculations are given in the ESI.†| | 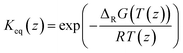 | (7) |
The gas phase activities were calculated using the Soave–Redlich–Kwong (SRK) equation of state (EoS), as described in the ESI.† The consistency of the selected EoS with experimental data for the NH3 synthesis was checked and confirmed by Tripodi et al.35
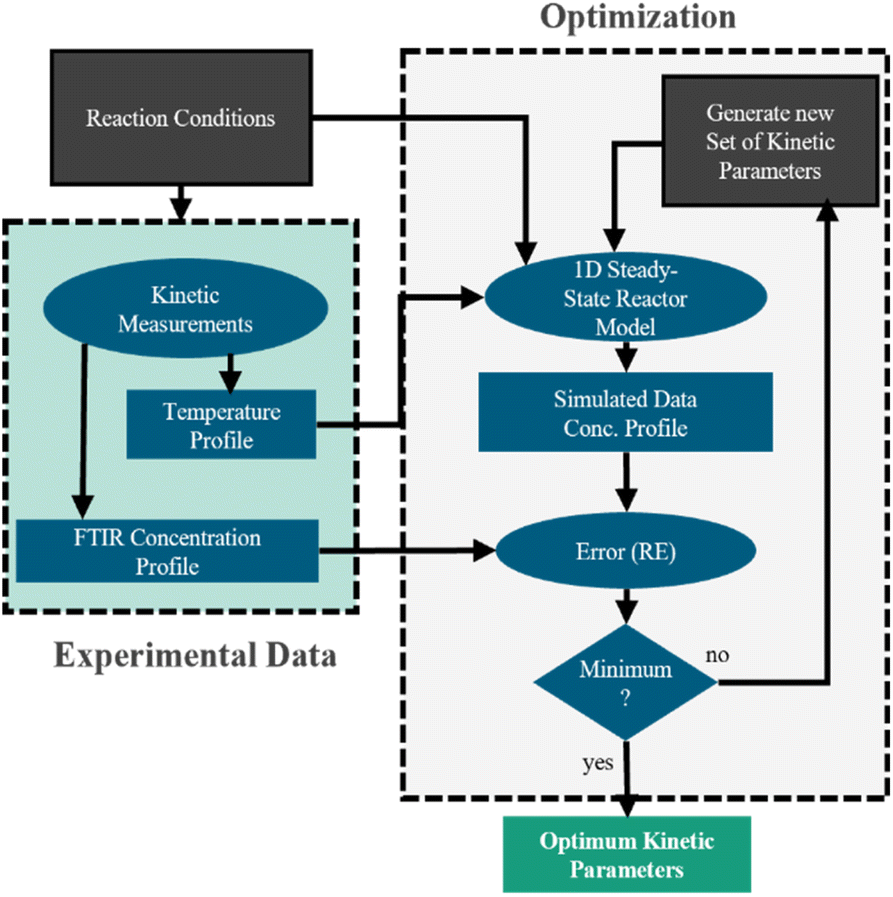
Method for the fitting of the model parameters.
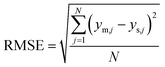
The experimental data obtained in this work was used to parameterize the kinetic models according to the method described in Fig. 2. The temperature profile and the NH3 molar fraction at each sampling position were used as input for the model, while the inlet molar flow rate of each component was used as boundary conditions. The measured NH3 molar fraction was converted into a molar flow rate by calculating the extent of reaction for NH3 and the calculation of molar flow rates of H2 and N2 based on the stoichiometric NH3 synthesis reaction and the measured inlet flow rates, as given in the ESI.† The model is solved with a higher spatial resolution than that of the measured axial profiles. Hence, the temperature values between two axial measurement positions were interpolated linearly. Kinetic parameters were determined by minimizing the error function RE defined as the deviation between simulated and measured NH3 molar fraction at each sampling position (eqn (8)). Note that each experimental point is obtained for an individual inlet molar flow rate, operating temperature, and pressure as well as a specific catalyst mass, for which the outlet composition and the axial temperature profile was measured. The catalyst mass was varied by switching among the sampling positions distributed axially. To avoid falsification of the parameter estimation by data close to equilibrium, the deviation between data and equilibrium was used as weighing factor in eqn (8). Minimization of the error function was executed using the Nelder–Mead method implemented in MATLAB.36 The quality of the model fit is discussed based on the root-mean-square error (RMSE), calculated based on the molar fraction of NH3 as given in eqn (9). Further, confidence intervals (CI) are calculated using a nonlinear model fit performed in MATLAB using the Jacobian matrix for a 95% confidence interval for the obtained parameters, as described elsewhere.37 The complexity of the kinetic model was reduced from as in eqn (4) by stepwise removal of parameters, starting with those with the highest CI. The most appropriate kinetic model is chosen based on minimum RMSE after systematic elimination of parameters.| | 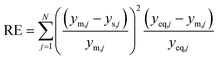 | (8) |
| |  | (9) |
 |
| | Fig. 2 Schematic illustration of the method applied for fitting of the kinetic parameters in this work. | |
Results and discussion
Experimental results
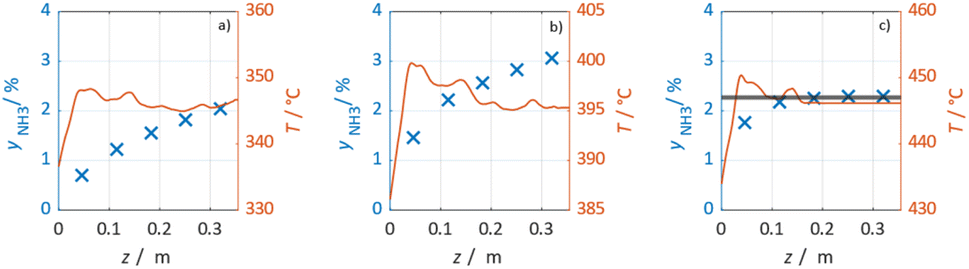
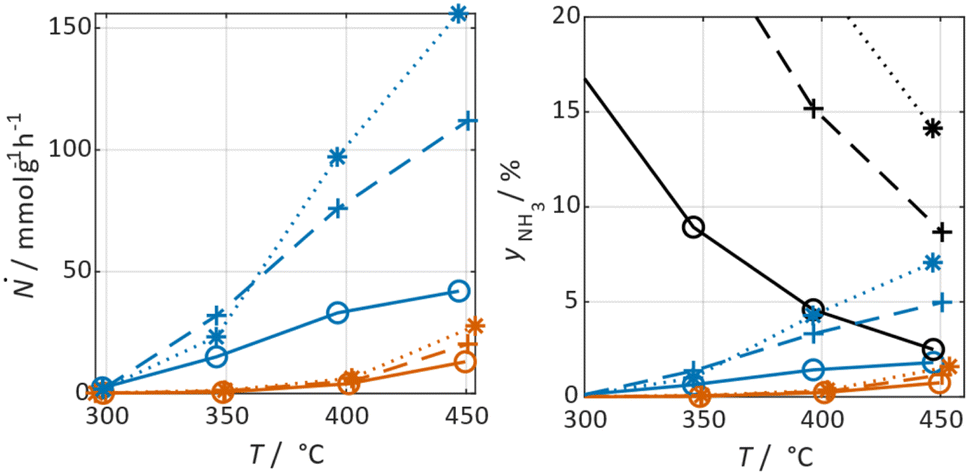
In Fig. 3 selected experimental results for the Fe-based catalyst are shown to illustrate the axially resolved temperature profile and the molar NH3 fraction measured at distinct axial positions. The full set of experimental results for both catalysts can be found in the ESI.† The plots indicate an increasing molar fraction of NH3 along the axial reactor coordinate. The equilibrium NH3 molar fraction (solid black line) calculated for the mean temperature in the reactor is included for the experiments carried out at maximum temperature (450 °C). Experiments at lower temperatures are clearly in the kinetic regime and rather unaffected by equilibrium constraints. The release of heat of reaction leads to hot-spot formation of up to 5 K close to the reactor inlet. Along the flow direction the temperature profile reaches constant values since the rate of formation and thus the heat release diminishes. In Fig. 4 the measured molar fraction and the specific molar flow rate of NH3 for both catalysts are displayed as function of the measured temperature. The temperature is represented by the average value of the measured temperature profile along the catalyst bed. The molar fraction and flow rate of NH3 are determined at the second sampling position (the first sampling position corresponds to the reactor inlet), in order to display data in the kinetic regime with minor effects of equilibrium constraints. The measured data with respect to temperature profiles and NH3 molar fraction along the reactor length are tabulated in the ESI.† For both catalysts the NH3 formation rate rises with rising temperature and pressure, as expected. At temperatures above 400 °C the increase of NH3 formation rate with temperature is less pronounced especially at lower pressures. This can be explained by more pronounced equilibrium constraints, as shown for the NH3 molar fraction (Fig. 4, right).
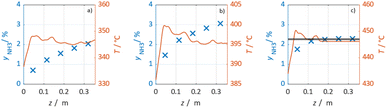 |
| | Fig. 3 NH3 molar fraction measured at distinct sampling position (blue) and spatially resolved temperature profile (red) at temperature levels of 350 °C (a), 400 °C (b) and 450 °C (c). Reaction conditions: H2/N2 = 3.0 and pressure of 80 bar using the Fe catalyst. | |
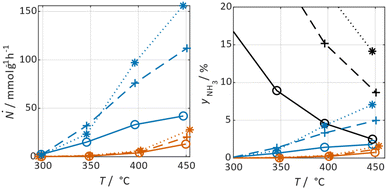 |
| | Fig. 4 Effect of temperature on the specific molar flow rate of NH3 per mass catalyst at reactor outlet ṄNH3,out (left) and the measured molar fraction of NH3 (right) in comparison with the thermodynamic equilibrium (black) for the Fe (blue) and Ru/CeO2 catalyst (orange) at pressures of 10 bar (o), 45 bar (+) and 80 bar (*) at a H2/N2 ratio of 3.0 using the minimum catalyst bed length Lbed(z). | |
The Ru/CeO2 catalyst shows a lower rate of formation under all applied reaction conditions in comparison to the Fe-based catalyst. The lower activity of the Ru/CeO2 catalyst could be explained by the inhibition by H2 adsorption, as discussed in recent publications.38–40 The potential inhibiting effect of H2 was investigated by variation of the H2/N2 ratio in the gas mixture for both, Fe and Ru/CeO2 catalyst, as depicted in Fig. 5. To compare the influence of H2/N2 ratio on both catalysts, the relative NH3 formation rate ψ is calculated according to eqn (10). For the calculation of ψ, the specific molar flow rate of NH3 determined for a certain H2/N2 ratio j is divided by the value determined for a stoichiometric H2/N2 mixture under equal reaction conditions.
| |  | (10) |
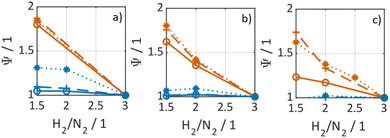 |
| | Fig. 5 Comparison of relative rate of NH3 formation ψ as function of H2/N2 ratio for Fe (blue) and Ru/CeO2 (orange) catalyst at 350 °C (a), 400 °C (b) and 450 °C (c) and for pressures of 10 bar (o), 45 bar (+) and 80 bar (*) using the minimum catalyst bed length Lbed(z) for both catalysts. | |
Fig. 5 indicates that the Ru/CeO2 catalyst was more sensitive towards the H2/N2 ratio compared to the Fe catalyst. For instance, at 400 °C the reduction of the H2/N2 ratio from 3.0 to 1.5 leads to an increase in NH3 formation rate by more than 80% for the Ru/CeO2 catalyst. Hereby, the sensitivity towards the H2/N2 ratio is independent of temperature. In contrast, a sensitivity of the Fe-based catalysts towards the N2/H2 ratio is only observed at the lowest temperature and highest pressure.
Kinetic modeling
The kinetic model obtained in this work for the Fe catalyst was defined by the systematic simplification of eqn (4) towards the expression given in eqn (11). The highlighted parameters k2, K3 and f3 represent those determined by the parameter fitting according to the method illustrated in Fig. 2. Hence, the kinetic expression found in the present work (eqn (11)) extents the conventional Temkin (eqn (3)) by the adsorption constant K3, which underlines the relevance of the observed inhibition by NH3. Simultaneously, adsorption of H2 was found non-significant, which agrees with the observed low sensitivity towards H2/N2 ratio for this catalyst. Table 2 lists the kinetic parameters estimated for eqn (11). The activation energy of 144 kJ mol−1 is close to the range of 150 to 170 kJ mol−1 reported by Liu for different Fe based catalysts.41| | 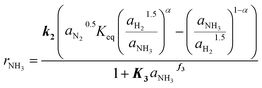 | (11) |
Table 2 Estimated kinetic model parameters for the extended Temkin eqn (11) with their respective confidence intervals for the Fe catalyst
| Parameter |
Unit |
Value |
CI (95%) |
|
k
2,0
|
mol s−1 kg−1 |
3.35 × 10⁹ |
±10.4 |
|
E
A
|
J mol−1 |
1.44 × 10⁵ |
±2.2 |
| ΔS3,Ads |
J mol−1 K−1 |
−24.4 |
±1.2 |
| ΔH3,Ads |
J mol−1 |
−1.56 × 10⁴ |
±4.4 |
|
f
3
|
1 |
0.261 |
±11 |
|
α
|
1 |
0.5 |
— |
The validity of the simplification of the model is shown by comparison of RMSE values for the different model complexities, given in Table 4. It becomes apparent, that the extended Temkin model (eqn (11)) provides the smallest RMSE, even though the number of parameters is still low. Hence, we propose this model as the optimal one. Extending the model from the conventional (eqn (3)) to the extended Temkin expression (eqn (11)) reduces the RMSE from 0.68% down to 0.43%, by introducing three additional parameters. Consideration of further parameters in the kinetic model does not lead to any improvement in RMSE.
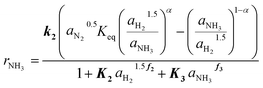
The determined kinetic expression for the Ru/CeO2 catalyst is given in eqn (12), where the highlighted parameters k2, K2, f2, K3 and f3 are fitted to the experimental data and summarized in Table 3.
| |  | (12) |
Table 3 Fitted kinetic model parameters for the extended Temkin eqn (12) with their respective confidence intervals for the Ru/CeO2 catalyst
| Parameter |
Unit |
Value |
CI (95%) |
|
k
2,0
|
mol s−1 kg |
3.49 × 10⁸ |
±15.7 |
|
E
A
|
J mol−1 |
1.06 × 10⁵ |
±2 |
| ΔS2,Ads |
J K−1 mol−1 |
−80.1 |
±0.16 |
| ΔH2,Ads |
J mol−1 |
−8.71 × 10⁴ |
±0.24 |
|
f
2
|
1 |
0.116 |
±4.8 |
| ΔS3,Ads |
J K−1 mol−1 |
−143 |
±4.5 |
| ΔH3,Ads |
J mol−1 |
−1.184 × 10⁴ |
±2.9 |
|
f
3
|
1 |
0.414 |
±2.6 |
|
α
|
1 |
0.25 |
— |
This extended Temkin equation is characterized by consideration of H2 and NH3 adsorption, which is neglected in the conventional Temkin approach. Especially the relevance of H2 adsorption aligns with the observed experimental behavior and with the work of Rossetti et al.33 However, the values for ΔHAds and ΔSAds of NH3 and H2 obtained in this work are significantly higher compared to,33 resulting in a stronger inhibition of the Ru/CeO2 catalyst. The activation energy of 106 kJ mol−1 agrees well with the value of 96 kJ mol−1 for Ru/C catalysts reported by Rossetti et al.33
For the Ru/CeO2 catalyst the influence of model simplification is shown in Table 4 based on the RMSE. It can be seen that RMSE differs marginally between the fully complex (eqn (4)) and the extended Temkin model (eqn (12)), while the number of parameters is smaller for the latter. Hence, we propose eqn (12) as optimal kinetic model.
Table 4 Comparison of calculated RMSE for the Fe and Ru/CeO2 catalyst, for the conventional Temkin equation as well as for the extended Temkin equation of this work
|
|
Number of parameters |
RMSE for Fe |
RMSE for Ru/CeO2 |
| Conventional Temkin eqn (3) |
2 |
0.68% |
0.72% |
| Extended Temkin eqn (11) |
5 |
0.43% |
0.81% |
| Extended Temkin eqn (12) |
8 |
0.53% |
0.54% |
| Full complexity Temkin eqn (4) |
11 |
0.45% |
0.52% |
The parity plots shown in Fig. 6 compare the measured and simulated molar fractions of NH3 in form of distance from equilibrium according to relative errors defined in eqn (13) and (14). For simulation the above recommended kinetic model is used for both the Fe and the Ru/CeO2 catalyst. For the Fe catalyst, the relative error is within the ±10% range, while it increases in proximity to the equilibrium as observed at small ΔyNH3. However, the RMSE remains at a satisfactory value below 0.5% as shown in Table 4 for eqn (11).
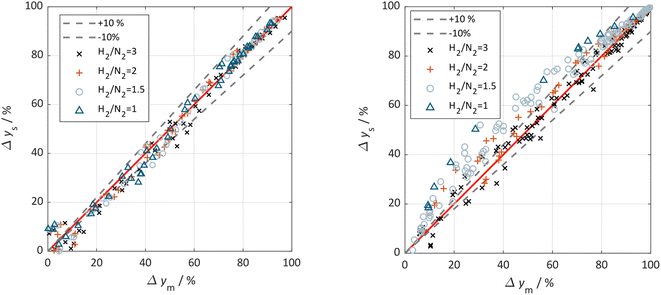 |
| | Fig. 6 Parity plot for the extended Temkin model (eqn (11)) applied to the Fe catalyst (left) and (eqn (12)) applied to the Ru/CeO2 catalyst (right). All experimental points are included and classified by the used H2/N2 ratio (3 (×), 2 (+),1.5 (o), 1 (Δ)), 0% deviation line (red) and the ±10% deviation lines (black) are given. | |
For Ru/CeO2 the deviation between experimental data and simulation is below ±10% for a stoichiometric ratio of 3 and sufficient distance from equilibrium. Increasing deviations can be observed for reaction conditions approaching the equilibrium and for low H2/N2 ratios, while the overall RMSE for the proposed eqn (12) is satisfactory with a value of 0.53% (see Table 4). The deviations in relative error at low H2/N2 ratios indicate possible mechanism changes in the reaction at high H2 molar fractions, which need further investigations. However, low H2/N2 ratios are of less relevance for technical applications. Hence, the proposed kinetic expression is suitable for application in reactor design. Further parity plots for the other kinetic model complexities can be found in the ESI.†
| |  | (13) |
| |  | (14) |
Visualization of simulated and measured results
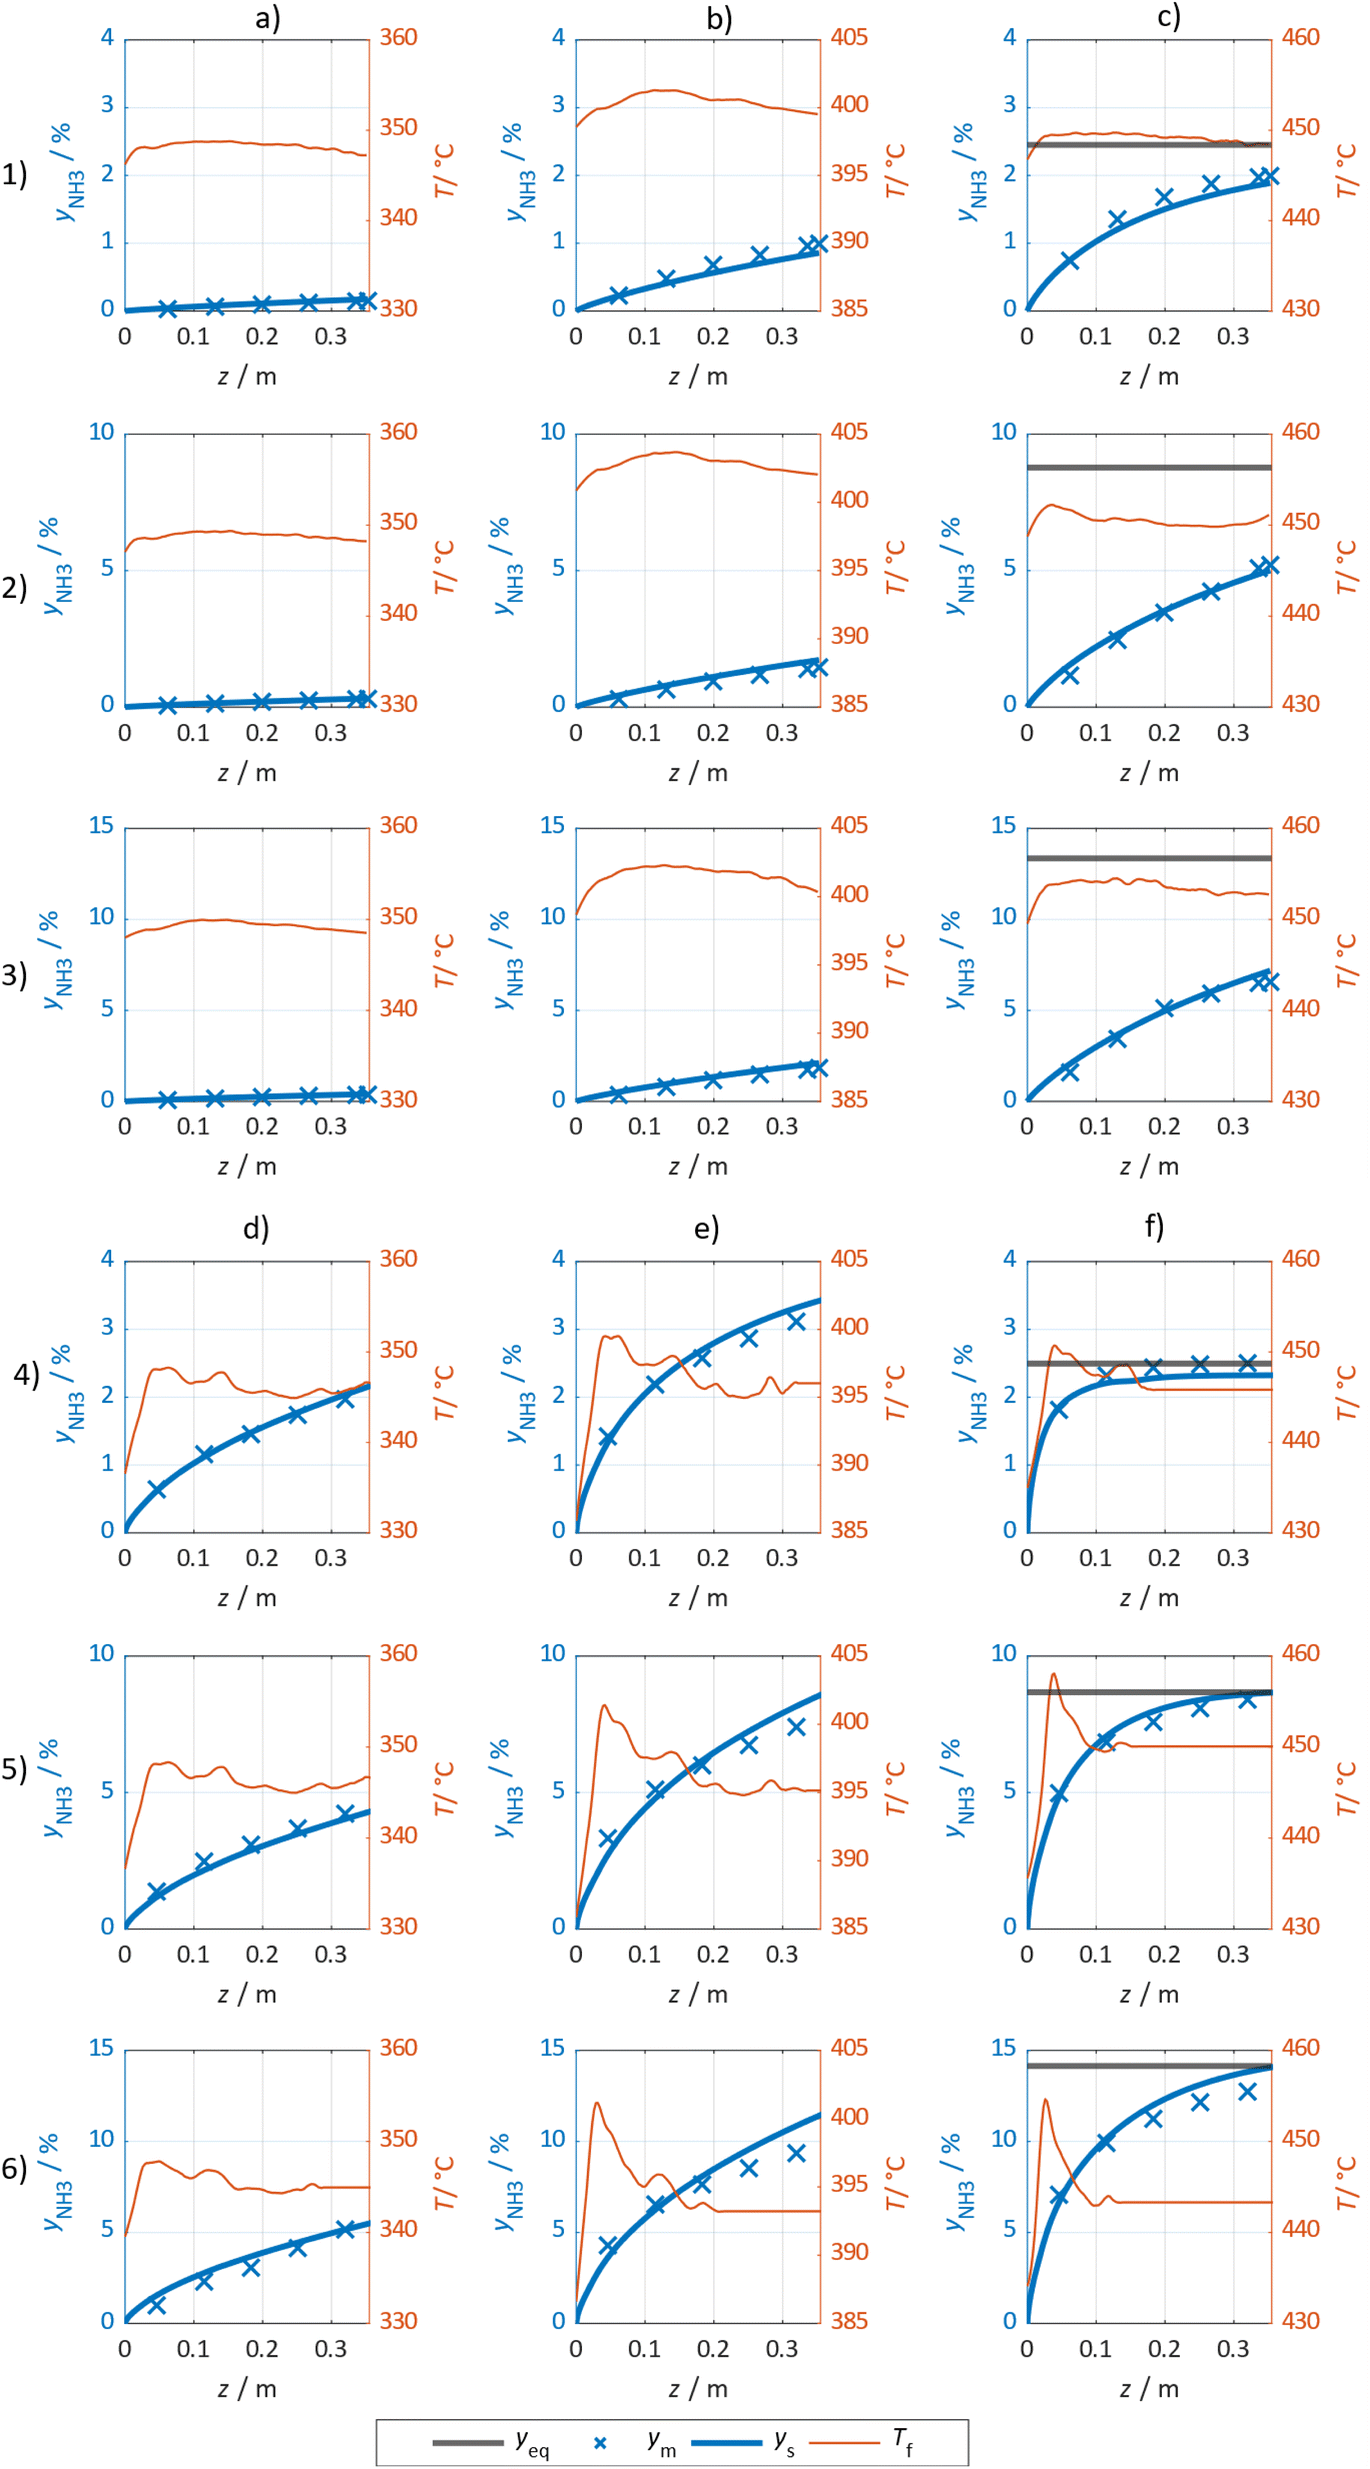
The simulated and measured molar fraction of NH3 at distinct sampling positions along the flow direction are compared in Fig. 7 for the Ru/CeO2 catalyst (columns (a) to (c) and rows (1) to (3)) and the Fe catalyst (columns (d) to (f) and rows (4) to (6)), respectively. The calculated reaction equilibrium is added, but only plotted in the visible range at 450 °C. Furthermore, the measured temperature profile is provided. Additional results are provided in the ESI.† For both catalysts, the NH3 molar fraction is increasing in axial direction asymptotically towards the thermodynamic limit at a temperature of 450 °C. Comparing the influence of pressure and temperature for both catalysts, the lower rate of formation observed for the Ru/CeO2 is visible, as it leads to lower gradients in the molar fraction and accordingly to lower heat release and less pronounced formation of a temperature hot spot. For both catalysts, the good agreement between the measured and modelled molar fractions is observed, especially in the kinetic regime.
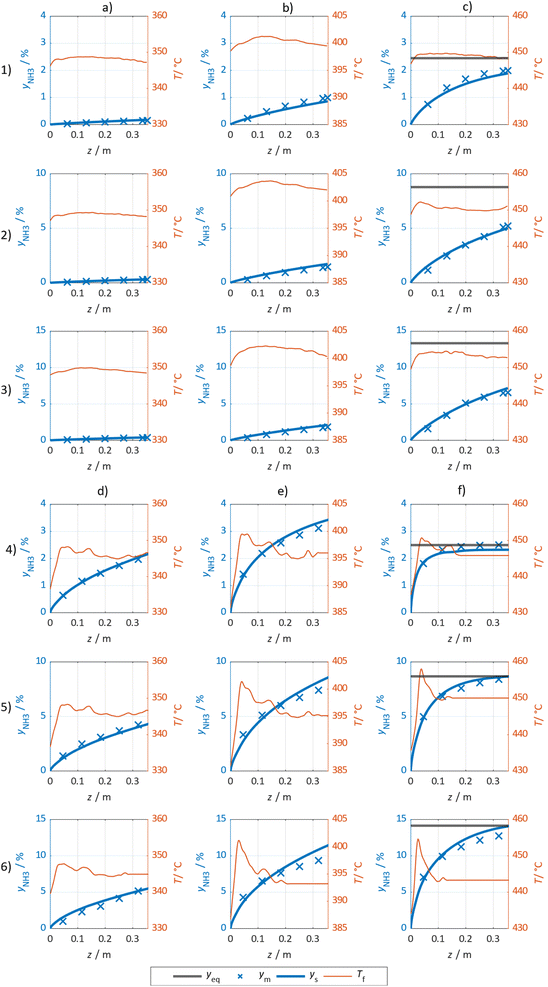 |
| | Fig. 7 Measured (markers), predicted (solid blue) and equilibrium (solid black) NH3 molar fraction (primary axis) as well as temperature (orange, secondary axis) as function of the axial position z for the Ru/CeO2 (top) and the Fe catalyst (bottom) at reaction pressure of 10 bar (row 1 and 4), 45 bar (row 2 and 5) and 80 bar (row 3 and 6) and temperatures of 350 °C (column (a and d)), 400 °C (column (b and e)) and 450 °C (column (c and f)) at a H2/N2 ratio of 3. | |
However, more significant deviations between experimental and simulated results were observed towards the reactor outlet, where the approach towards the chemical equilibrium determines the molar fraction of NH3. Thus, the kinetic regime dominates for samples taken close to the reactor inlet, while equilibrium constraints become more pronounced towards the reactor outlet. Consequently, the parameter estimation relies largely on results where superimposed equilibrium effects can be neglected. This was achieved by the weighing of model deviations as introduced in eqn (8).
Conclusions
The kinetic models for a Fe and a Ru/CeO2 catalyst were developed for reaction conditions in the range of 350 to 450 °C and 10 to 80 bar within this work. Therefore, kinetic experiments are performed to obtain spatially resolved profiles of NH3 concentration and temperature. The temperature profile was measured with a spatial resolution of 2.6 mm, while the axially distributed sampling positions with spacings of 7 cm were used to measure the gas phase composition at constant inlet flow rates. The variation of the H2/N2 feed gas ratio from 1 to 3 enabled the investigation of the influence of the H2 partial pressure on the reaction kinetics. For the Ru/CeO2 catalyst a significant inhibition of the catalyst by H2 was observed, especially at low temperatures. In contrast, a significant influence of the H2/N2 feed gas ratio on the reaction kinetics was absent for the Fe catalyst. Furthermore, a higher reaction rate is observed for the Fe compared to the Ru/CeO2 catalyst. The measurement of the axial temperature profiles and concentration profiles provides a broad data basis and considers the observed, non-isothermal behavior for parameterization of the models.
The experimental data were used for discrimination and parameterization of kinetic models based on systematic extension of the frequently used Temkin approach. For the Fe catalyst adsorption of NH3 is found to affect the kinetics significantly, while H2 and NH3 appear to be relevant for the Ru/CeO2 catalyst. Accordingly, respective sorption terms are considered in the kinetic expressions of both catalysts. For both catalysts it is shown, that the selected kinetic models provide sufficient agreement between experiment and prediction under mild reaction conditions and that further model complexity is not inevitably necessary. Hence, the developed kinetic models provide a foundation for advanced reactor design under the PtA-specific process conditions such as lower pressures and milder temperatures. Future work will focus on the application of these models to investigate new reactor and process designs, as e.g. sorption-enhance NH3 synthesis.7
Abbreviations
Latin symbols
|
a
i
| Activity of component i (1) |
|
A
R
| Cross sectional area of the reactor tube (m2) |
| CI | Relative confidence interval (%) |
|
d
F
| Outer diameter of fiber optical temperature sensor (mm) |
|
d
in
| Inner reactor diameter (mm) |
|
d
p
| Particle diameter (μm) |
|
E
A
| Activation energy (J mol−1) |
|
f
j
| Kinetic coefficient for adsorption equilibrium j (1) |
| ΔRG° | Standard Gibbs free energy of reaction (J mol−1) |
| ΔAdsHi | Specific enthalpy of adsorption of component i (J mol−1) |
| ΔHor | Enthalpy of formation under standard condition (kJ mol−1) |
|
K
eq
| Equilibrium constant of NH3 synthesis (1) |
|
k
i
| Reaction rate constant (var.) |
|
K
i
| Adsorption constant of component (1) |
|
k
i,0
| Pre-exponential factor (var.) |
|
L
bed,tot
| Total length of catalyst bed (m) |
|
L
bed(z) | Reactor length at sampling position (m) |
|
m
cat
| Catalyst mass (g) |
|
ṅ
i,in
| Molar flow of component i at reactor inlet (mol h−1) |
|
ṅ
tot,in
| Total molar flow at reactor outlet (mol h−1) |
|
ṅ
i,out
| Molar flow of component i at reactor outlet (mol h−1) |
|
Ṅ
NH3,out
| Specific molar flow rate of NH3 per mass catalyst at reactor outlet (mmol g−1 h−1) |
|
N
| Number of experimental points for each catalyst |
|
p
| Pressure (bar (gauge)) |
|
r
NH3
| Rate of formation of NH3 (mol s−1 kgcat−1) |
|
R
| Ideal gas constant (J mol−1 K−1) |
| RE | Relative error function (1) |
| RMSE | Root-mean-square-error (1) |
| ΔAdsSi | Specific entropy of adsorption of component i (J K−1 mol−1) |
|
T
| Temperature (°C) |
|
T(z) | Measured temperature at reactor length z (°C) |
|
y
eq
| Molar fraction of NH3 in equilibrium (1) |
|
y
m
| Measured molar fraction of NH3 in the gas phase (1) |
|
y
s
| Simulated molar fraction of NH3 in the gas phase (1) |
|
z
| Axial coordinate in the reactor (m) |
Greek symbols
|
α
| Kinetic coefficient of Temkin equation (1) |
|
ν
i
| Stoichiometric coefficient of component i in ammonia synthesis (1) |
|
φ
i
| Fugacity coefficient of component i (1) |
|
ψ
j
| Relative rate of formation at H2/N2 ratio j (1) |
|
ρ
b
| Estimated bulk density of catalyst |
Conflicts of interest
The authors declare that they have no known competing financial interests or personal relationships that could have appeared to influence the work reported in this paper.
Acknowledgements
This work was carried out in the framework of the “PICASO” project funded by the German Federal Ministry of Education and Research (03SF0634A). Special thanks go to Theresa Kunz of University of Ulm for scientific discussion. We thank Clariant AG for providing the Fe materials used in this work. Deutsche Bundesstiftung Umwelt (DBU) is gratefully acknowledged for funding of the work of Thomas Cholewa (FKZ 20020/671).
Notes and references
-
IPCC, Climate Change 2022, 2022 Search PubMed
 .
.
-
IEA, International Energy Agency, Ammonia Technology Roadmap. Towards More Sustainable Nitrogen Fertiliser Production, 2021 Search PubMed .
-
IEA, International Energy Agency, Global Hydrogen Review 2022, Paris, 2022, https://www.iea.org/reports/global-hydrogen-review-2022 Search PubMed .
-
M. Appl, in Ullmann's Encyclopedia of Industrial Chemistry, Wiley-VCH Verlag GmbH & Co. KGaA, Weinheim, Germany, 2012 Search PubMed .
- R. Schlögl, Catalytic synthesis of ammonia-a "never-ending story"?, Angew. Chem., Int. Ed., 2003, 42, 2004–2008 CrossRef PubMed .
-
K. H. R. Rouwenhorst, P. M. Krzywda, N. E. Benes, G. Mul and L. Lefferts, in Ullmann's Encyclopedia of Industrial Chemistry, Wiley-VCH Verlag GmbH & Co. KGaA, Weinheim, Germany, 2012, pp. 1–20 Search PubMed .
- T. Cholewa, M. Semmel, F. Mantei, R. Güttel and O. Salem, Process Intensification Strategies for Power-to-X Technologies, ChemEngineering, 2022, 6, 13 CrossRef CAS .
- C. Smith, A. K. Hill and L. Torrente-Murciano, Current and future role of Haber–Bosch ammonia in a carbon-free energy landscape, Energy Environ. Sci., 2020, 13, 331–344 RSC .
- N. Kelly, T. Gibson and D. Ouwerkerk, A solar-powered, high-efficiency hydrogen fueling system using high-pressure electrolysis of water: Design and initial results, Int. J. Hydrogen Energy, 2008, 33, 2747–2764 CrossRef CAS .
- E. Cussler, A. McCormick, M. Reese and M. Malmali, Ammonia Synthesis at Low Pressure, J. Visualized Exp., 2017 DOI:10.3791/55691 .
- M. Malmali, G. Le, J. Hendrickson, J. Prince, A. V. McCormick and E. L. Cussler, Better Absorbents for Ammonia Separation, ACS Sustain. Chem. Eng., 2018, 6, 6536–6546 CrossRef CAS .
- H. Liu, Ammonia synthesis catalyst 100 years: Practice, enlightenment and challenge, Chin. J. Catal., 2014, 35, 1619–1640 CrossRef CAS .
- J. Humphreys, R. Lan and S. Tao, Development and Recent Progress on Ammonia Synthesis Catalysts for Haber–Bosch Process, Adv. Energy Sustainability Res., 2021, 2, 2000043 CrossRef CAS .
- H. Liu, W. Han, C. Huo and Y. Cen, Development and application of wüstite-based ammonia synthesis catalysts, Catal. Today, 2020, 355, 110–127 CrossRef CAS .
-
M. V. Twigg, M. S. Spencer and J. R. Jennings, Catalytic Ammonia Synthesis, Springer US, Boston, MA, 1991 Search PubMed .
-
K. Blanchard, S. Noe and E. Plaxco, KAAP Converters: Inspection, Remediation, and Modification, Ammonia Plant Safety and Related Facilities, 2001, vol. 41, pp. 284–296, ISSN 03607011 Search PubMed .
- H. Fang, D. Liu, Y. Luo, Y. Zhou, S. Liang, X. Wang, B. Lin and L. Jiang, Challenges and Opportunities of Ru-Based Catalysts toward the Synthesis and Utilization of Ammonia, ACS Catal., 2022, 3938–3954 CrossRef CAS .
- A. Mittasch and W. Frankenburger, The historical development and theory of ammonia synthesis, J. Chem. Educ., 1929, 6, 2097 CrossRef CAS .
-
Ammonia: Catalysis and Manufacture, ed. A. Nielsen, Springer Berlin Heidelberg, Berlin, Heidelberg, 1995 Search PubMed .
- M. Temkin and V. Pyzhev, Kinetics of the synthesis of ammonia on promoted iron catalysts, Acta Physicochim. URSS, 1940, 12, 217–222 Search PubMed .
- S. Fahr, M. Schiedeck, J. Schwarzhuber, S. Rehfeldt, A. Peschel and H. Klein, Design and thermodynamic analysis of a large-scale ammonia reactor for increased load flexibility, Chem. Eng. J., 2023, 471, 144612 CrossRef CAS .
- A. Shamiri and N. Aliabadi, Modeling and performance improvement of an industrial ammonia synthesis reactor, Chem. Eng. J. Adv., 2021, 8, 100177 CrossRef CAS .
- T. Xie, S. Xia and C. Wang, Multi-Objective Optimization of Braun-Type Exothermic Reactor for Ammonia
Synthesis, Entropy, 2022, 24, 52 CrossRef CAS PubMed .
- A. Mirvakili, Z. Eksiri, P. Biniaz and N. Mohaghegh, Two-dimensional mathematical modeling of an industrial ammonia synthesis reactor with CFD analysis, J. Taiwan Inst. Chem. Eng., 2021, 121, 1–19 CrossRef CAS .
- A. Nikzad, D. Iranshahi, M. Ranjbaran and E. Bagherpour-Ardakani, Conceptual comparison of three novel configurations in the spherical radial flow reactor for ammonia production, Fuel, 2022, 321, 123945 CrossRef CAS .
- M. Yoshida, T. Ogawa, Y. Imamura and K. N. Ishihara, Economies of scale in ammonia synthesis loops embedded with iron- and ruthenium-based catalysts, Int. J. Hydrogen Energy, 2021, 46(57), 28840–28854 CrossRef CAS .
- G. Chehade and I. Dincer, Advanced kinetic modelling and simulation of a new small modular ammonia production unit, Chem. Eng. Sci., 2021, 236, 116512 CrossRef CAS .
-
F. Nestler, Dynamic Operation of Power-To-X Processes Demonstrated by Methanol Synthesis, 2022 Search PubMed .
-
F. M. Dautzenberg, in Deactivation and Testing of Hydrocarbon-Processing Catalysts, ed. J. P. O'Connell, T. Takatsuka and G. L. Woolery, American Chemical Society, Washington, DC, 1996, pp. 99–119 Search PubMed .
-
H. S. Fogler, and M. N. Gürmen, Elements of Chemical Reaction Engineering, Prentice Hall PTR/Pearson Education Internat, Upper Saddle River, NJ [u.a.], 3rd edn, 2004, zuletzt geprüft am 06.09.2016 Search PubMed .
- G. Ertl, Primary steps in catalytic synthesis of ammonia, J. Vac. Sci. Technol., A, 1983, 1, 1247–1253 CrossRef CAS .
- A. Ozaki, H. Stott Taylor and M. Boudart, Kinetics and mechanism of the ammonia synthesis, Proc. R. Soc. London, Ser. A, 1960, 258, 47–62 CAS .
- I. Rossetti, N. Pernicone, F. Ferrero and L. Forni, Kinetic Study of Ammonia Synthesis on a Promoted Ru/C Catalyst, Ind. Eng. Chem. Res., 2006, 45, 4150–4155 CrossRef CAS .
- D. C. Dyson and J. M. Simon, Kinetic Expression with Diffusion Correction for Ammonia Synthesis on Industrial Catalyst, Ind. Eng. Chem. Fundam., 1968, 7, 605–610 CrossRef CAS .
- A. Tripodi, F. Conte and I. Rossetti, Process Intensification for Ammonia Synthesis in Multibed Reactors with Fe-Wustite and Ru/C Catalysts, Ind. Eng. Chem. Res., 2021, 60, 908–915 CrossRef CAS .
- J. A. Nelder and R. Mead, A Simplex Method for Function Minimization, Comput. J., 1965, 7, 308–313 CrossRef .
- M. Semmel, L. Steiner, M. Bontrup, J. Sauer and O. Salem, Catalyst screening and reaction kinetics of liquid phase DME synthesis under reactive distillation conditions, Chem. Eng. J., 2022, 140525 Search PubMed .
- K. Aika, M. Kumasaka, T. Oma, O. Kato, H. Matsuda, N. Watanabe, K. Yamazaki, A. Ozaki and T. Onishi, Support and promoter effect of ruthenium catalyst. III. Kinetics of ammonia synthesis over various Ru catalysts, Appl. Catal., 1986, 28, 57–68 CrossRef CAS .
- F. Rosowski, A. Hornung, O. Hinrichsen, D. Herein, M. Muhler and G. Ertl, Ruthenium catalysts for ammonia synthesis at high pressures: Preparation, characterization, and power-law kinetics, Appl. Catal., A, 1997, 151, 443–460 CrossRef CAS .
- O. Hinrichsen, F. Rosowski, A. Hornung, M. Muhler and G. Ertl, The Kinetics of Ammonia Synthesis over Ru-Based Catalysts, J. Catal., 1997, 165, 33–44 CrossRef CAS .
-
H. Liu, Ammonia Synthesis Catalysts. Innovation and Practice, World Scientific Pub. Co, Singapore, Hackensack, N.J, Beijing, 2013 Search PubMed .
Footnotes |
| † Electronic supplementary information (ESI) available. See DOI: https://doi.org/10.1039/d4se00254g |
| ‡ Current address: Air Company, 407 Johnson Avenue, Brooklyn, New York. |
|
| This journal is © The Royal Society of Chemistry 2024 |

 Open Access Article
 This Open Access Article is licensed under a
  *ab,
B.
Steinbach
a,
C.
Heim
a,
F.
Nestler
*ab,
B.
Steinbach
a,
C.
Heim
a,
F.
Nestler