
 Open Access Article
 This Open Access Article is licensed under a Creative Commons Attribution-Non Commercial 3.0 Unported Licence
A light-driven photosynthetic microbial fuel cell for carbon-negative bioelectricity production †
Won Gyeong
Park
a,
Minsoo
Kim
a,
Shuwei
Li
a,
Eunseo
Kim
a,
Eun Joo
Park
a,
Jiin
Yoo
a,
Nagesh
Maile
ac,
Jungho
Jae
 ac,
Hyoung-il
Kim
b and
Jung Rae
Kim
*ac
ac,
Hyoung-il
Kim
b and
Jung Rae
Kim
*ac
aSchool of Chemical Engineering, Pusan National University, Busan, 46241, Republic of Korea. E-mail: j.kim@pusan.ac.kr; Fax: +82.51.510.3943; Tel: +82.51.510.2393
bSchool of Civil & Environmental Engineering, Yonsei University, Seoul, 03722, Republic of Korea
cInstitute for Environmental Energy, Pusan National University, Busan, 46241, Republic of Korea
First published on 26th April 2024
Abstract
Microbial fuel cells (MFCs) can convert chemical energy into electrical energy directly through the decomposition of organic matter by electroactive bacteria (EAB). In this process, many research groups have investigated MFCs under dark conditions, but few studies have examined those operated under light conditions. This study compared the photosynthetic MFC under light conditions (P-MFC) and MFC under dark conditions (D-MFC) for bioelectricity production and power density. The electroactive photosynthetic microbial community was enriched in the anode chamber of P-MFC. The acetate consumption and COD removal rate of the P-MFC were two times faster than that of D-MFC. The volume of effluent biogas (e.g., CO2 and CH4) from the decomposition of organic matter in the P-MFC was significantly lower than that from the D-MFC. Under light conditions, the electroactive photosynthetic microbial community assimilates the CO2 produced by organic decomposition. Field emission scanning electron microscopy of P-MFC revealed aggregated electroactive cells with a fibrous appendage on the carbon surface. P-MFC also revealed a higher maximum power density (836 mW m−2) than D-MFC (592 mW m−2). This study provides a new concept for photosynthetic microbial fuel cells for bioelectricity production without CO2 emissions.
1. Introduction
Microbial fuel cells (MFCs) utilize biodegradable organic waste and biomass directly to produce bioelectricity using electroactive bacteria (EAB) as the biocatalyst.1 MFCs consist of anode and cathode chambers, separated by an ion exchange membrane and external resistance for current flow.2 In the anode chamber, exoelectrogens (e.g., Geobacter sulfurreducens and Shewanella oneidensis), which can transfer electrons to the terminal electron acceptors outside the cell, oxidize various organic matter and produce electrons and protons.3 These electrons and protons are transferred to the cathode chamber via an external circuit and ion exchange membrane, respectively, and a terminal electron acceptor (e.g., O2, ferricyanide) is reduced to produce bioelectricity through the cathode electrode.MFCs use the wastewater sludge collected from anaerobic digestion (AD) as the inoculum because it contains abundant exoelectrogens.4 Thus, most MFCs were operated in the dark or regardless of light to increase electron transfer to the electrode while minimizing electron loss for photosynthesis. On the other hand, MFCs, under dark conditions, frequently produce large amounts of CO2, a major gas produced from organic matter degradation. Although MFCs produce renewable bioelectricity and simultaneously enable sustainable wastewater treatment, CO2 production in the anodic chamber has been a concern to mitigate greenhouse gas emissions.5
Carbon capture and storage (CCU) technologies for a net-zero process have attracted considerable attention. Achieving a carbon neutral and carbon negative MFC process requires the elimination of the CO2 emitted through an additional removal process (e.g., membrane separation, cryogenic distillation, or adsorption/absorption), but such physicochemical processes are highly energy-intensive under harsh operational conditions (high pressures and temperatures) and may produce secondary environmental problems.6
As an alternative, biological CO2 removal, such as microbial carbon capture cells (MCCs), are emerging to store or utilize CO2 directly within the bioprocess.7–9 MCCs use photosynthetic microorganisms, such as algae or cyanobacteria, in the cathode chamber to fix CO2 into the biomass. Therefore, under light conditions, the O2 generated can be used for the cathodic reduction reaction to eliminate additional aeration to some extent.10,11 Several studies on photosynthetic MFCs focused on algal biomass production in the cathode chamber. In a few studies, pure strains of anoxygenic phototrophic bacteria (APB) were used in the anode chamber to increase the power output (Table 1).
| Inoculum | Inoculated chamber | MFC configuration | Electron acceptor (in cathode chamber) | Power output | References |
|---|---|---|---|---|---|
| Rhodobacter capsulatus | Anodic | Dual chamber | KMnO4 | 1.8 mW m−2 | 44 |
| Rhodobacter sphaeroides | Anodic | Dual chamber | MnO4− | 408.06 mW m−2 | 45 |
| Rhodopseudomonas sp. | Anodic | Dual chamber | Microalgae strain | 221 mW m−2 | 46 |
| Nitzschia palea (Diatom) | Anodic | Dual chamber | KMnO4 | 12.62 mW m−2 | 47 |
| Hybrid APB | Anodic | Dual chamber | K3[Fe(CN)6] | — | 48 |
| Rhodopseudomonas palustris G11 | Anodic | Single chamber | O2 | 0.15 mW m−2 | 13 |
| Cladophora sp. | Cathodic | Single chamber | O2 | 619.1 mW m−2 | 49 |
| Chlamydomonas reinhardtii | Cathodic | Dual chamber | O2 | 15.21 W m−3 | 50 |
| Synechococcus sp. | Cathodic | Dual chamber | O2 | 41.5 ± 1.2 mW m−2 | 51 |
| Chlorella vulgaris | Cathodic | Dual chamber | O2 | 126 mW m−3 | 52 |
| Photosynthetic electroactive microbial community | Anodic | Dual chamber | K3[Fe(CN)6] | 836 mW m−2 | This study |
In contrast to the cathode-driven MCCs, electroactive photosynthetic microorganisms can also be applied to the anode previously reported for photosynthetic microbial fuel cells (PMFCs).12 Such PMFCs generally use pure culture strains, such as Rhodopseudomonas palustris G11, Spirulina platensis, and Chlorella pyrenoidosa, which produce electricity with light. On the other hand, little research with mixed cultures has been conducted because of the difficulty of controlling the microbial community under light conditions.13–15 From the viewpoint of the inoculum, mixed microbial communities are more robust to contamination, feasible operational parameters, and scale-up than pure cultures when the appropriate control strategy is applied.16
In this study, CO2 reuptake was investigated by operating a photosynthetic microbial fuel cell under light conditions (P-MFC) using a mixed culture in the anode chamber. The behavior of the electroactive microbial communities enriched under light was compared with the control cultivated under dark conditions (D-MFC). To the best of the authors' knowledge, this is the first study to evaluate the performance of light-driven P-MFC to metabolize CO2 compared to the conventional dark-enriched counterpart and achieve a carbon-negative MFC process.
2. Experimental
2.1 MFC setup and operation
Dual-chamber H-Type MFC reactors were constructed using two glass bottles (330 mL, Duran, USA) with both working volumes of 250 mL and a proton exchange membrane (5 cm × 5 cm PEM, Nafion™ 117, Fuel Cell Store, USA). All side arms of the chamber were sealed with butyl rubber stoppers and aluminum seals (three for the anode chamber and two for the cathode chamber). The anode (3 cm × 6 cm) and cathode (4 cm × 7 cm) were graphite felt (G200-2911, Fuel Cell Store, USA). The electrodes were connected to a 1000 Ω external resistance through a titanium wire used as a current collector. The Ag/AgCl reference electrode (3 M KCl solution) was inserted into the anode chamber for electrochemical analysis.Anaerobic secondary digester sludge (Suyoung Wastewater Treatment Plant, Busan, Korea) was used as the inoculum. The sludge was stored in an anaerobic container under anaerobic conditions in a 4 °C refrigerator before use. The anolyte of MFC was inoculated with 50 mL (20% of the total medium) of anaerobic sludge. The anolyte (bacterial media) contained the following (g L−1): CH3COONa 3.28, NH4Cl 0.23, MgCl2·7H2O 0.01, NaCl 0.04, KCl 0.02, KH2PO4 2.62, and K2HPO4 5.36 were added. The catholyte contained the following (g L−1): KH2PO4 2.62, K2HPO4 5.36, and K3(FE(CN)6) 16.463 were added. The experimental solutions were prepared using distilled water and deionized water from a Millipore Milli-Q system.
The voltage of all reactors was monitored using a multimeter (15B Digital multimeter, Fluke, USA) connected in parallel to the electrodes. The anolyte and catholyte were replaced when the total cell voltage dropped below 300 mV. After replacing the inoculation and medium, the anode chamber was bubbled with 100% N2 for 15 minutes at 10 mL min−1 to achieve anaerobic conditions.
The P-MFC (enriched in light conditions) was illuminated using a 6000 ± 500 lx white/yellow mix LED lamp at 30 ± 3 °C in an incubator. The D-MFC (enriched in dark conditions) was operated at 30 ± 3 °C in another incubator in the dark. All reactors were performed in batch mode, and the anodic solution was stirred with a magnetic stirring bar at 130 rpm. All experiments were conducted in triplicate.
2.2 Characterization of the bioanode microbial community
After the enrichment phase under different light conditions (i.e., light vs. dark), the absorbance characteristics of the culture broth were investigated over the wavelength range of 300 and 900 nm using an ultraviolet-visible spectrophotometer (UV-vis, Optizen POP QX, Mecasys Co., Ltd, Daejeon, Korea). The anode surface-attached cells were extracted using the following methods. The anode electrodes (sliced into 0.4 × 0.4 cm pieces) were placed in polypropylene centrifuge tubes containing 1 mL of a 0.2 M NaOH/PBS solution and heated to 95 °C for two hours. The solution was sonicated in an ultrasonic bath for 10 min and centrifuged at 5000 rpm for 20 min to obtain the colored supernatant separated from the cells.17,18The microbial communities were sampled from the anodic biofilm and planktonic cells in the anolyte and characterized by next-generation sequencing (NGS, Macrogen, Korea) as reported elsewhere.19
2.3 Analytical methods
Bioelectricity production in the MFCs was measured manually using a multimeter connected in parallel to each reactor. The current (I) was calculated, as expressed in eqn (1):| I = V/R | (1) |
| P = (I × V)/A | (2) |
For the power density curve, polarization data were also obtained manually using an external load resistance box (RBOX 408, Lutron, Taiwan) from 100 kΩ to 100 Ω with sufficient transition time (from 30 min to 1 h) to stabilize the MFC conditions. The power density was based on the anode projected area (18 cm2).
A sample of the headspace gas was taken using a pressure-lock syringe (250 μL, Hamilton, USA) and analyzed by gas chromatography (6500 GC Agilent Technologies, Young Lin Instrument Co. Anyang, Korea) using a Porapak N column (10 ft × 1/8 in × 2.1 mm) and Mol sieve 13× (3 ft × 1/8 in × 2.1 mm). The carrier gas was argon (Ar), and the flow rate was 14 mL min−1. CH4 and CO2 were detected using a flame ionization detector (FID), and the other gas components were detected using a thermal conductivity detector (TCD). The injector, oven, FID, and TCD temperatures were 150 °C, 48 °C, 250 °C, and 100 °C, respectively.
A liquid sample (1 mL) was collected from the anode chamber and filtered through a syringe filter (0.22 μm, Shanghai Instrument Consumables Co., Shanghai, China). The filtered anolyte samples were analyzed by high-performance liquid chromatography (HPLC, Agilent 1100 series Agilent Technologies, Santa Clara, CA, USA) equipped with a 300 × 7.8 mm Aminex HPX-87H (Bio-Rad, Santa Clara, CA, USA) column at 65 °C. The mobile phase was a 2.5 mM H2SO4 solution (flow rate = 0.5 mL s−1), and quantification was performed using refractive index (RI) and photodiode array (PDA) detectors.
The chemical oxygen demand (COD) of the anolyte was measured using a colorimeter (AquaFast AQ4000, Thermo Scientific Orion) at a wavelength of 610 nm, a thermo-reactor (COD125 thermo-reactor, Thermo Scientific Orion), and an Orion CODH00 (0 to 1500 mg L−1) kit. Owing to the high COD concentration in the anolyte, each liquid sample (1 mL) was diluted 10-fold with distilled water. Samples with reagents were incubated at 150 °C for 120 min in the thermo-reactor. After cooling the samples to room temperature, the values were recorded as mg L−1. The COD removal rate (mg per L per day) was estimated using eqn (3):
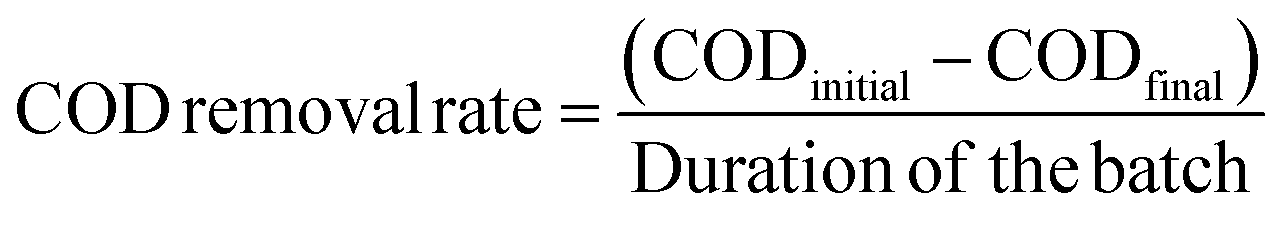 | (3) |
The electrochemical analysis of biofilm-developed anodes was investigated by cyclic voltammetry (CV) using a potentiostat (VersaSTAT 3, AMETEK, USA) and Versa StudioTM Software (AMETEK, USA). A three-electrode system was used with the anode, the cathode, and Ag/AgCl (3 M KCl) as the working, counter, and reference electrodes, respectively, using the scan range of −0.7 to 0.4 V (vs. Ag/AgCl) and a scan rate of 1 mV s−1.
2.4 Morphology of biofilm on anodes
The biofilm morphology on the anode surface was investigated by field emission scanning electron microscopy (FE-SEM, GEMINI SEM500, ZEISS, Germany). For sample preparation, the anodes were sliced into 0.4 × 0.4 cm pieces using a razor knife and rinsed gently with the medium. The sliced samples were soaked immediately into 2.5% glutaraldehyde, washed three times with 0.1 M phosphate buffer, and dehydrated successively with 30%, 50%, 70%, 85%, 90%, and 100% ethanol solutions (15 min each). The samples were dried using a freeze drier (FD8508, Ilshin, Korea) and coated with platinum using a coater (Q150TS, QUORUM, UK).3. Results and discussion
3.1 Enrichment of the anodic microbial community in P-MFC and D-MFC
Different electroactive microbial communities were enriched over 10 days under light and dark conditions referred to as P- and D-MFC, respectively. Fig. 1 presents the bioelectricity and gas production in the anode chamber during the enrichment phase. The P-MFC showed a faster start-up of bioelectricity production within one to two days than the D-MFC (Fig. 1a). The P-MFC reached a maximum cell voltage (>600 mV) after three days, whereas it was delayed in the D-MFC. The high voltages of P-MFC and D-MFC were maintained for four days and decreased to less than 300 mV at the end of the cycle due to depletion of the carbon sources in the anode chamber.20 The voltage of the P-MFC tended to decrease more rapidly (within a day) than that of the D-MFC. In particular, the anode chamber of the P-MFC became red compared to that of the D-MFC during the enrichment stage. This is frequently observed in many MFC operations.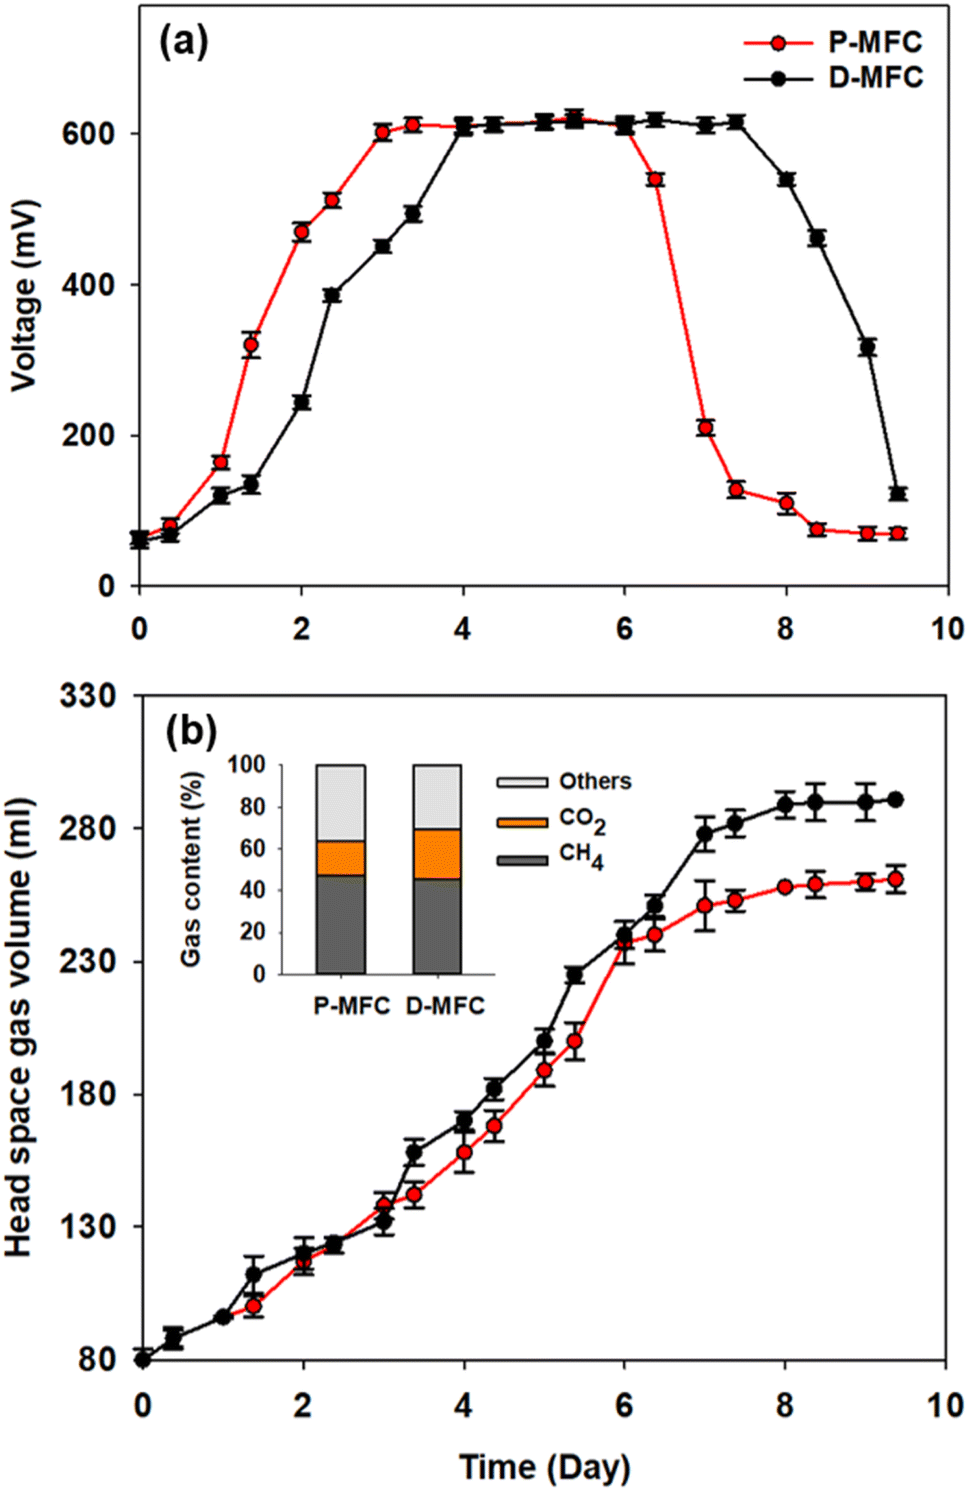 | ||
| Fig. 1 (a) Bioelectricity production and (b) headspace gas volume in the anode chamber of P-MFC and D-MFC during the enrichment phase. The total gas composition on day 9 was represented. The voltage output is the mean value of triplicate experiments. Abbreviations: P-MFC (photosynthetic MFC enriched under light conditions), D-MFC (MFC enriched under dark conditions). | ||
Fig. 1b shows the headspace gas volume in the anode chamber. Biogas was produced from the decomposition of organic matter by electroactive bacteria. At the end of the first batch cycle (day 9), the total gas contents were measured periodically. The total gas volume of the D-MFC was 290 ± 10 mL (45.7% of CH4 and 23.4% of CO2 with N2 as the balance), while that of the P-MFC was 260 ± 10 mL (47% of CH4 and 17% of CO2 with N2 as the balance). In both MFCs, CO2 and CH4 were the major components of biogas, but the CO2 content in the P-MFC was 7% lower than that in the D-MFC. These findings suggest that a photosynthetic microbial community capable of utilizing CO2 might be dominant in the P-MFC compared to the D-MFC. Previous studies on MFCs using anoxygenic phototrophic bacteria (e.g., Rhodopseudomonas palustris) utilized CO2 through interactions of the anodic microbial community with simultaneous bioelectricity generation.12,21
The anolyte color of the P-MFC changed to red and became thicker with operation under light during enrichment. On the other hand, the D-MFC showed no color change (Fig. S1†). The color of the cells attached to the anode was also reddish only in the P-MFC (Fig. S2†). The presence of red/purple pigment can be an indicator of the dominant purple bacteria, which are capable of photosynthesis.22 Pigment analysis was carried out on the specific microbial community formed in the P-MFC that emitted red color. The absorption spectrum was measured from 300 to 900 nm, and a distinctive peak at 400 nm was observed only in the P-MFC (Fig. 2). Carotenoid, a major pigment of photosynthetic bacteria, absorbs from 400 to 500 nm.23,24 The presence of carotenoid pigments suggests that the dominant electroactive photosynthetic microbial community in the P-MFC differs from the D-MFC.
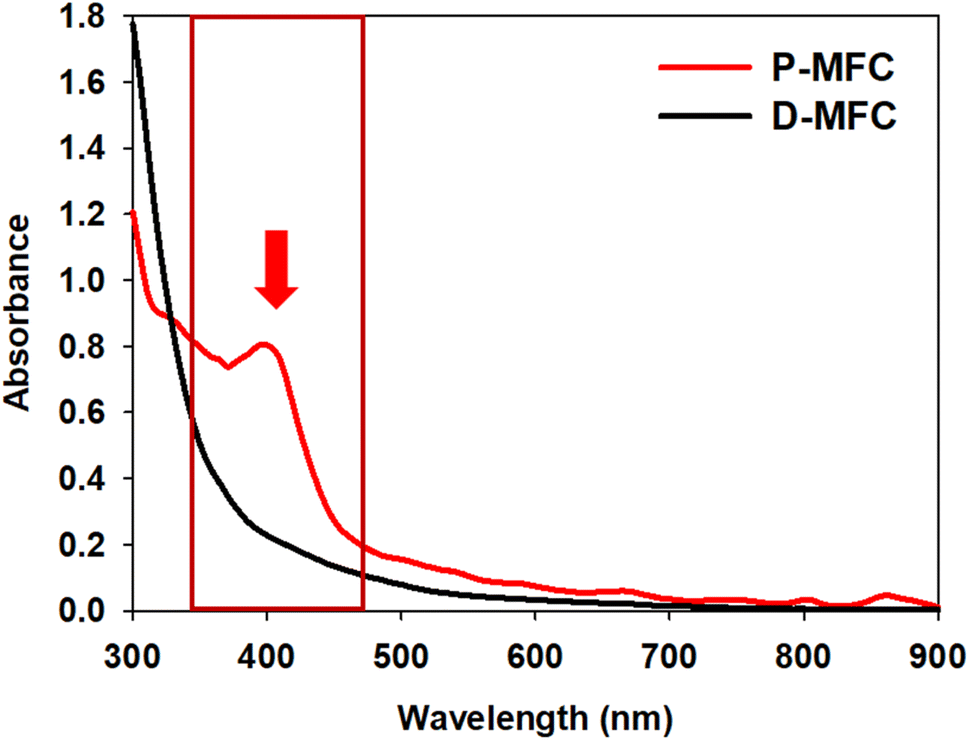 | ||
| Fig. 2 UV-vis absorption spectra of planktonic and electrode-attached cells on day 9 of the enrichment phase. The red arrow and box indicate that a 400 nm peak only appeared in P-MFC. | ||
The NGS results showed more specific microbial communities at the genus level (Fig. 3). Rhodopseudomonas sp. was dominant for both planktonic cells (67.8%) and electrode-attached cells (64.4%) in the P-MFC after enrichment. Rhodopseudomonas sp. is an anaerobic photosynthetic purple non-sulfur genus used frequently as a model genus for photosynthetic microbial fuel cells.25,26 Such species have also been reported to be electroactive bacteria (EAB) with high-power generation capability. The extracellular electron transfer (EET) of Rhodopseudomonas sp. was comparable to that of Geobacter, which has been studied extensively as EAB genera.27,28 The other electrode-attached cells (EAC) were in the order of Dysgonomonas (5.86%), Pseudomonas (2.6%), and Geobacter (1.46%), while the planktonic cells (PC) showed a distribution of Dysgonomonas (16.45%) and Pseudomonas (3.43%) (Fig. 3a). The presence of Dysgonomonas (belonging to Bacteroidia), which transfer electrons via direct electron transfer (DET), may enhance the current density of MFC.29,30Pseudomonas is also an EAB that can produce high redox-active endogenous mediators, such as pyocyanin (PYO). The bacteria can be an electron shuttle to transfer electrons from the cells to the anode in the MFC process.31,32
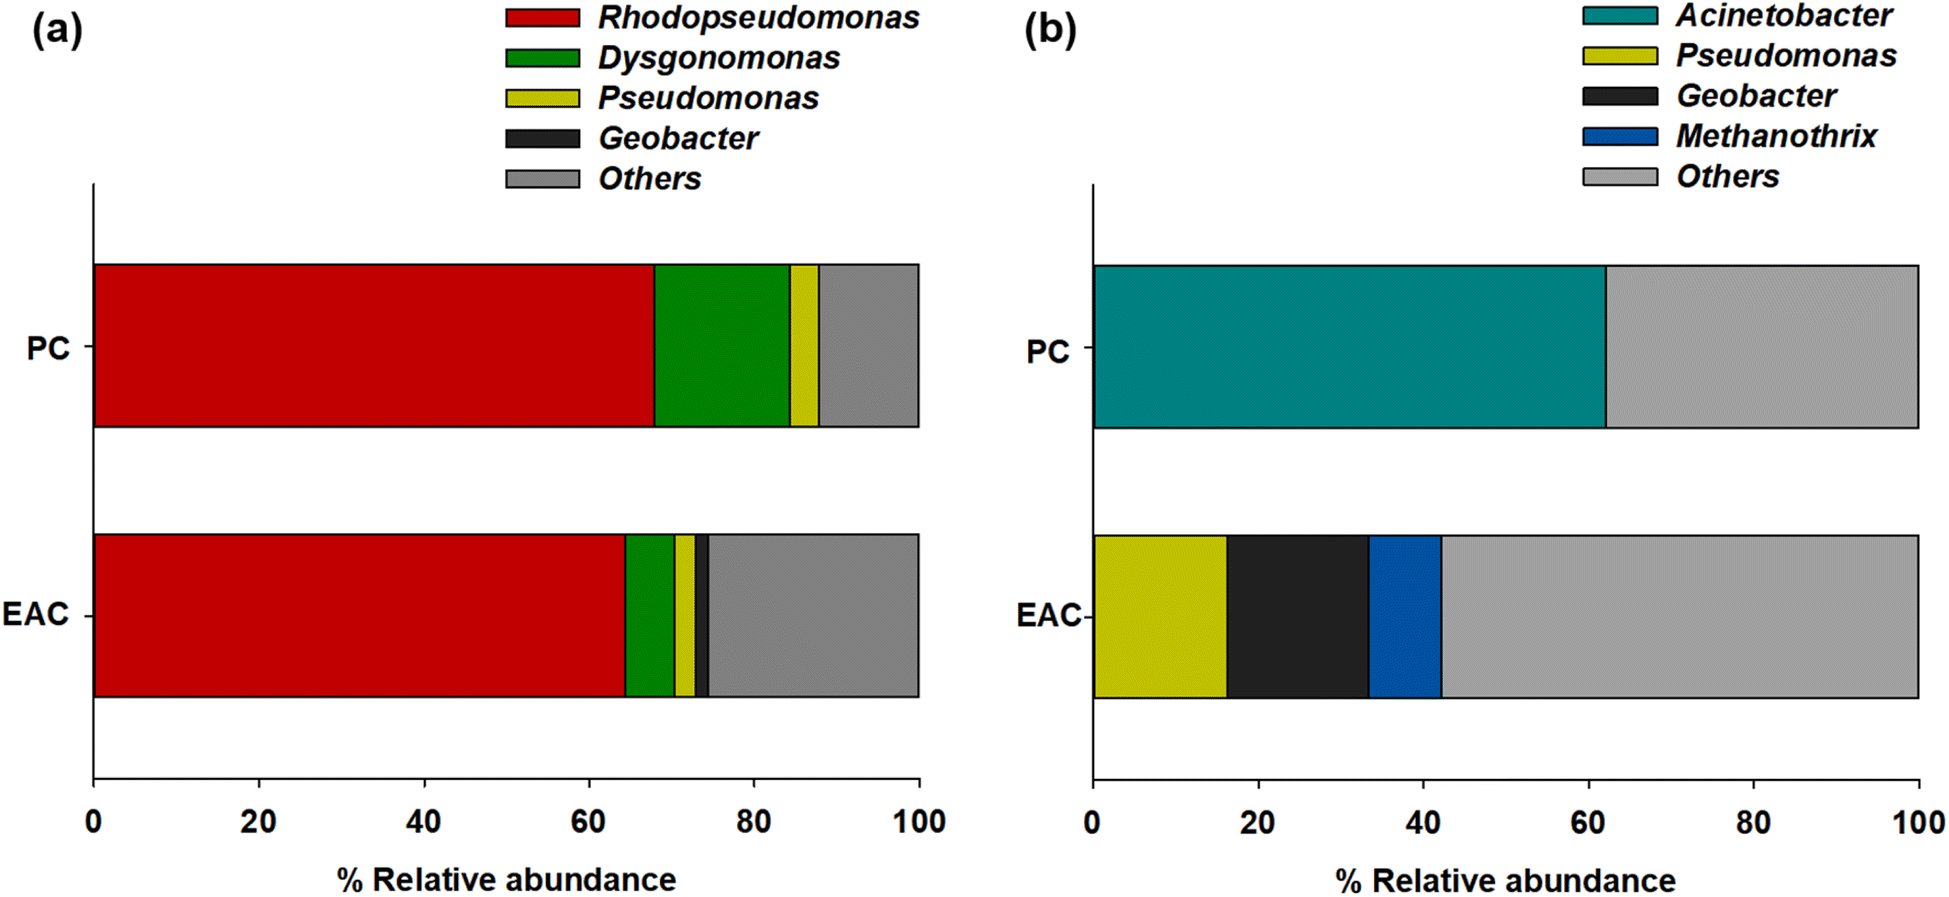 | ||
| Fig. 3 Relative abundance of major taxonomic groups of (a) P-MFC and (b) D-MFC on day 9 of the enrichment phase. Abbreviations: EAC (electrode attached cells), PC (planktonic cells). | ||
Fig. 3b presents the anodic microbial diversity of D-MFC. In the planktonic cells (PC), Acinetobacter (62.02%), a fermentative bacterial species with a carbohydrate metabolism, was the most predominant. Previous studies reported that Acinetobacter using H2 as an electron donor was predominant in the MFC.33 In the electrode-attached cells (EAC), Geobacter (17.09%) was the most abundant classification, followed by Pseudomonas (16.25%) and Methanothrix (8.82%), all of which can decompose acetate to CH4 and CO2 under anaerobic conditions.34
The NGS results revealed different microbial communities of P- and D-MFC, even though they were inoculated with the same inoculum at the start-up. Unlike the D-MFC, which only contained the EAB community, the P-MFC consisted of photosynthetic electroactive bacteria capable of utilizing CO2 and EAB.
3.2 Comparison of organic removal in P-MFC and D-MFC
After the first batch cycle in the enrichment phase, the anolytes were replaced with fresh medium, including acetate, immediately after the carbon source had been depleted. The performance of P-MFC and D-MFC were compared from the second batch cycle, as shown in Fig. 4, with the starting time set to day 0. Bioelectricity generation was significantly different in both MFCs (Fig. 4a). The D-MFC reached a voltage of 510 mV on day 1, which was maintained for 12 days. On the other hand, the P-MFC produced a higher voltage of 614 mV, but for only four days. The medium was then replaced to supplement the consumed acetate. With fresh media, the P-MFC produced a similar voltage (∼631 mV) for five days, decreasing gradually. Fig. 4b presents the acetate concentration during cultivation, indicating that acetate degradation in P-MFC was much faster than in D-MFC.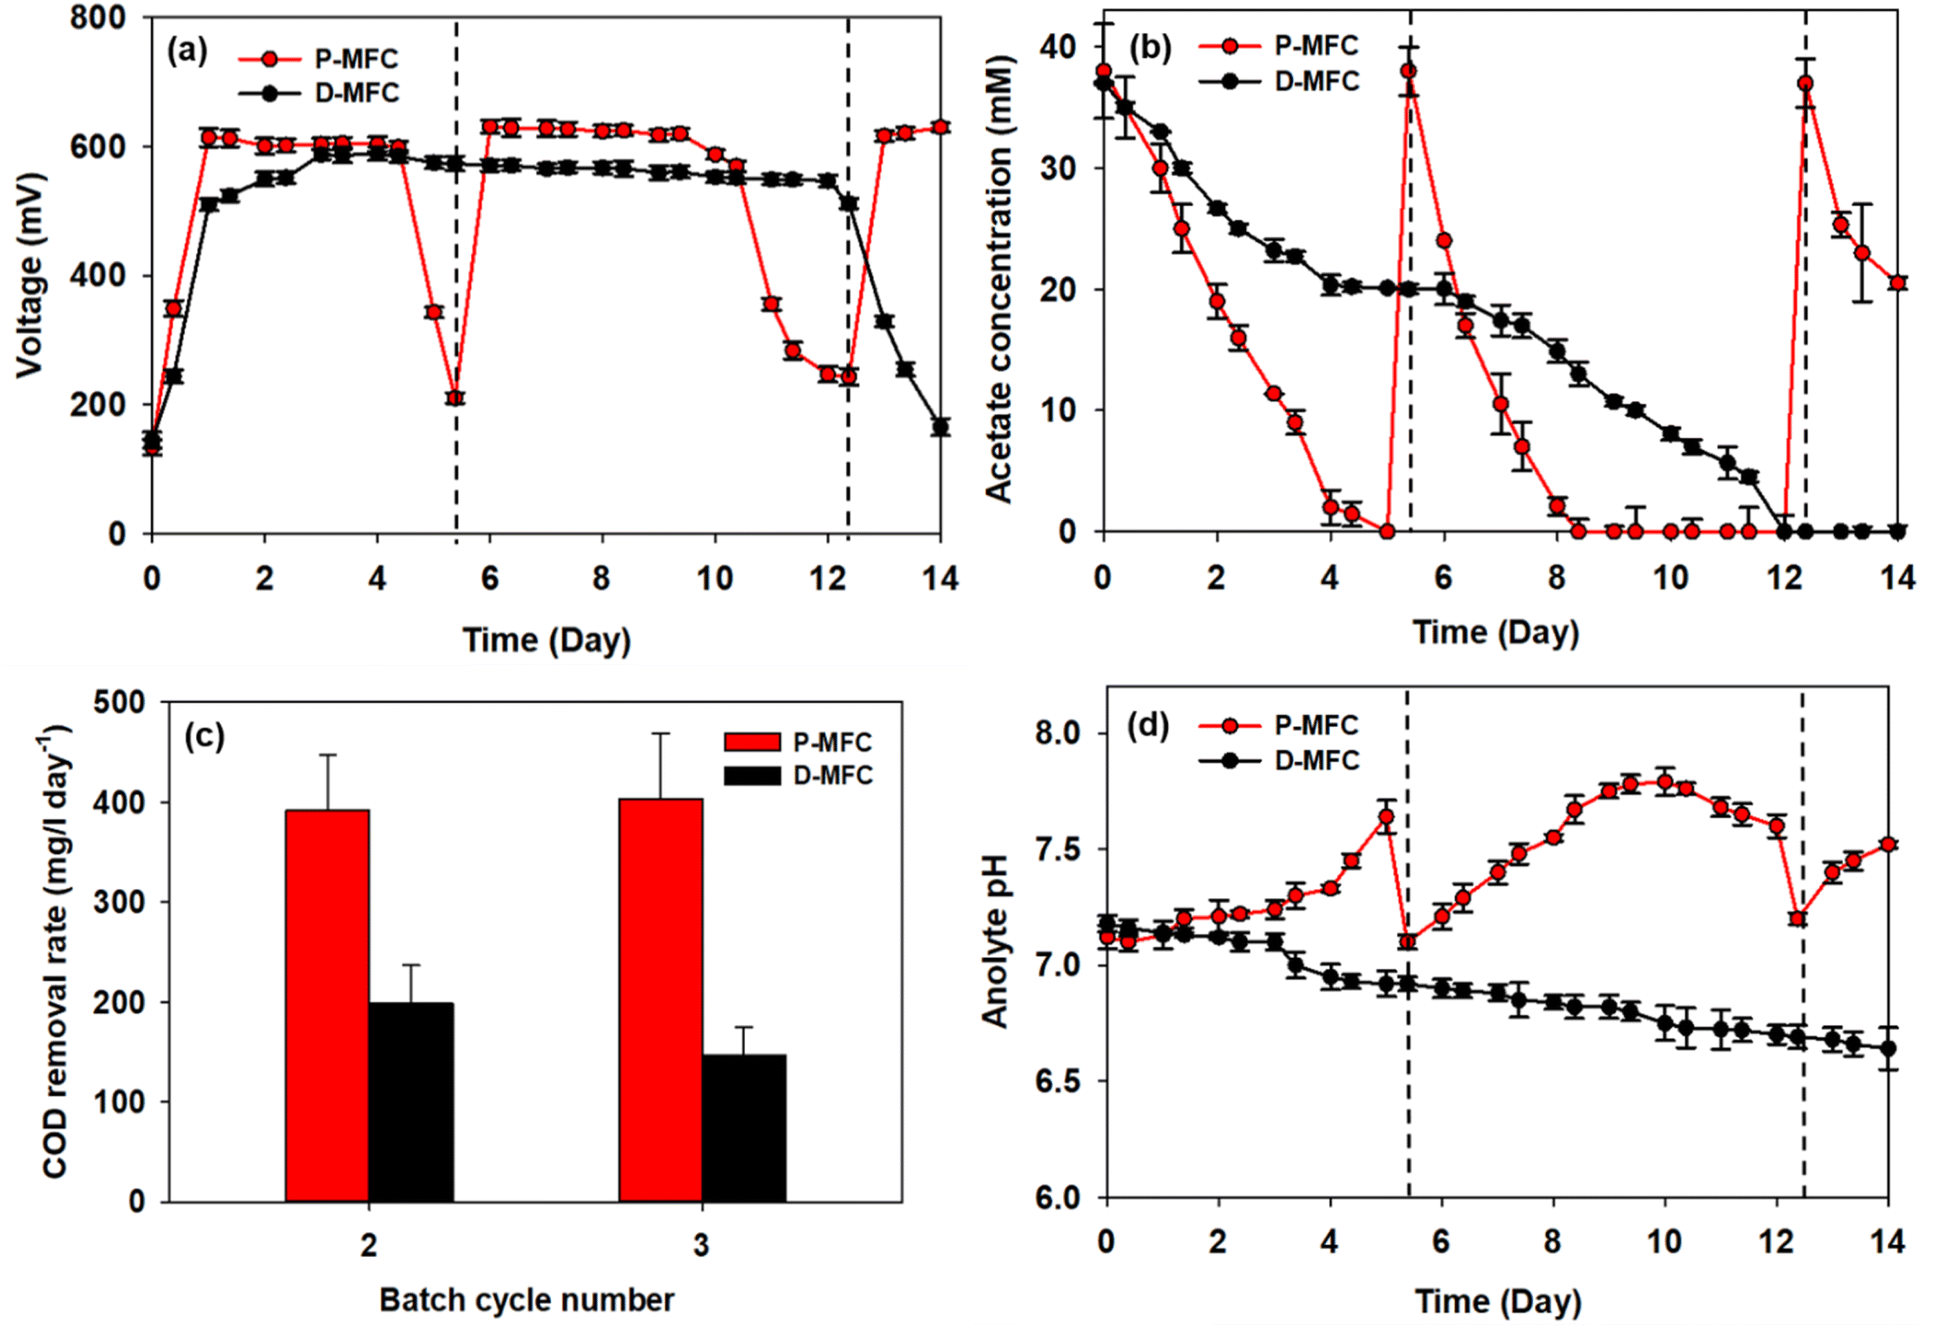 | ||
| Fig. 4 (a) Bioelectricity production, (b) acetate concentration in anolyte, (c) COD removal rate for each batch, and (d) anolyte pH of P-MFC and D-MFC after the enrichment phase. The anolytes were replaced with fresh medium, including acetate, immediately after the first batch cycle. The figures are presented from the second batch cycle with the starting time set to day 0, and the dotted lines indicate the medium replacement of P-MFC. | ||
The total chemical oxygen demand (COD) was also measured to investigate the removal of organic matter. The results are the average of triplicate measurements (Fig. 4c). For the second batch cycle, the average initial COD of anolyte containing 38 mM acetate was 3800 ± 500 mg L−1, and the COD removal rate of P-MFC was 391.6 mg per L per day, which was twice as fast as that of D-MFC (198.6 mg per L per day). A similar trend was also observed in the third batch cycle (403.9 mg per L per day of P-MFC and 146.7 mg per L per day of D-MFC). A high COD removal rate can be an index of efficient wastewater treatment.35 Based on the results, the P-MFC might be able to produce bioelectricity with a more efficient wastewater treatment than the D-MFC.
The anolyte pH of the D-MFC decreased because of acidification caused by acetate oxidation in the anode chamber (Fig. 4d). The electroactive bacteria decompose organic matter to produce protons (H+) and electrons (e−); the accumulated protons lower the pH in the anode chamber. In contrast, in the P-MFC, the anolyte pH increased gradually, reaching 7.8 at the end of the third cycle, indicating that the protons produced were appropriately disposed of to produce H2 or other by-products by photosynthetic bacteria. A small amount of H2 was detected in the headspace of the P-MFC in the initial stage then disappeared (data not shown). These results suggest that H2 was used to assimilate CO2 within the light-driven P-MFC.
Lai et al.13 reported a similar increase in pH with the pure strain of Rhodopseudomonas palustris G11, which was isolated from an activated sludge under light conditions. The increased pH is caused by the accumulation of polyphosphate and poly-β-hydroxybutyrate (PHB), which consume protons. Such bioproducts act as energy storage materials in MFCs, which can produce electricity when external carbon sources are insufficient.13 Similarly, the voltage of the P-MFC did not decrease drastically below 200 mV even when acetate was depleted. At the end of each cycle, a slight increase in COD was detected, probably because of the release of photosynthetic by-products.
Fig. 5 shows the accumulated biogas and CO2 in the anode chamber from the second batch cycle. The D-MFC gradually produced 115.2 mL of biogas (with 71 mL of CO2) on day 14. In contrast, the P-MFC produced only 27 mL of biogas (with 20.4 mL of CO2) on day 1, which decreased to 9 mL at the end of the second batch cycle (day 4). In the third batch cycle, P-MFC produced 11 mL of biogas (8.1 mL of CO2) one day after changing the medium. On the other hand, the biogas produced decreased to a negligible amount on day 9, even though a higher voltage (>600 mV) was maintained. Throughout the operation, CO2 was present at less than 3% in the anode chamber of the P-MFC. These results suggest that the photosynthetic electroactive microbial community of the P-MFC could reuptake CO2 produced from organic degradation with simultaneous electricity generation.
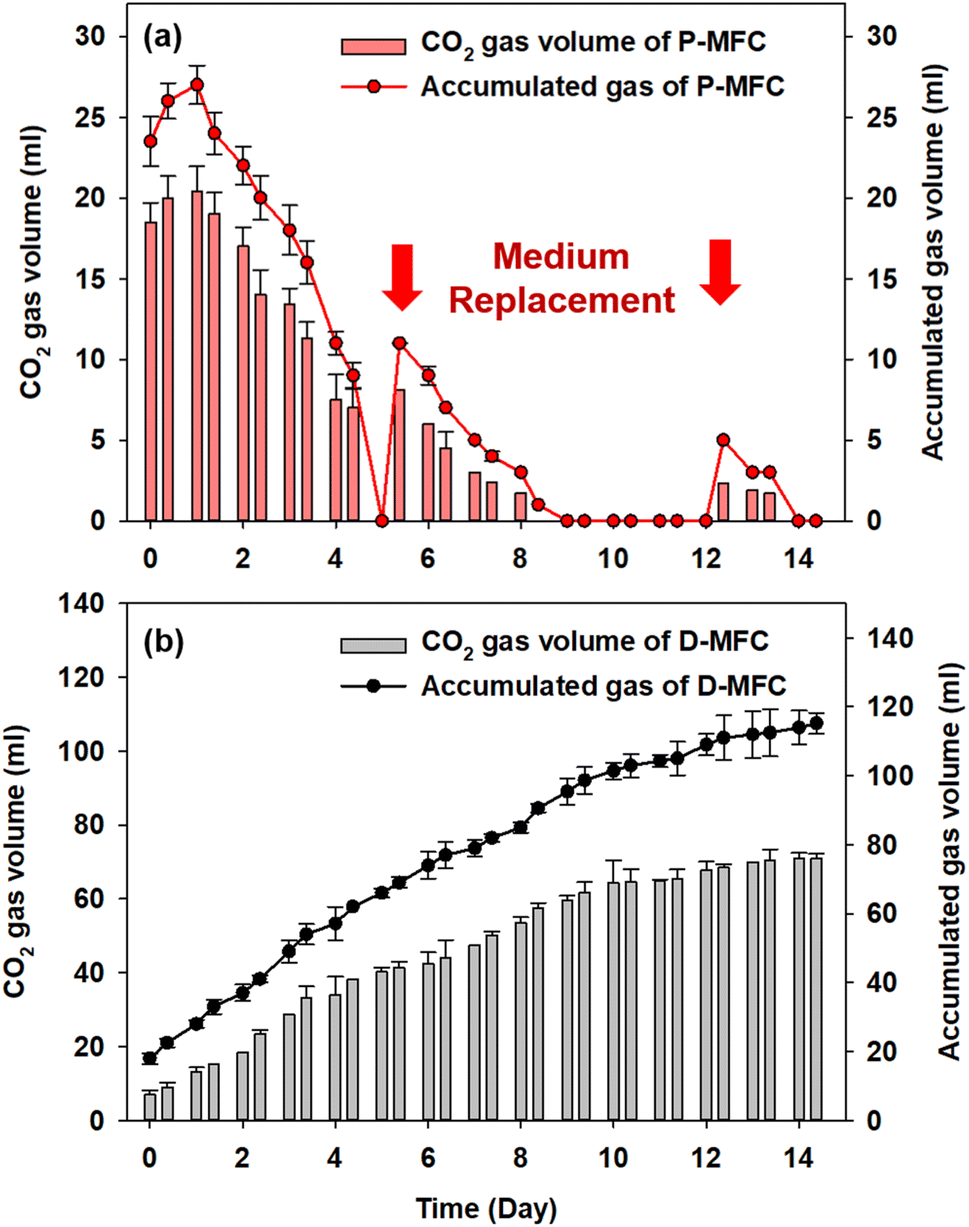 | ||
| Fig. 5 (a) Accumulated biogas and CO2 gas volume in the anode chamber after the enrichment phase of P-MFC, and (b) of D-MFC from the second batch cycle with the starting time set to day 0. The red arrows indicate the medium replacement of the P-MFC. | ||
3.3 Biofilm development on the anode surface and electrochemical characteristics
Electroactive bacteria (EAB) transfer electrons to the electrode through direct electron transfer (DET) and interspecies electron transfer (IET).36 The biofilm morphologies of P- and D-MFC were examined by FE-SEM (Fig. 6). The biofilm of D-MFC was denser than that of the P-MFC and covered the surface evenly (Fig. 6b), whereas a more aggregated and layered biofilm developed in the P-MFC (Fig. 6c–f). Hemdan et al. observed a similar biofilm morphology by FE-SEM. Such an aggregated biofilm could produce abundant electrons by decomposing organic matter.33 The nanowire-like structure was also observed between cells in the P-MFC (Fig. 6c and S3†). Nanowires are electrically conductive pili that facilitate long-distance extracellular electron transfer.37 Exoelectrogens (e.g., Shewanella, Geobacter, and Rhodopseudomonas) produce nanowires during biofilm formation that extend towards the electrode surface.38–40 In the present analysis, nanowire-like morphologies were found between the cells rather than between the cell and anode. Therefore, the P-MFC in a photosynthetic environment might promote the dominance of such exoelectrogens, which transfer electrons via interspecies electron transfer (IET). Nevertheless, the function of such a morphology requires further investigation. Although not examined in the present study, indirect electron transfer through an electrochemically active shuttle might also help facilitate respiration between suspended bacterial species and electrode surface in the present P-MFC.41,42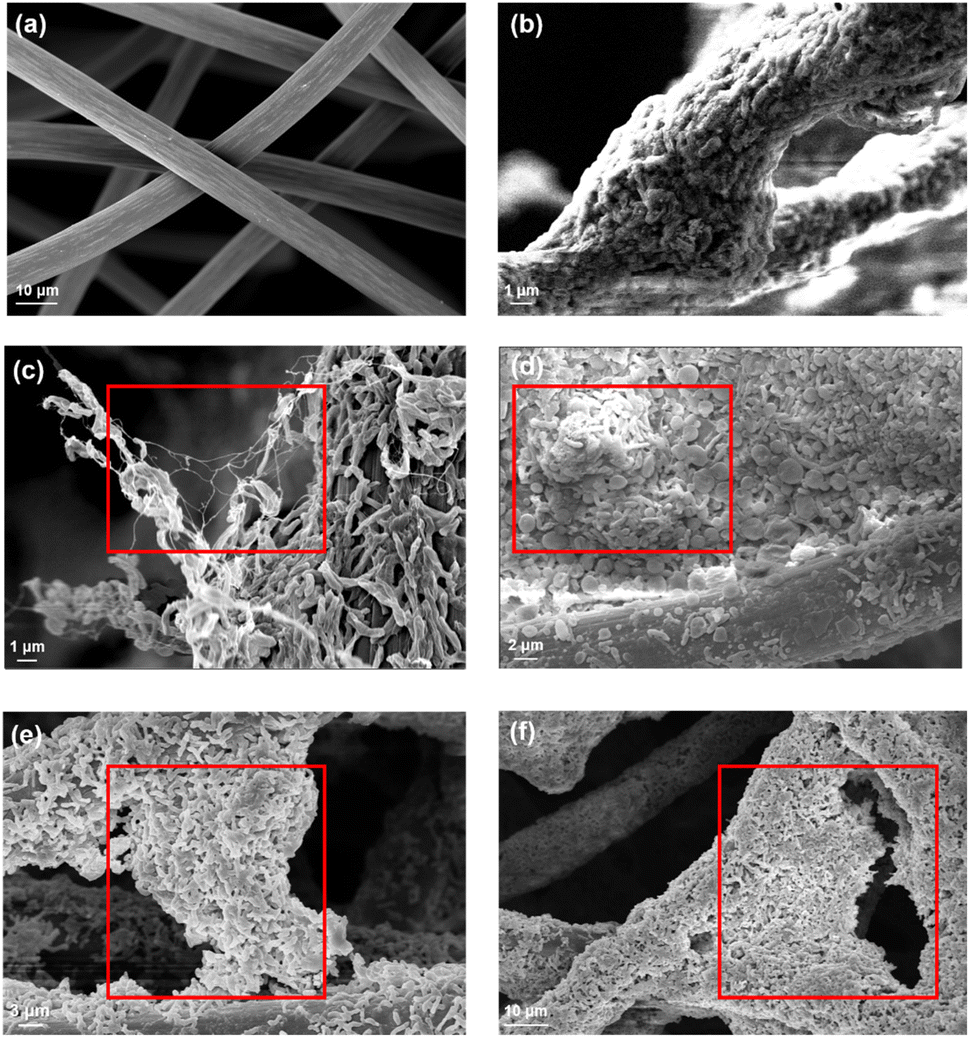 | ||
| Fig. 6 FE-SEM images of (a) bare graphite felt fiber, and (b) anode-attached cell of D-MFC, and (c–f) P-MFC after the enrichment phase (on day 14). The red box indicates a more aggregated form between cell-to-cell rather than cell-to-anode in the P-MFC. | ||
For CV analyses, the P- and D-MFC exhibited clear oxidation peaks of −0.2 V (P-MFC) and −0.12 V (D-MFC) (vs. Ag/AgCl), respectively, with sufficient acetate (38 mM) (Fig. 7a). When acetate was depleted, there was no shift in the oxidation peaks of the P- and D-MFC but a significantly lower peak current than those with sufficient acetate. Hence, the biofilm formed with acetate shows high redox activity and excellent electron transfer to the anode in the P- and D-MFCs.43Fig. 7b compares the power density and polarization curves of the P- and D-MFCs. The maximum power density of the P-MFC was 836 mW m−2, which was higher than that of the D-MFC (592 mW m−2).
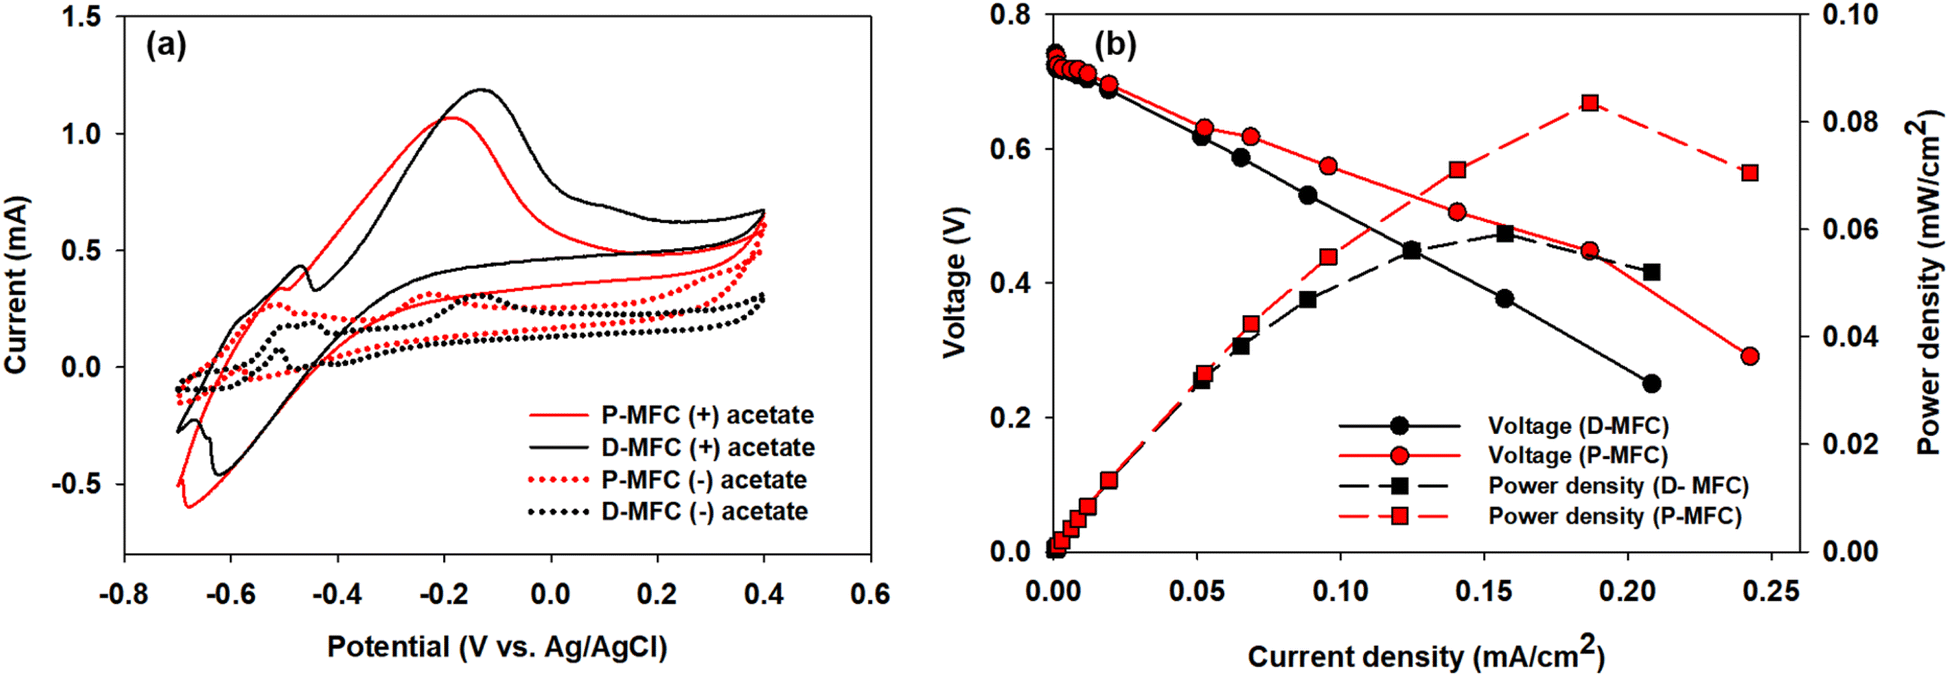 | ||
| Fig. 7 (a) Cyclic voltammetry (CV) analysis after the biofilm developed on the anode with 38 mM acetate (referred to as (+) acetate) and after depletion of acetate (referred to as (−) acetate), and (b) polarization and power density curves as a function of the current density of the P-MFC and D-MFC. | ||
4. Conclusions
P-MFC under light conditions (P-MFC) and MFC in dark conditions (D-MFC) were compared. During the enrichment phase, Rhodopseudomonas became dominant in the anode of the P-MFC, and the color of the anode and anolyte changed to red, unlike the D-MFC. After enrichment, the bioelectricity production and COD removal rate of the P-MFC were two times faster than the D-MFC. The P-MFC achieved a maximum power density of 836 mW m−2, which was 1.4 times that of the D-MFC. The P-MFC has a significantly aggregated biofilm compared to the D-MFC. The amount of biogas, including CO2, of the P-MFC was much lower than that of the D-MFC and decreased while producing bioelectricity along with the operation. This study first explored mixotrophic and photosynthetic MFCs using sludge as an inoculum to develop a reddish bacterial community in the anode chamber. Such photosynthetic bacterial community consumes the CO2 produced from organic matter degradation in the MFC. This result contributes to the development of a carbon-negative MFC process to mitigate greenhouse gas emissions with simultaneous bioelectricity production.Author contributions
Won Gyeong Park: the investigation, experiment, and writing the original draft. Minsoo Kim: conceptualization and electrochemical analysis. Shuwei Li, Eunseo Kim, Eun Joo Park and Jiin Yoo: analyses and validation. Nagesh Maile, Jungho Jae, Hyoung-il Kim: validation and draft review. Jung Rae Kim: conceptualization, supervision, writing, reviewing, editing, and funding.Conflicts of interest
There are no conflicts to declare.Acknowledgements
This study was supported by the Mid-Career Researcher Program (NRF-2021R1A2C2007841) and the Basic Research Laboratory Program (BRL) (NRF-2022R1A4A1021692) by the Korean National Research Foundation funded by the Korean Ministry of Science, ICT and Future Planning. This work was partly supported by the Korea Institute of Energy Technology Evaluation and Planning (KETEP) grant funded by the Korean government (MOTIE) (20214000000140, Graduate School of Convergence for Clean Energy Integrated Power Generation).References
- R. H. Mahmoud, O. M. Gomaa and R. Y. Hassan, RSC Adv., 2022, 12, 5749–5764 RSC.
- J. Wang, K. Ren, Y. Zhu, J. Huang and S. Liu, Biotechnology, 2022, 11, 44 CrossRef CAS PubMed.
- K. S. Aiyer, World J. Microbiol. Biotechnol., 2020, 36, 19 CrossRef PubMed.
- C.-D. Dubé and S. R. Guiot, Biogas Science and Technology, 2015, pp. 101–115 Search PubMed.
- T. A. Kurniawan, M. H. D. Othman, X. Liang, M. Ayub, H. H. Goh, T. D. Kusworo, A. Mohyuddin and K. W. Chew, Sustainability, 2022, 14, 16847 CrossRef CAS.
- C. Chao, Y. Deng, R. Dewil, J. Baeyens and X. Fan, Renewable Sustainable Energy Rev., 2021, 138, 110490 CrossRef CAS.
- S. Arun, A. Sinharoy, K. Pakshirajan and P. N. Lens, Renewable Sustainable Energy Rev., 2020, 132, 110041 CrossRef CAS.
- M. J. Khan, N. Singh, S. Mishra, A. Ahirwar, F. Bast, S. Varjani, B. Schoefs, J. Marchand, K. Rajendran and J. R. Banu, Chemosphere, 2022, 288, 132589 CrossRef CAS PubMed.
- M. J. Khan, V. J. Suryavanshi, K. B. Joshi, P. Gangadharan and V. Vinayak, in Handbook of Algal Biofuels, Elsevier, 2022, pp. 363–384 Search PubMed.
- S. Nanda, S. N. Reddy, S. K. Mitra and J. A. Kozinski, Energy Sci. Eng., 2016, 4, 99–122 CrossRef CAS.
- P. Yaashikaa, A. Saravanan, P. S. Kumar, P. Thamarai and G. Rangasamy, Int. J. Hydrogen Energy, 2024, 52, 799–820 CrossRef CAS.
- X. Qi, Y. Ren, P. Liang and X. Wang, Bioresour. Technol., 2018, 258, 310–317 CrossRef CAS PubMed.
- Y.-C. Lai, C.-M. Liang, S.-C. Hsu, P.-H. Hsieh and C.-H. Hung, J. Biosci. Bioeng., 2017, 123, 722–730 CrossRef CAS PubMed.
- C.-C. Lin, C.-H. Wei, C.-I. Chen, C.-J. Shieh and Y.-C. Liu, Bioresour. Technol., 2013, 135, 640–643 CrossRef CAS PubMed.
- C. Xu, K. Poon, M. M. Choi and R. Wang, Environ. Sci. Pollut. Res., 2015, 22, 15621–15635 CrossRef CAS PubMed.
- L. Xiao and Z. He, Renewable Sustainable Energy Rev., 2014, 37, 550–559 CrossRef CAS.
- E. Marsili, D. B. Baron, I. D. Shikhare, D. Coursolle, J. A. Gralnick and D. R. Bond, Proc. Natl. Acad. Sci. U. S. A., 2008, 105, 3968–3973 CrossRef CAS PubMed.
- R. B. Song, C. e. Zhao, P. P. Gai, D. Guo, L. P. Jiang, Q. Zhang, J. R. Zhang and J. J. Zhu, Chem.–Asian J., 2017, 12, 308–313 CrossRef CAS PubMed.
- M. Kim, S. Li, Y. E. Song, D.-Y. Lee and J. R. Kim, Chem. Eng. J., 2022, 446, 137079 CrossRef CAS.
- S. V. Mohan, S. V. Raghavulu, S. Srikanth and P. Sarma, Curr. Sci., 2007, 1720–1726 CAS.
- A. ElMekawy, H. M. Hegab, K. Vanbroekhoven and D. Pant, Renewable Sustainable Energy Rev., 2014, 39, 617–627 CrossRef CAS.
- T. H. Trinh, Y. Uemura and N. T. Tran, J. Jpn. Inst. Energy, 2019, 98, 242–245 CrossRef CAS.
- H. K. Lichtenthaler and C. Buschmann, Curr. Protoc. Food Anal. Chem., 2001, 1, F4.3.1–F4.3.8 Search PubMed.
- Q. Zhou, P. Zhang and G. Zhang, Bioresour. Technol., 2015, 179, 505–509 CrossRef CAS PubMed.
- D. Xing, Y. Zuo, S. Cheng, J. M. Regan and B. E. Logan, Environ. Sci. Technol., 2008, 42, 4146–4151 CrossRef CAS PubMed.
- K. Venkidusamy and M. Megharaj, Front. Microbiol., 2016, 7, 1071 Search PubMed.
- Y.-R. Wang, K.-W. Li, Y.-X. Wang, X.-L. Liu and Y. Mu, Environ. Res., 2022, 212, 113408 CrossRef CAS PubMed.
- N. Xiao, R. Wu, J. J. Huang and P. R. Selvaganapathy, Chem. Eng. Sci., 2020, 221, 115691 CrossRef CAS.
- K. Watanabe, M. Miyahara, T. Shimoyama and K. Hashimoto, Appl. Microbiol. Biotechnol., 2011, 92, 1307–1314 CrossRef CAS PubMed.
- X. Quan, H. Xu, B. Sun and Z. Xiao, Int. Biodeterior. Biodegrad., 2018, 132, 94–101 CrossRef CAS.
- Y. Qiao, Y.-J. Qiao, L. Zou, C.-X. Ma and J.-H. Liu, Bioresour. Technol., 2015, 198, 1–6 CrossRef CAS PubMed.
- H.-B. Shen, X.-Y. Yong, Y.-L. Chen, Z.-H. Liao, R.-W. Si, J. Zhou, S.-Y. Wang, Y.-C. Yong, P.-K. OuYang and T. Zheng, Bioresour. Technol., 2014, 167, 490–494 CrossRef CAS PubMed.
- B. A. Hemdan, G. E. El-Taweel, S. Naha and P. Goswami, Sci. Rep., 2023, 13, 1255 CrossRef CAS PubMed.
- Q. Deng, C. Su, X. Lu, W. Chen, X. Guan, S. Chen and M. Chen, Bioresour. Technol., 2020, 306, 123173 CrossRef CAS PubMed.
- C. Munoz-Cupa, Y. Hu, C. Xu and A. Bassi, Sci. Total Environ., 2021, 754, 142429 CrossRef CAS PubMed.
- M. Li, M. Zhou, X. Tian, C. Tan, C. T. McDaniel, D. J. Hassett and T. Gu, Biotechnol. Adv., 2018, 36, 1316–1327 CrossRef CAS PubMed.
- N. S. Malvankar and D. R. Lovley, Curr. Opin. Biotechnol., 2014, 27, 88–95 CrossRef CAS PubMed.
- R. Kumar, L. Singh, Z. A. Wahid and M. F. M. Din, Int. J. Energy Res., 2015, 39, 1048–1067 CrossRef CAS.
- T.-H. Lan, C.-T. Wang, T. Sangeetha, Y.-C. Yang and A. Garg, J. Power Sources, 2018, 402, 483–488 CrossRef CAS.
- K. Venkidusamy, M. Megharaj, U. Schröder, F. Karouta, S. V. Mohan and R. Naidu, RSC Adv., 2015, 5, 100790–100798 RSC.
- A. L. Popov, J. R. Kim, R. M. Dinsdale, S. R. Esteves, A. J. Guwy and G. C. Premier, Biotechnol. Bioprocess Eng., 2012, 17, 361–370 CrossRef CAS.
- C. H. Im, C. Kim, Y. E. Song, S.-E. Oh, B.-H. Jeon and J. R. Kim, Chemosphere, 2018, 191, 166–173 CrossRef CAS PubMed.
- X. Zhu, M. D. Yates and B. E. Logan, Electrochem. Commun., 2012, 22, 116–119 CrossRef CAS.
- S. S. Mirza, M. M. Al-Ansari, M. Ali, S. Aslam, M. Akmal, L. Al-Humaid and A. Hussain, Environ. Res., 2022, 209, 112781 CrossRef CAS PubMed.
- B. H. Cadirci, Int. J. Hydrogen Energy, 2018, 43, 18001–18006 CrossRef CAS.
- W. Zheng, T. Cai, M. Huang and D. Chen, J. Biosci. Bioeng., 2017, 124, 551–558 CrossRef CAS PubMed.
- M. J. Khan, S. Das, V. Vinayak, D. Pant and M. Ghangrekar, Chemosphere, 2022, 291, 132841 CrossRef CAS PubMed.
- X. Qi, Y. Bo, Y. Ren and X. Wang, Polym. Degrad. Stab., 2018, 148, 42–49 CrossRef CAS.
- B. Taşkan and E. Taşkan, Bioresour. Technol., 2022, 347, 126704 CrossRef PubMed.
- A. Sharma and M. Chhabra, Bioresour. Technol., 2021, 338, 125499 CrossRef CAS PubMed.
- S. N. Mohamed, P. A. Hiraman, K. Muthukumar and T. Jayabalan, Bioresour. Technol., 2020, 295, 122226 CrossRef PubMed.
- E. Bazdar, R. Roshandel, S. Yaghmaei and M. M. Mardanpour, Bioresour. Technol., 2018, 261, 350–360 CrossRef CAS PubMed.
Footnote |
| † Electronic supplementary information (ESI) available. See DOI: https://doi.org/10.1039/d3se01487h |
| This journal is © The Royal Society of Chemistry 2024 |