Hard carbon derived from Physalis alkekengi L. husks as a stable anode for sodium-ion batteries†
Received
8th January 2024
, Accepted 25th March 2024
First published on 25th March 2024
Abstract
Hard carbon is one of the most promising anode materials for sodium-ion batteries (SIBs). Biomass-derived hard carbon is deemed to be a good choice because of its superior material properties, abundance source, and cost advantages. This work used Physalis alkekengi L.'s husks as precursors to prepare a series of hard carbon materials via a pyrolysis method. It was found that the carbonization temperature is closely linked to the lattice characteristics of PLH-derived hard carbon. Higher temperatures promote the degree of graphitization of the lattice, which produces a smaller carbon interlayer spacing. The optimal sample demonstrated a high electrochemical performance and good reaction kinetics. It maintained a capacity of 291.6 mA h g−1 after 100 cycles at 0.1 A g−1 and delivered an average capacity of 61.9 mA h g−1 at a high rate of 2.0 A g−1. Furthermore, a full cell assembled using the optimal sample as an anode and Na3V2(PO4)3 as a cathode gave a high reversible capacity of 161.9 mA h g−1 at 0.1 A g−1 after 100 cycles.
Design, System, Application
Sodium-ion batteries have attracted prominent attention as a promising next-generation energy storage technology. Hard carbon is undoubtedly a contender anode material that is being commercialized, due to its great electrochemical performance and cost effectiveness. Employing biomass as precursors is the most convenient and economic way to synthesize hard carbons, and the intrinsic structures of biomass have a profound effect on designing the structures of hard carbons. In this work, hard carbons are synthesized using Physalis alkekengi L.'s husks, a biomass waste, as the precursor. Pyrolysis temperature is found to be the key to tune the microstructures of hard carbons, which in turn regulates their electrochemical performance. Furthermore, full cells of sodium-ion batteries are designed by using the optimized hard carbon as the anode and a commercially available cathode material.
|
1. Introduction
Lithium-ion batteries (LIBs) have dominated the electrochemical energy storage market since they were commercialized by the SONY Corporation in 1991 because of their high energy densities, long cycle life, and environmental friendliness.1–3 However, the scarcity and uneven distribution of lithium sources threaten the price and supply stability of LIBs.4–6 As a promising alternative to LIBs, sodium-ion batteries (SIBs) have received rapidly increasing attention owing to their similar electrochemical properties to LIBs and the merits of low cost, high safety, and the ability to operate at low temperatures.7–9
Anodes, a crucial component of metal-ion batteries, are vital for battery cell safety and longevity and play a decisive role in the electrochemical kinetics and energy density of SIBs.4,10,11 Currently, there are various materials being employed as SIB anodes, such as alloying materials, metal oxides/chalcogenides/phosphides, carbon materials, and organic compounds.12 Hard carbon (HC) is considered as a promising option for commercial SIBs because of the abundance of precursors, superior electrochemical properties, and low-voltage plateaus.13 Importantly, HC has unparalleled competitiveness in facile large-scale production. Precursors of HC include polymers (e.g., phenolic resins, furfural),14,15 sugars (e.g., glucose, sucrose),16,17 and biomass.18–20 However, the high cost and low yield of the polymers and organic compounds make them insufficiently competitive for producing HC at a large scale. As for biomass, it is a promising candidate for SIBs due to its environmental friendliness, low cost, abundant resources, and high renewability.
Physalis alkekengi L. is planted worldwide, particularly in the tropical and temperate regions of America, as well as in the temperate regions of Europe and Asia.21Physalis alkekengi L.'s husks (PLH), a waste of the process to obtain Physalis alkekengi L. fruits, have two main treatment methods: abandonment and incineration, both of which lead to environmental pollution and resource waste.20,22 This has sparked the idea of how PLH can be fully taken advantage of as a biomass carbon resource.
Herein, this study employed PLH as a precursor to prepare HCs that were annealed at different temperatures and investigated their electrochemical Na+ storage capability, noting that the pore structures could prevent the large volume changes during Na+ insertion/extraction. Demonstrated in SIB half-cells, the optimal carbon material delivered a high reversible capacity of 291.6 mA h g−1 at 0.1 A g−1 over 100 cycles and a good rate performance of 91.3 and 61.9 mA h g−1 at 1.0 and 2.0 A g−1, respectively. To explore their commercialization possibilities, a full cell was constructed using the optimal sample as the anode and Na3V2(PO4)3 (NVP) as the cathode. The energy density reached 121.60 W h kg−1 (based on the total weight of the active content in the anode and cathode). This work may provide a possible route to utilize PLH and a promising SIB anode material with high Na storage capability.
2. Experimental section
2.1 Material preparation
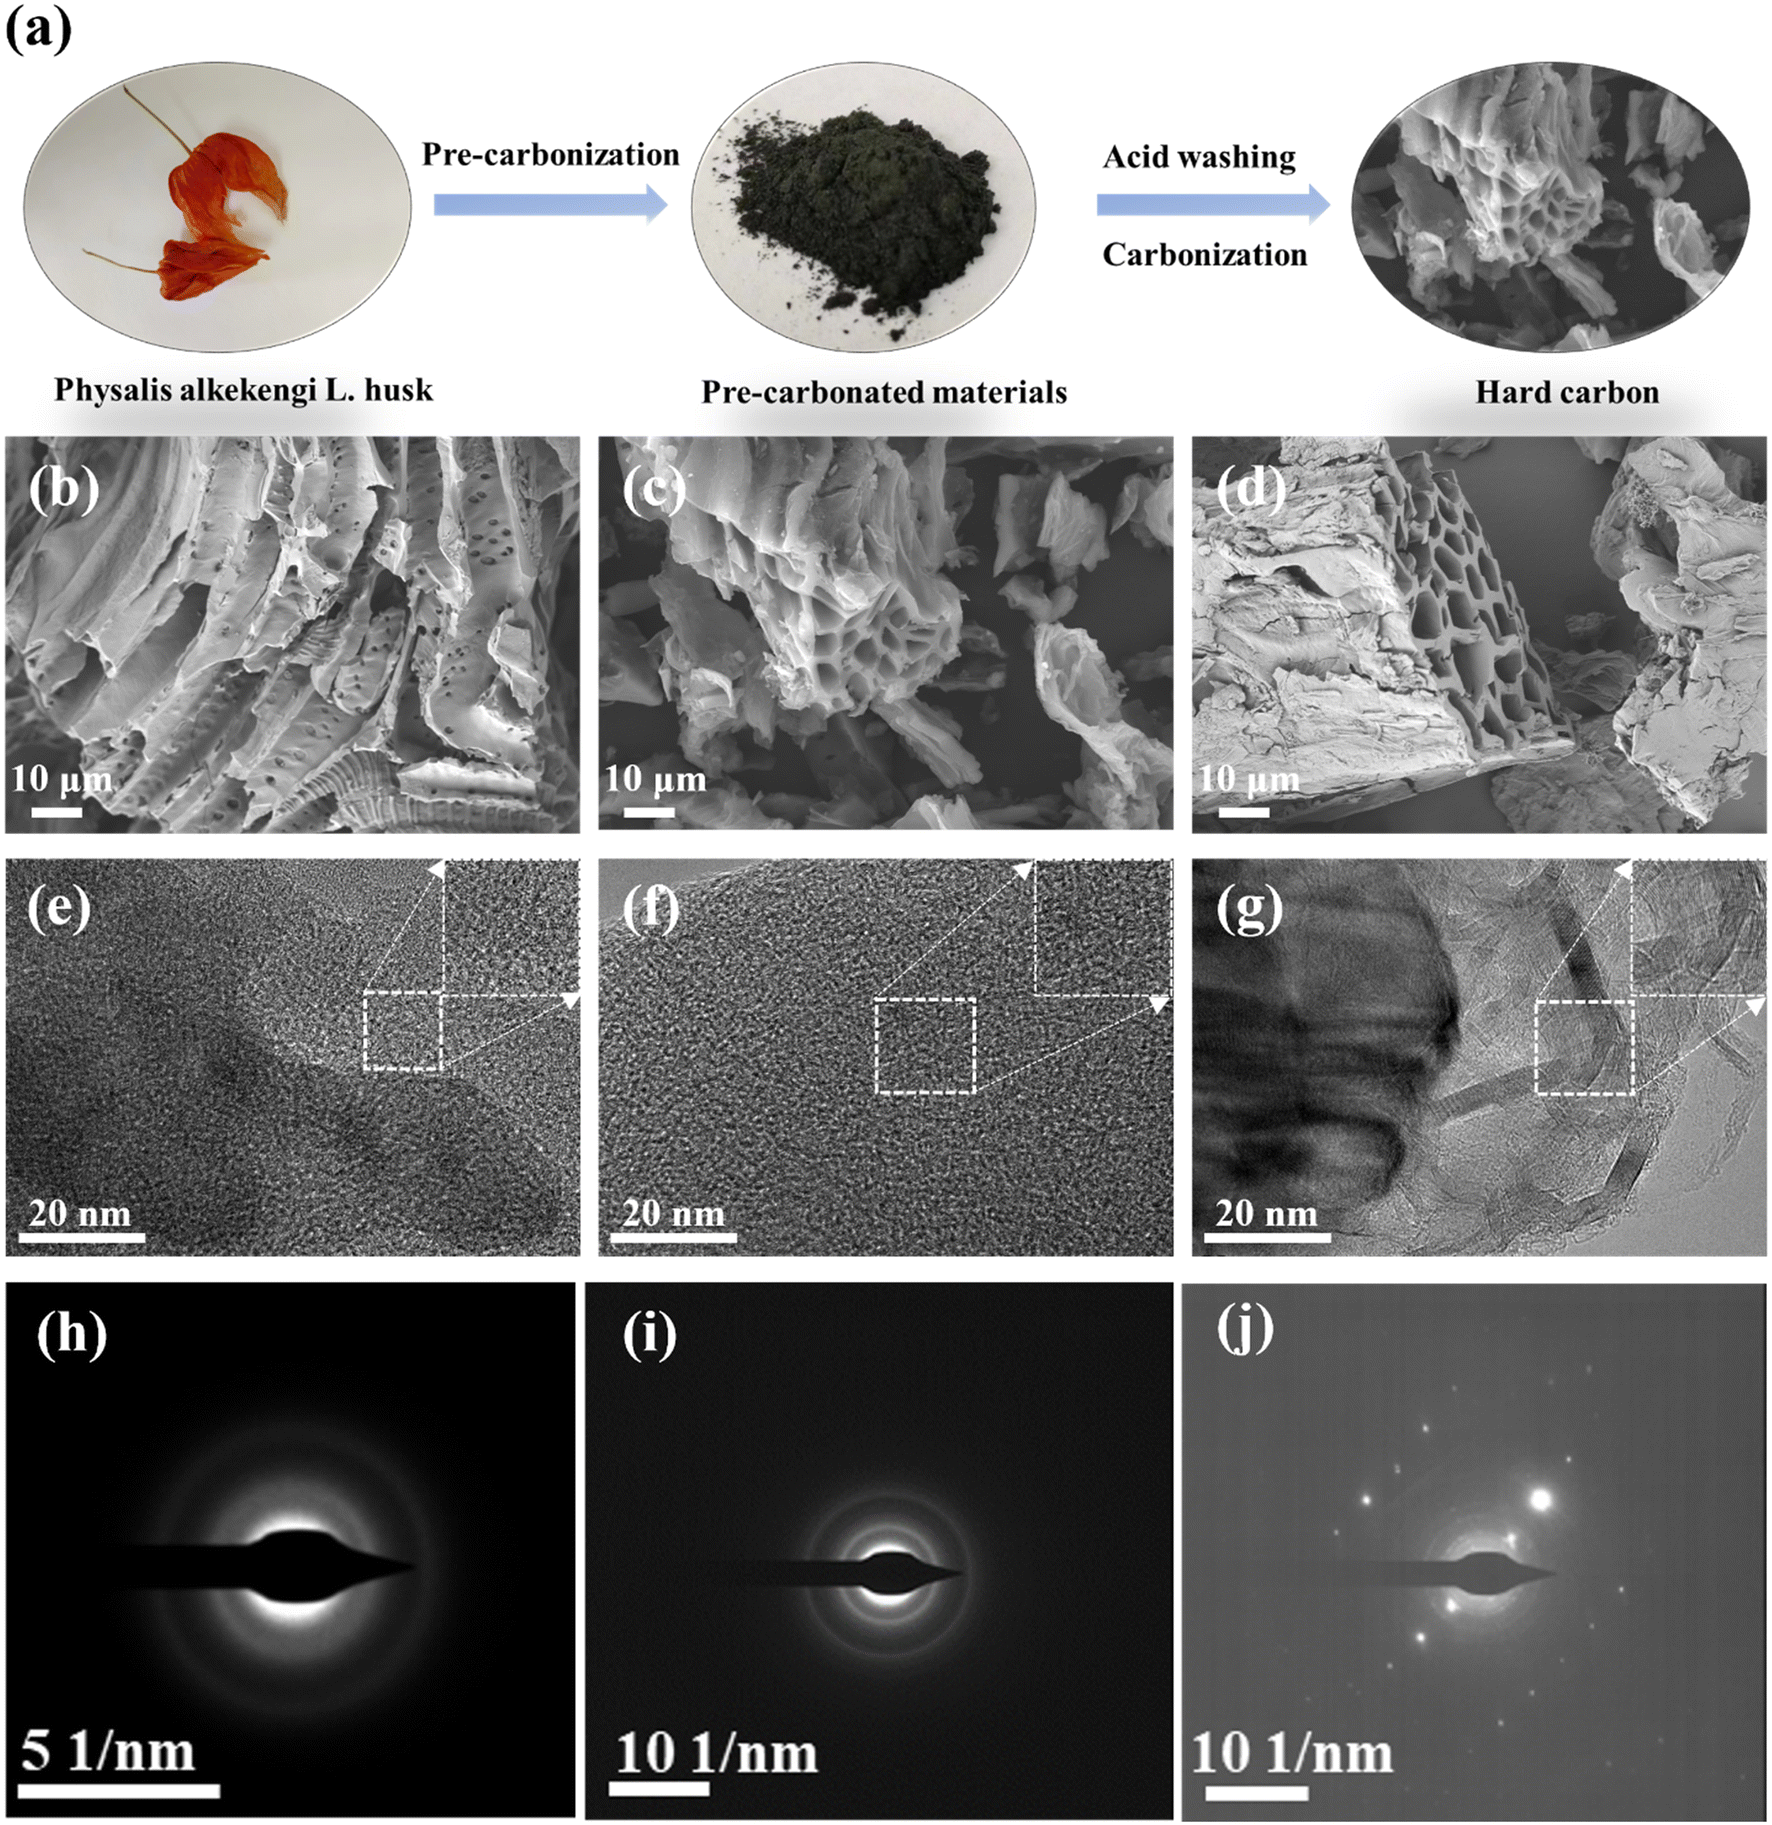
PLH was collected from a market in Liaoning province. The raw materials were washed with deionized water (sonicated at 80 Hz for 1 h) and dried under vacuum at 105 °C for 10 h. Afterwards, they were pulverized and sieved. The obtained powders were used to prepare HCs via a three-stage process: pre-carbonization, acid leaching, and carbonization (as shown in Fig. 1a). First, the powders were annealed in a tube furnace at 400 °C for 2 h in an argon atmosphere. Then, the pre-carbonated materials were stirred in 2 mol L−1 HCl for 6 h to remove impurity elements. Finally, the above materials were annealed at three different temperatures (1000, 1200, and 1400 °C) for 2 h in an argon atmosphere, and they were named as S-1000, S-1200, and S-1400, respectively.
 |
| | Fig. 1 (a) Schematic of the preparation of PLH-derived HCs; morphologies of S-X samples: SEM images of (b) S-1000, (c) S-1200, and (d) S-1400; HRTEM images of (e) S-1000, (f) S-1200, and (g) S-1400; SAED patterns of (h) S-1000, (i) S-1200, and (j) S-1400. | |
2.2 Material characterization
X-ray diffraction (XRD, Shimadzu X-ray 7000 with Cu Kα radiation, λ = 1.54056 Å) and Raman spectroscopy with an excitation wavelength of 532 nm (HORIBA Horiba LabRAM HR Evolution) were used to characterize the structural properties of the samples. Scanning electron microscopy (SEM, Carl Zeiss Jena GeminiSEM300) and high-resolution transmission electron microscopy (HRTEM, FEI Tecnai F20) were employed to observe the morphologies of the samples. Specific surface areas were calculated by the Brunauer–Emmett–Teller method (BET, JWGB INSTRUMENTS TB220A) and the Barrett–Joyner–Halenda (BJH) pore size distribution from the desorption isotherms.
2.3 Electrochemical measurements
The prepared samples were mixed with sodium alginate and acetylene black (8![[thin space (1/6-em)]](https://www.rsc.org/images/entities/char_2009.gif) :1:1 by mass) to form a uniform slurry. The obtained slurry was coated on copper foil (a mass loading of 1–2 mg cm−2), and then the electrode film was dried under vacuum for 12 h and cut into 12 mm-diameter circular electrodes. The electrochemical performance of CR2032 coin cells was evaluated, where sodium foil was used as a counter electrode, a Whatman glass microfiber filter (Grade GF/B) was used as a separator, and 1 mol L−1 NaClO4 ethylene carbonate/diethyl carbonate (EC/DEC) (1:1 in volume ratio) was used as an electrolyte. As for full cells, Na3V2(PO4)3 (NVP) was used as a cathode material. S-1200 and NVP were activated in half cells before assembly (the S-1200 half cell was stopped at the charged state, i.e., no pre-sodiation in S-1200); the weight ratio of NVP/S-1200 was 3:1, corresponding to a capacity ratio of 1.12. Galvanostatic charge–discharge was performed on a LANHE CT2001A battery testing system at different current densities between 0.01 and 2.5 V. Cyclic voltammetry (CV) and electrochemical impedance spectroscopy (EIS) measurements were carried out using an electrochemical workstation (DH7002A).
:1:1 by mass) to form a uniform slurry. The obtained slurry was coated on copper foil (a mass loading of 1–2 mg cm−2), and then the electrode film was dried under vacuum for 12 h and cut into 12 mm-diameter circular electrodes. The electrochemical performance of CR2032 coin cells was evaluated, where sodium foil was used as a counter electrode, a Whatman glass microfiber filter (Grade GF/B) was used as a separator, and 1 mol L−1 NaClO4 ethylene carbonate/diethyl carbonate (EC/DEC) (1:1 in volume ratio) was used as an electrolyte. As for full cells, Na3V2(PO4)3 (NVP) was used as a cathode material. S-1200 and NVP were activated in half cells before assembly (the S-1200 half cell was stopped at the charged state, i.e., no pre-sodiation in S-1200); the weight ratio of NVP/S-1200 was 3:1, corresponding to a capacity ratio of 1.12. Galvanostatic charge–discharge was performed on a LANHE CT2001A battery testing system at different current densities between 0.01 and 2.5 V. Cyclic voltammetry (CV) and electrochemical impedance spectroscopy (EIS) measurements were carried out using an electrochemical workstation (DH7002A).
3. Results and discussion
3.1 Structural characterization
The morphology information of the PLH-derived HCs was collected by the SEM measurement. After acid washing and high-temperature pyrolysis of PLH (the morphology of PLH is shown in Fig. S1†), the obtained S-X samples presented porous structures (Fig. 1b–d), which were recognized in the literature for improving electrolyte penetration and Na+ storage.23 PLH-derived HCs have distinct porous structures that are favorable for depositing sodium uniformly and inhibiting sodium dendrite, and meanwhile, abundant active sites can be exposed for Na+ storage.24 HRTEM was used to further reveal the structural characteristics of the S-X samples (Fig. 1e–g). The PLH-derived HCs that were carbonized below 1400 °C have typical short-range ordered crystal microstructures, and when the carbonization temperature rose to 1400 °C, the material exhibits graphitic domains clearly. Selected area electron diffraction (Fig. 1h–j) confirms the effect of the temperature on the microstructures. As the pyrolysis temperature increases, the ring diffraction pattern becomes less diffusive, and a clear diffraction pattern can be observed in the image of S-1400, illustrating a higher degree of graphitization.25
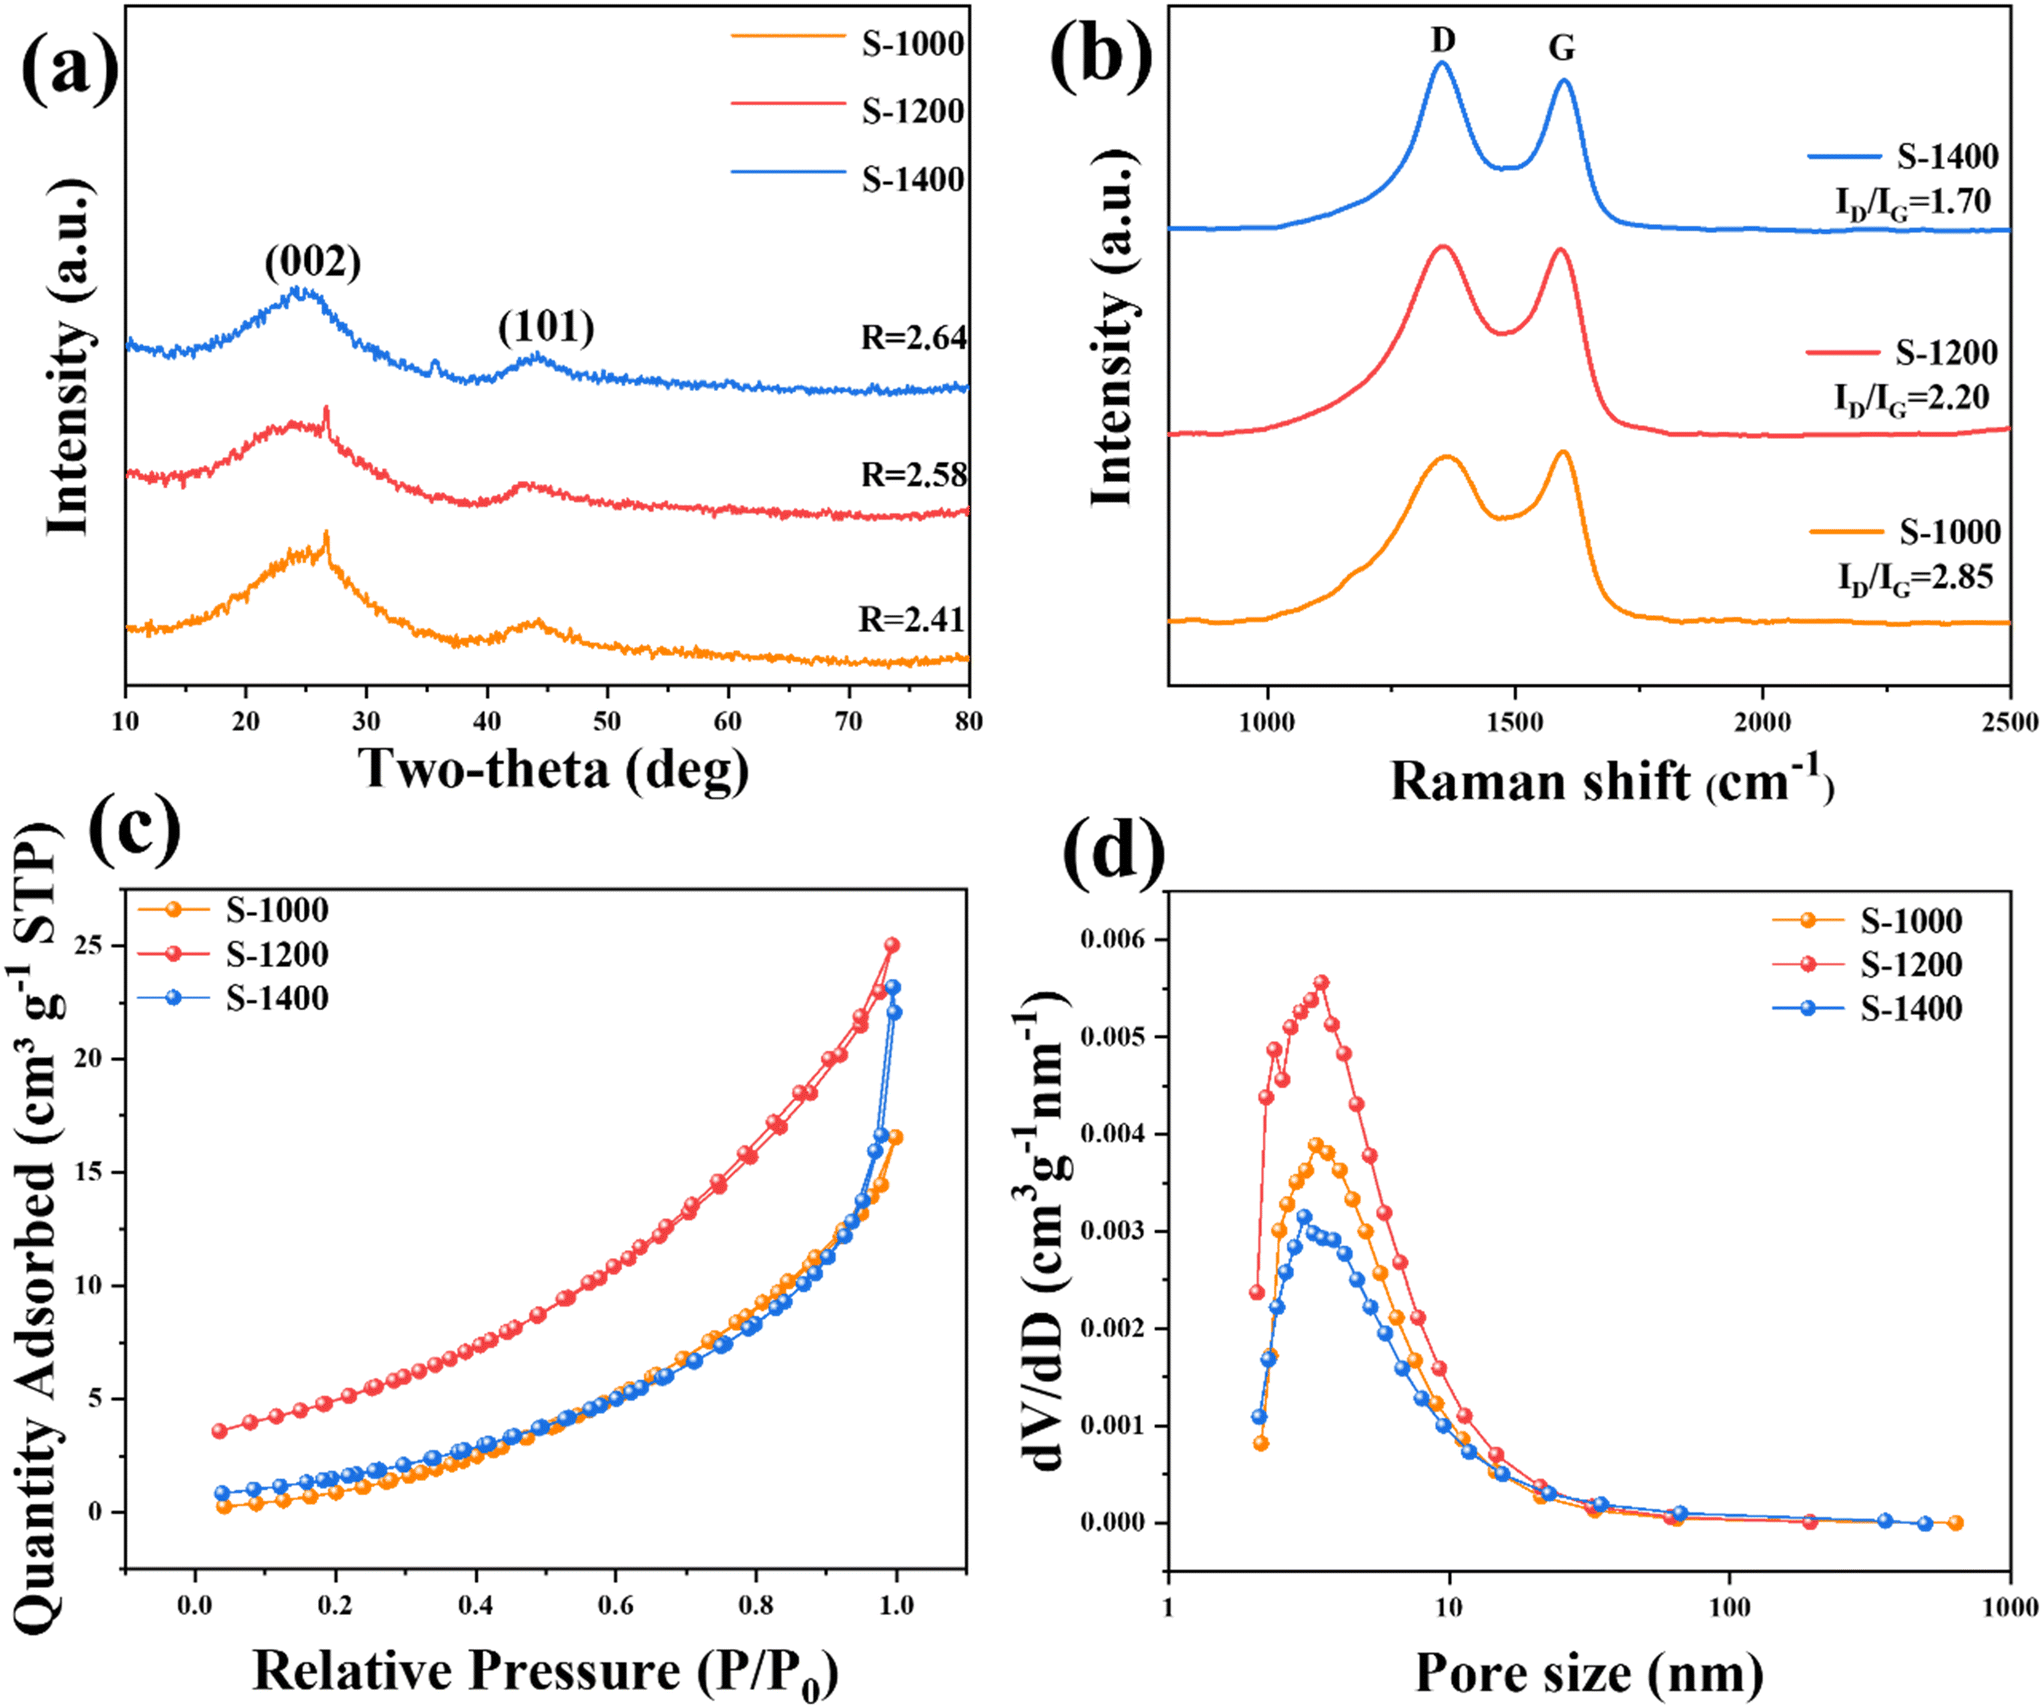
The strong structure, composed of hemicellulose, cellulose, and lignin found within biomass, possesses tightly linked chemical covalent bonds which give rise to nanopores and graphene layers when exposed to high temperatures (1000–3000 °C).24 The crystallographic information of the S-X samples was measured by XRD (Fig. 2a). Two broad diffraction peaks appear at around 23.5° and 43°, corresponding to the diffractions of the (002) and (100) phases of amorphous carbon, respectively; they show that the S-X samples are non-graphitized, which is consistent with the results of HRTEM. As the pyrolysis temperature increases, the (002) diffraction peak shifts to a higher angle, and the R-value gradually increases, indicating that the high temperature enhances the graphitization process and reduces the interlayer distance.25,26 The d value of the (002) plane is a crucial factor in carbon anodes, especially for SIBs that store large-sized Na+ (1.02 Å). According to the Bragg equation, the calculated interlayer spacings of S-1000, S-1200, and S-1400 are 3.67, 3.62, and 3.58 Å, respectively (Table S1†), which are favorable for Na+ insertion/extraction. Additionally, some tiny peaks can be observed. S-1000 and S-1200 have an impurity peak of SiO2 at 26.33°, and a peak of SiC appears in the S-1400 sample. This indicates that the precursor contains SiO2 impurities, which react with the carbon material to produce SiC impurities at 1400 °C.27 Furthermore, the degree of graphitization of the S-X samples was determined by Raman spectroscopy (Fig. 2b). Two obvious peaks centered at 1367 and 1597 cm−1 represent the disorder-induced D-band and in-plane vibrational G-band, respectively.18,22 Table S1† summarizes the degree of disorder and the structural defects of PLH-derived HCs using the intensity ratio of the D-band over the G-band (ID/IG). The ID/IG values of S-1000, S-1200, and S-1400 are 2.38, 2.20, and 1.70, respectively. As the temperature increases, the ID/IG value decreases gradually, suggesting that the graphitization of the lattice increases.
 |
| | Fig. 2 Lattice characteristics and pore distribution of the S-X samples: (a) XRD patterns; (b) Raman spectra with ID/IG ratios; (c) nitrogen adsorption–desorption profiles; (d) the pore size distribution. | |
The surface area and pore structures of the S-X samples were analyzed by the BET N2 adsorption method. All the S-X samples exhibit type III isotherms with type H3 hysteresis loops, showing a mesoporous/microporous structure (Fig. 2c and d). According to type III isotherms, the materials only exhibit limited N2 adsorption. The absence of adsorption saturation in the pressure region indicates an irregular pore structure.18,19 BET specific surface areas of PLH-derived HC are 18.80, 20.17, and 9.91 m2 g−1 at pyrolysis temperatures of 1000, 1200, and 1400 °C, respectively (Table S1†). It is worth noting that, as will be shown later, the performance obtained is not due to a high surface area of HCs, which highlights the suitability of the chosen biomass as the precursor for producing HC. The porous structure reduces ion diffusion distances, thus improving the rapid transportation of Na+. Significantly, the specific surface area of S-1400 decreases owing to pore shrinkage and well-crystallized lattice, caused by high pyrolysis temperatures.19
3.2 Electrochemical investigation
The Na+ storage behavior of the electrodes was evaluated by CV with a voltage window of 0.01–2.5 V. As shown in Fig. 3a, a peak centered at ∼0.52 V appears in the initial cycle and disappears in the subsequent cycles, possibly attributing to electrolyte decomposition and the subsequent formation of a solid-electrolyte interface (SEI).28,29 A slight loss of capacity over the initial cycle can be observed in the 2nd CV curve, which indicates a relatively high initial coulombic efficiency (ICE). Furthermore, the good overlap between the CV curves of the 2nd and 3rd cycles suggests good cyclability of the S-X samples. The CV curves of S-1200, S-1000, and S-1400 (Fig. S2†) show a pair of obvious redox peaks at 0.012/0.0125 V, which may be the insertion/extraction process of Na+ between the layers of the graphitic regions, corresponding to the low voltage plateau in the charge–discharge profiles.25,30 The redox peak of S-1200 is more evident than the other two samples, indicating that the carbonization temperature of 1200 °C can achieve a balance between the porous structure and the level of graphitization. Typical galvanostatic charge–discharge curves of S-1200 and the other two samples have voltage plateaus corresponding to the CV curve peak position (Fig. 3b and S3†). The galvanostatic charge–discharge curves of the S-X samples consist of a slope region (0.12–2.5 V) and a plateau region (0.01–0.12 V), which represent the adsorption/desorption of Na+ on the material surface and the insertion/extraction of Na+ in graphitic regions, respectively.18 The S-1200 electrode demonstrates a higher capacity than the others in both the slope and plateau regions (Fig. 3c); it shows diffusion-controlled Na+ storage behavior in the plateau region, which is confirmed in the electrochemical tests presented in Fig. 4. For the samples at carbonization temperatures of 1000 and 1200 °C, their ICEs are 53.5% and 76.4%, respectively, and the electrolyte decomposition and the generation of the SEI could be the main causes of the capacity reduction in the initial cycles.31–33 When the temperature increased to 1400 °C, the ICE of the sample decreased to 64.7%. It may be that the interlayer spacing was narrowed to a large extent and thus not sufficient for Na+ insertion/extraction.19 Despite the high capacity of S-1200, its ICE is not ideal if being used directly in a full cell. The ICE of hard carbon anodes is crucial for SIB full cells. A low ICE of the anode will consume Na ions from the cathode, meaning that a portion of the cathode will not participate in the electrochemical reaction in the full cell, thus resulting in a low capacity and energy density.34 Potential methods to improve the ICE of the anode include pre-treatment in a half cell, electrolyte optimization, and surface engineering.35 Pre-treatment in a half cell can form a stable SEI on the anode and reduce the Na ion consumption in the full cell. Electrolyte optimization and surface engineering of the anode can directly regulate the formation of the SEI and its components.36 Compared to pre-treatment in a half cell, the two methods are less straightforward but more thorough and effective, as well as more suitable from a commercial perspective as a pre-treatment step would not be preferred for large-scale production.
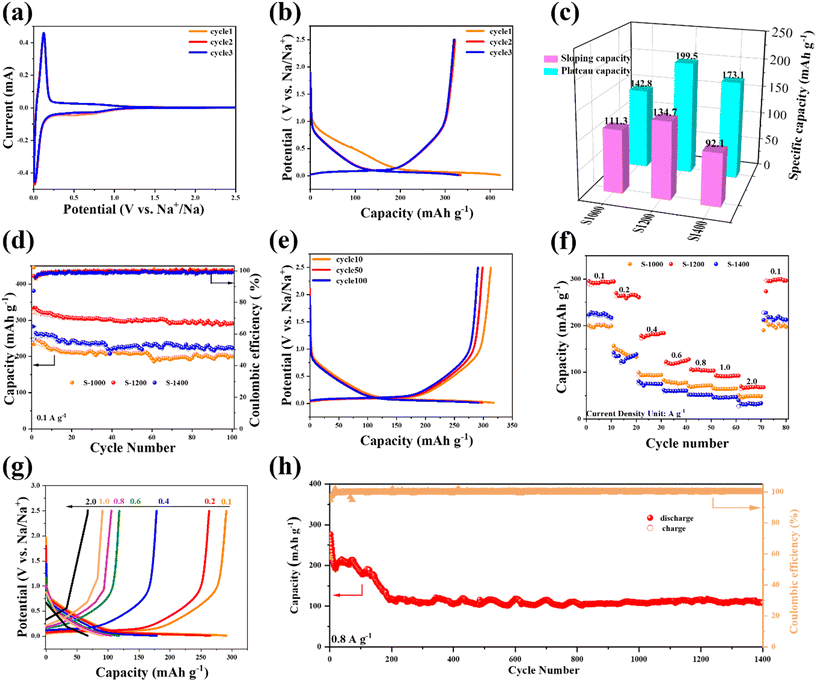 |
| | Fig. 3 Electrochemical performance of the S-X samples: (a) the initial three CV curves of S-1200; (b) the initial three charge–discharge profiles of S-1200 at a current density of 100 mA g−1; (c) the comparison of slope and plateau capacities during the second discharge process; (d) the cycling performance at 100 mA g−1; (e) the charge–discharge profiles at a current density of 100 mA g−1; (f) the comparison of rate performance; (g) the charge–discharge profiles at various current densities; (h) the cycling performance at a high current density of 0.8 A g−1. | |
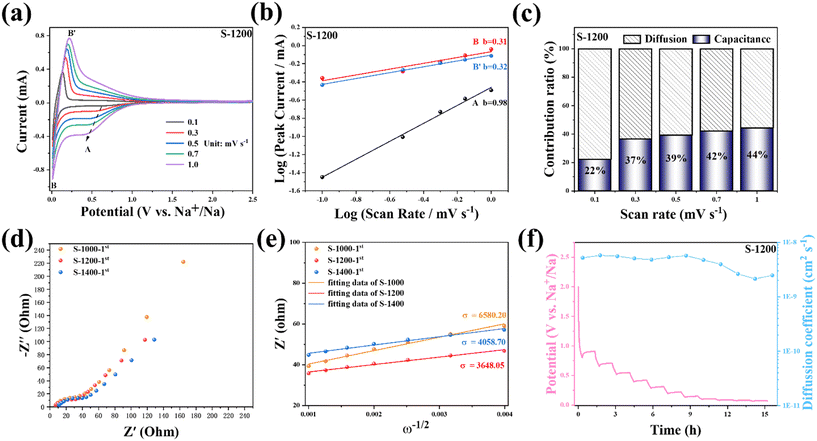 |
| | Fig. 4 Kinetic characterization of S-1200: (a) CV curves at various scan rates ranging from 0.1 to 1.0 mV s−1; (b) a functional relationship between the peak current (i) and scan rate (v); (c) capacitive contribution capacitance ratios (blue–white) at different scan rates; (d) EIS spectra of the S-X electrodes after the initial cycle; (e) the relationship between Z′ and ω−1/2 and in the low frequency; (f) GITT profile and D2 of S-1200 as a function of discharge processes (current pulse at 50 mA g−1 for 0.5 h, followed by 2 h relaxation). | |
The cycling stability of the S-X electrodes was investigated at a current density of 100 mA g−1 (Fig. 3d). All the samples possess good cycling stability, while S-1200 can deliver a higher capacity. After cycling for 100 loops, its capacity is still as high as 291.6 mA h g−1 (Fig. 3e). As for the S-1000 and S-1400 electrodes, their specific capacities are only 200.4 and 235.5 mA h g−1 after 100 cycles, respectively. Rate performance is an important parameter for the fast-charging capability of batteries. Fig. 3f shows the rate performance in the same voltage window (0.01–2.5 V), and the average discharge capacities of S-1200 are 295.8, 264.4, 180.5, 121.8, 104.4, 91.9, and 61.9 mA h g−1 at current densities of 0.1, 0.2, 0.4, 0.6, 0.8, 1.0, and 2.0 A g−1, respectively. When the current density returned to 0.1 A g−1, the S-1200 electrode still provided a discharge capacity of 295.3 mA h g−1. The S-1000 and S-1400 electrodes show inferior rate capability (47.8 mA h g−1 and 31.7 mA h g−1 at 2 A g−1, respectively, and 198.8 mA h g−1 and 216.3 mA h g−1 at 0.1 A g−1, respectively). The galvanostatic charge–discharge curves of S-1200 at various current densities have similar shapes, confirming the good rate capability (Fig. 3g). Additionally, the long-term cycling capability of S-1200 was also tested at a high current density of 0.8 A g−1 (Fig. 3h). The capacity of S-1200 displayed good stability; the capacity remained 107.5 mA h g−1 after 1400 cycles. In addition, S-1200 was examined at a high mass loading of ∼8 mg cm−2 to demonstrate its potentially practical use (Fig. S4†). The high-mass-loading electrode delivers the initial areal capacities of 2.91 mA h cm−2 at 0.8 mA cm−2 (2.02 and 1.95 mA h cm−2 at the 2nd and 3rd cycles, respectively) and 2.62 mA h cm−2 at 1.6 mA cm−2 (∼1.5 mA h cm−2 after 5 cycles).
To explore the reaction kinetics and storage behavior of the S-1200 electrode, CV measurements at different scan rates were carried out (Fig. 4a). It can be seen that the charge stored decreased with the increasing scan rate, which could be attributable to the limited diffusion of Na+ during a rapid scan.37 The oxidation peak of the electrode material moves in the positive direction, and the reduction peak is opposite. The electrode polarization is the cause of the rise in the potentiometric difference. In the case of S-1200, it is only ∼95 mV, indicating good reversibility of the redox processes. To determine the storage behavior of Na+, the experimental data were fitted using the power-law relationship between the scan rate and peak current according to eqn (1) and (2).38,39
where
i is the peak current,
ν is the scan rate, and
a and
b are adjustable constants. By plotting log(
i) against log(
ν), the
b value can be extracted from the slope. For the semi-infinite linear diffusion,
b would be close to 0.5;
2 for the surface charge storage process,
b would be near 1.0. As shown in
Fig. 4b, S-1200 exhibits a good linear relationship, and the
b value of peak B/B′ is 0.31/0.32, close to 0.5, indicating that the plateau region is subjected to diffusion-controlled reactions. Meanwhile, the
b value of peak A is 0.98, close to 1, indicating that the slope region is dominated by surface-controlled processes.
39,40 The Na
+ storage mechanism of the S-1200 electrode follows an “adsorption–insertion” process, where the high potential slope region corresponds to the adsorption process of Na
+ on the material surface, while the low potential plateau region corresponds to the insertion/extraction of Na
+ between graphitic layers.
41 In addition, to quantify the specific contributions of these two behaviors, the current response (
i) at a fixed potential (
V) was split into capacitance effects (
k1v) and ion diffusion processes (
k2v1/2) according to
eqn (3) and (4).
1,4where
k1 and
k2 are constants. Fig. S5
† shows the diffusive contribution (striped region) and capacitive contribution (blue region) at a scan rate of 0.1 mV s
−1, and it can be found that the striped region is mainly distributed in the low-voltage plateau region while the blue region occupies the high-voltage slope region. The capacitive contribution ratios are 22.4%, 36.6%, 39.1%, 42.2%, and 44.4% at the scan rates of 0.1, 0.3, 0.5, 0.7, and 1.0 mV s
−1, respectively. Cell polarization and reduced penetration depth of Na
+ into S-1200 are primarily responsible for the steady rise in capacitive contribution at high scan rates, as presented in
Fig. 4c.
To analyze electrochemical kinetics, EIS tests were performed on the S-X samples. Fig. 4d shows the Nyquist plots of the S-X electrodes after the initial cycling; they consist of a concave semicircle in a high-to-medium frequency representing the charge transfer resistance (Rct) and a straight line in the low-frequency region representing the Warburg impedance (W0). Fig. S6† shows the equivalent circuit that was used to fit the EIS data. The Rct of S-1200 is the smallest (26.37 Ω) among the three samples (Table S2†), which indicates that S-1200 has higher charge transfer efficiency and faster electron transport during the discharge/charge process. Additionally, the Na+ diffusion coefficient (D1) was calculated from the Warburg region according to eqn (5) and (6).42,43
| | | Z′ = Rs + Rct + σω−1/2 | (5) |
In eqn (5), σ is the Warburg impedance coefficient calculated by plotting Z′ versus ω−1/2, while ω is the angular frequency. The calculated σ values at the initial cycle of S-1000, S-1200, and S-1400 are 6580.20, 3648.05, and 4058.70 (Fig. 4e). The σ values are further used to estimate D1 using eqn (6), where R is the universal gas constant, T is the absolute temperature, A is the surface area of the electrode, n is the number of electrons transferred per molecule in the electrochemical reaction, F is the Faraday constant, and C is the concentration of Na+. The calculated D1 values are 1.82 × 10⁻¹¹, 3.29 × 10⁻¹¹, and 2.96 × 10⁻¹¹ cm2 s−1 for S-1000, S-1200, and S-1400, respectively. The higher D1 value is favorable for the electrochemical reaction in the subsequent cycles. Besides, GITT was used for evaluating the Na+ diffusion coefficient (D2) of S-1200 (Fig. 4f) (the detailed calculation method of D2 can be found in Fig. S7†).44 The adsorption of Na+ on the surface of the material is the primary cause of the higher D2 value in the high voltage region (E > 0.10 V). The steady reduction of D2 occurs, resulting in charge repulsion that builds up as Na+ gradually occupies the active sites.20,45 In the low-voltage region (E < 0.10 V), the D2 value drops rapidly and reaches its lowest at E = 0.04 V because Na+ must overcome an energy barrier to insert into the graphitic layers. Subsequently, D2 gradually increases, which is attributed to the insertion of Na+ to increase the interlayer spacing, demonstrating that diffusion kinetics are more readily available.46
3.3 Electrochemical performance of SIB full cells
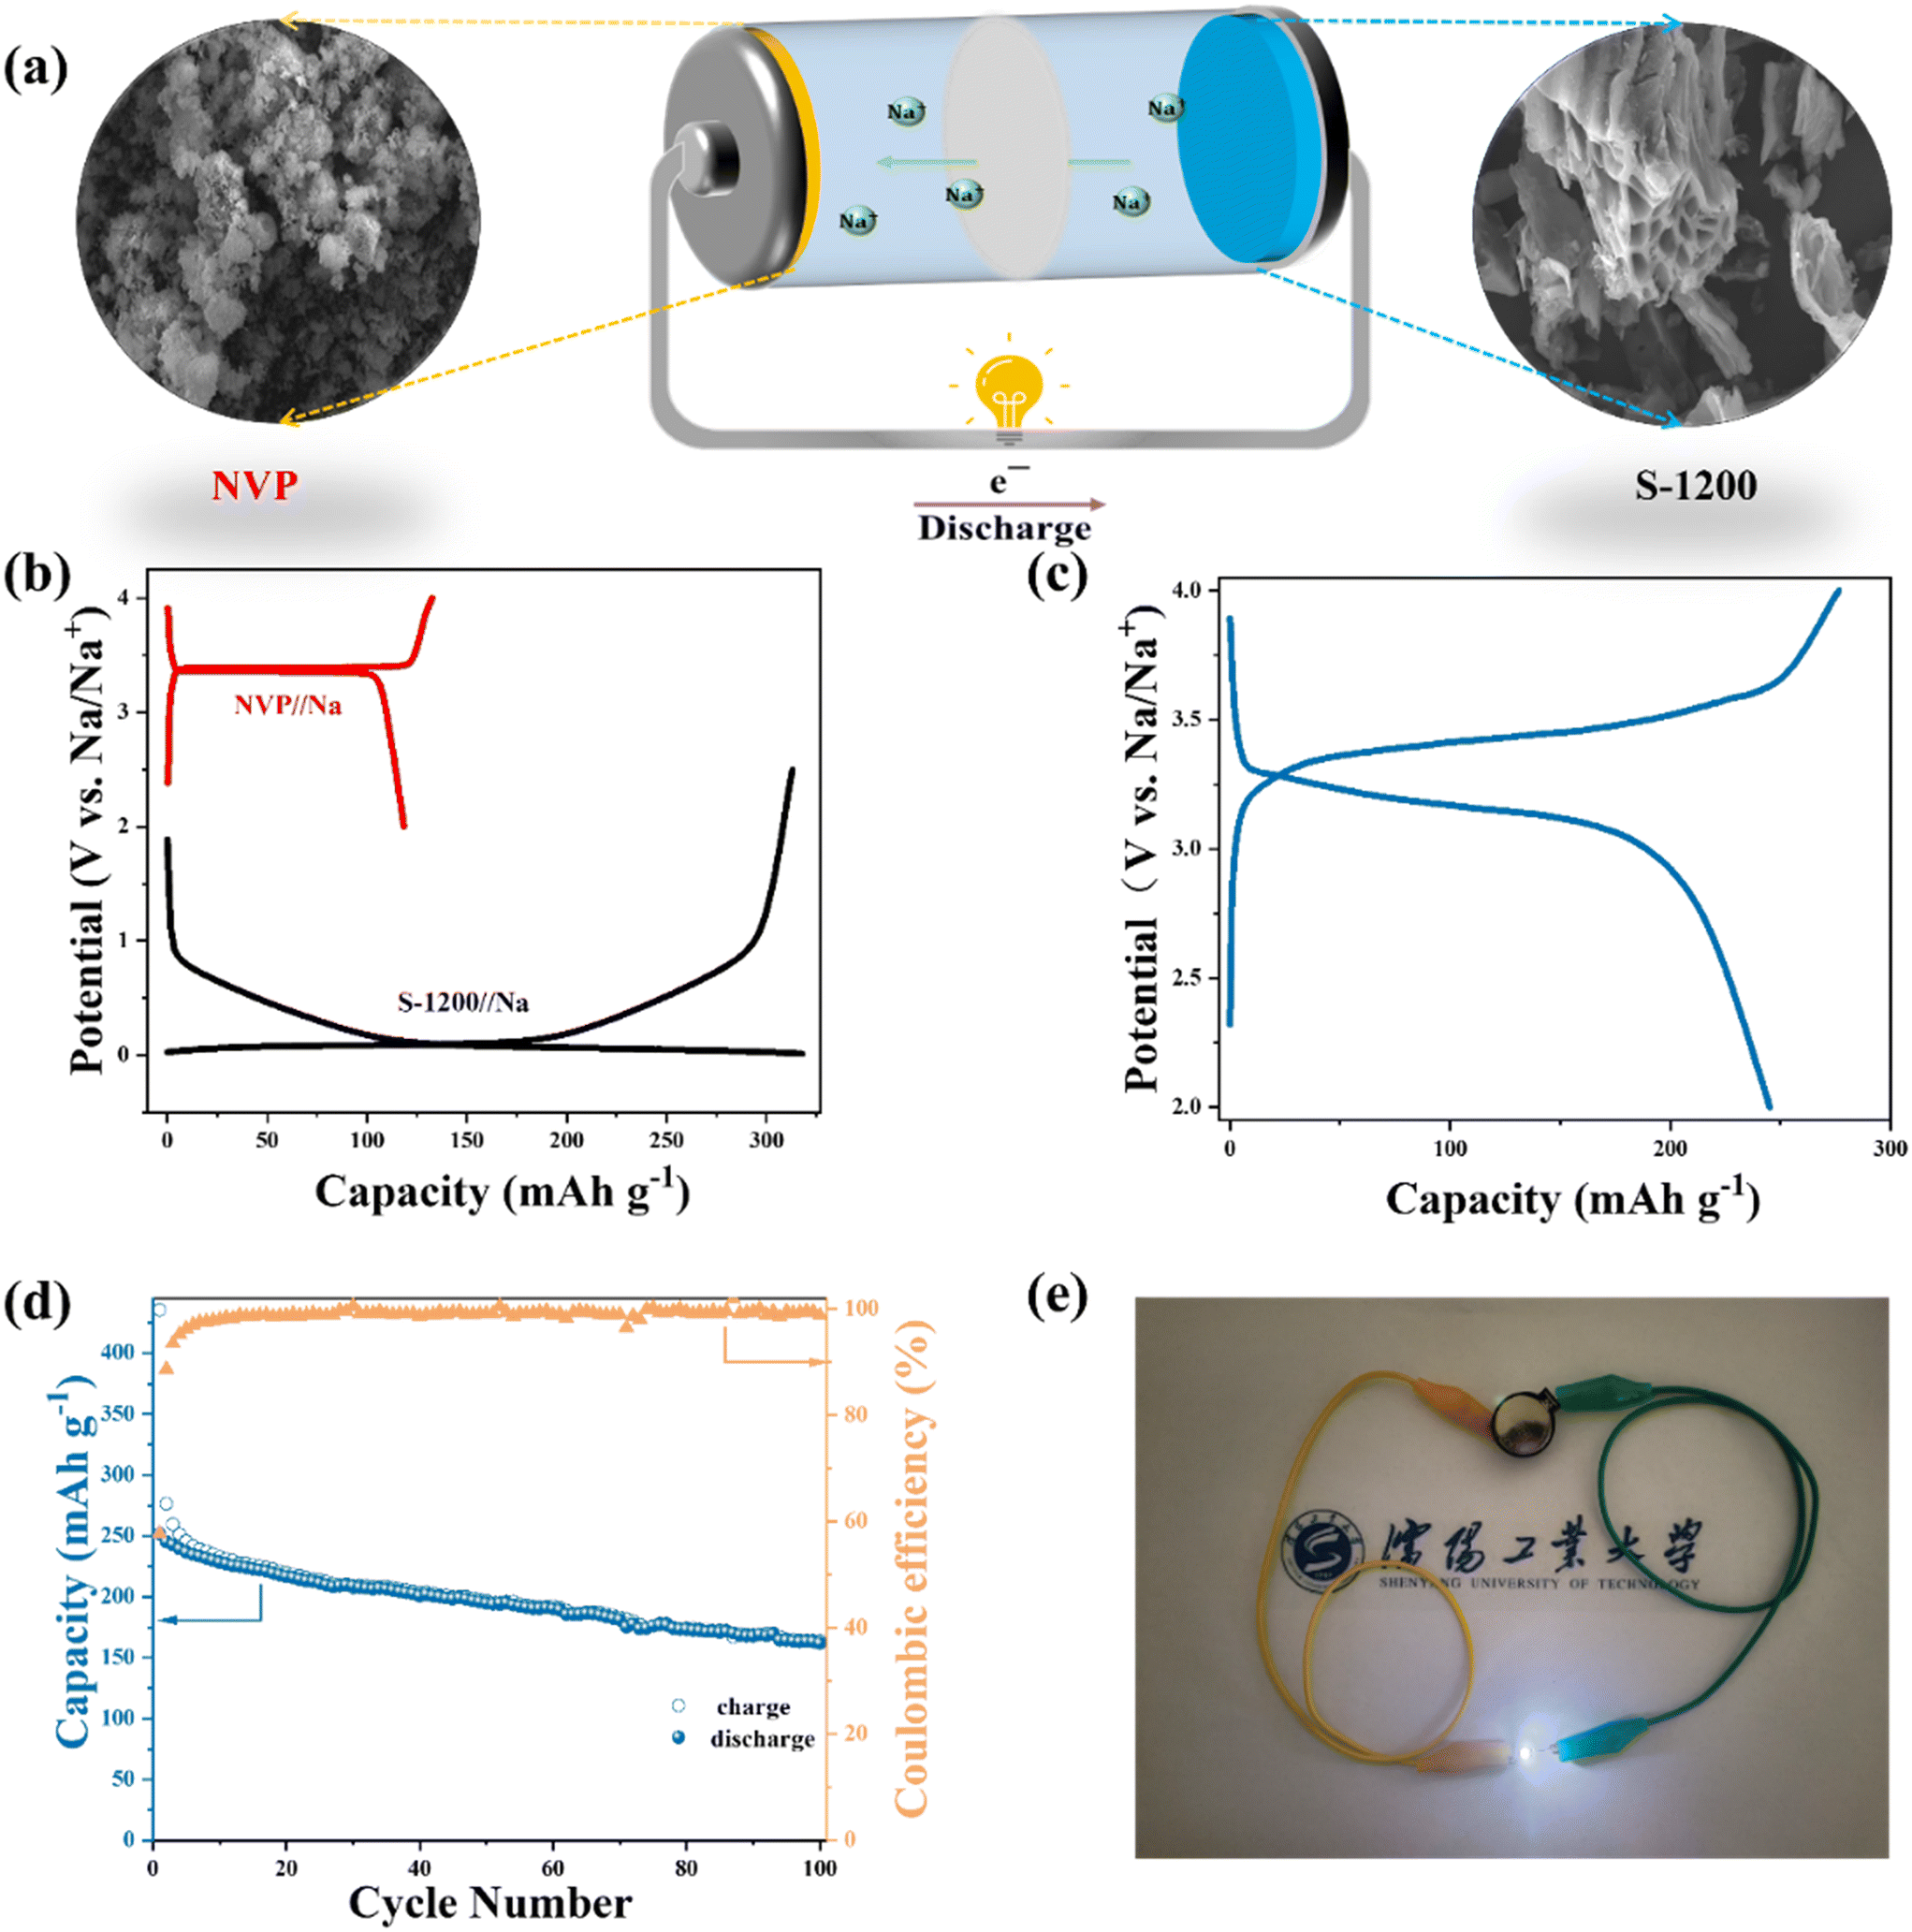
The electrochemical performance of electrode materials in full cells is significant to practical applications.47,48 To this end, we assembled a full cell using the S-1200 anode and an NVP cathode (Fig. 5a). NVP could provide electrochemical performance in both cycling stability and specific capacities (Fig. S8†). The typical charge–discharge curves of NVP and S-1200 in half-cells can be used as a reference to determine the N/P ratio and voltage range of the full cell (Fig. 5b). Fig. 5c shows the charge–discharge profile at 100 mA g−1 in the voltage range of 2–4 V. After 100 cycles at 100 mA g−1, the full cell provided a discharge capacity of 161.9 mA h g−1, corresponding to 121.60 W h kg−1 (Fig. 5d). The full cell exhibited a relatively low ICE (∼58%). This was mainly caused by the relatively low ICE of the NVP cathode (∼66%). Also, the SEI formed by the fresh electrolyte in the full cell could be another reason. After being fully charged, the cell can light the light-emitting diode (LED) with various colors, including red, blue, green, and yellow (Fig. S9†). Notably, the white LED with a higher working voltage (3.0–3.3 V) was illuminated for more than 15 minutes (Video S1†). This demonstrates the practical applicability of S-1200 as an SIB anode material (Fig. 5e). Furthermore, the full cell has a favorable rate performance; a discharge capacity of 141.74 mA h g−1 at 300 mA g−1 is achieved (Fig. S10†). The NVP/S-1200 full cell exhibited good electrochemical performance, being comparable among the reported SIB full cells (Table S3†).
 |
| | Fig. 5 Electrochemical performance of the full cell: (a) the schematic illustration of the full cell; (b) the galvanostatic charge–discharge curves of NVP/Na and S-1200/Na at 100 mA g−1; (c) the galvanostatic charge–discharge curve at 100 mA g−1; (d) the cycling stability at 100 mA g−1; (e) the optical photograph of a white LED lit by the full cell. | |
4. Conclusion
In this work, we employed PLH as a precursor to prepare a series of HC materials with porous structures by adjusting carbonization temperatures. The optimal sample (S-1200) showed great electrochemical performance and kinetics as an SIB anode, delivering a capacity of 334.17 mA h g−1 (at the 2nd cycle) and maintaining a capacity retention of 85.0% after 100 cycles at 0.1 A g−1. The capacity still maintained 107.5 mA h g−1 after 1400 cycles, even at a high current density of 0.8 A g−1. Such superior cycling performance may arise from the unique structural properties providing abundant active sites for Na+ storage and enough room for volume changes. Even at 1.0 and 2.0 A g−1, the rate capacities were 91.9 and 61.9 mA h g−1, respectively. Significantly, the assembled NVP/S-1200 full cell maintained a capacity of 161.9 mA h g−1 at 100 mA g−1 after 100 cycles, corresponding to a high energy density of 121.60 W h kg−1. Our work may not only realize the high-value utilization of waste biomass PLH, but also prepare a promising anode material for electrochemical Na+ storage, thus further pushing the commercialization of SIBs towards low-cost and large-scale.
Data availability
All data that support the findings of this study are included within the article (and any supplementary files).
Conflicts of interest
There are no conflicts to declare.
Acknowledgements
This work was supported by the National Natural Science Foundation of China (51974188), the Liaoning Revitalization Talents Program (XLYC2008014), the Shenyang University of Technology (QNPY202209-4), and the Education Department of Liaoning Province (JYTQN2023285). Y. X. acknowledges the financial support from the Engineering and Physical Sciences Research Council (EP/V000152/1, EP/X000087/1), the Leverhulme Trust (RPG-2021-138), and the Royal Society (IEC\NSFC\223016). For the purpose of open access, the author has applied a Creative Commons Attribution (CC BY) license to any Author Accepted Manuscript version arising.
References
- Y. Wu, Z. Zhao, X. Hao, R. Xu, L. Li, D. Lv, X. Huang, Q. Zhao, Y. Xu and Y. Wu, Carbon Neutralization, 2023, 2, 551 CrossRef CAS.
- J. Hwang, S. Myung and Y. Sun, Chem. Soc. Rev., 2017, 46, 3529 RSC.
- J. Li, G. Liang, W. Zheng, S. Zhang, K. Davey, W. Pang and Z. Guo, Nano Mater. Sci., 2023, 5, 404 CrossRef CAS.
- Y. Wang, C. Xu, X. Tian, S. Wang and Y. Zhao, Chin. J. Struct. Chem., 2023, 42, 100167 CrossRef CAS.
- H. Pan, Y. Hu and L. Chen, Energy Environ. Sci., 2013, 6, 2338 RSC.
- E. Gabriel, C. Ma, K. Graff, A. Conrado, D. Hou and H. Xiong, eScience., 2023, 3, 100139 CrossRef.
- Y. Wu, W. Xia, Y. Liu, P. Wang, Y. Zhang, J. Huang, Y. Xu, D. Li and L. Ci, Tungsten, 2024, 6, 278–292 CrossRef.
- Y. Wu, X. Wu, Y. Guan, Y. Xu, F. Shi and J. Liang, Xinxing Tan Cailiao, 2022, 37, 852 CAS.
- X. Li, X. Wang and J. Sun, Xinxing Tan Cailiao, 2021, 36, 106 CAS.
- W. Zhang, M. Sun, W. Wang, G. Huang, X. Qiu and H. Alshareef, Nano Energy, 2021, 87, 106184 CrossRef CAS.
- Y. Wu, G. Chen, X. Wu, L. Li, J. Yue, Y. Guan, J. Hou, F. Shi and J. Liang, J. Semicond., 2023, 44, 041701 CrossRef.
- W. Zhang, F. Zhang, F. Ming and H. Alshareef, EnergyChem, 2019, 1, 100012 CrossRef.
- X. Dou, I. Hasa, D. Saurel, C. Vaalma, L. Wu, D. Buchholz, D. Bresser, S. Komaba and S. Passerini, Mater. Today, 2019, 23, 87 CrossRef CAS.
- Y. Bai, Z. Wang, C. Wu, R. Xu, F. Wu, Y. Liu, H. Li, Y. Li, J. Lu and K. Amine, ACS Appl. Mater. Interfaces, 2015, 7, 5598 CrossRef CAS PubMed.
- F. Wu, R. Dong, Y. Bai, Y. Li, G. Chen, Z. Wang and C. Wu, ACS Appl. Mater. Interfaces, 2018, 10, 21335 CrossRef CAS.
- C. Bommier, W. Luo, W. Gao, A. Greaney, S. Ma and X. Ji, Carbon, 2014, 76, 165 CrossRef CAS.
- Y. Li, S. Xu, X. Wu, J. Yu, Y. Wang, Y. Hu, H. Li, L. Chen and X. Huang, J. Mater. Chem. A, 2015, 3, 71 RSC.
- Z. Zhu, F. Liang, Z. Zhou, X. Zeng, D. Wang, P. Dong, J. Zhao, S. Sun, Y. Zhang and X. Li, J. Mater. Chem.
A, 2018, 6, 1513 RSC.
- F. Wu, M. Zhang, Y. Bai, X. Wang, R. Dong and C. Wu, ACS Appl. Mater. Interfaces, 2019, 11, 12554 CrossRef CAS PubMed.
- A. Beda, J. Meins, P. Taberna, P. Simon and C. Ghimbeu, Sustainable Mater. Technol., 2020, 26, e00227 CrossRef CAS.
- X. Wen, J. Hempel, R. M. Schweiggert, Y. Ni and R. Carle, J. Agric. Food Chem., 2017, 65, 6140 CrossRef CAS PubMed.
- H. Wang, W. Yu, J. Shi, N. Mao, S. Chen and W. Liu, Electrochim. Acta, 2016, 188, 103 CrossRef CAS.
- J. Zhu, J. Roscow, S. Chandrasekaran, L. Deng, P. Zhang, T. He, K. Wang and L. Huang, ChemSusChem, 2020, 13, 1275 CrossRef CAS PubMed.
- S. Huang, X. Qiu, C. Wang, L. Zhong, Z. Zhang, S. Yang, S. Sun, D. Yang and W. Zhang, Xinxing Tan Cailiao, 2023, 38, 40 CAS.
- Y. Xu, C. Zhang, M. Zhou, Q. Fu, C. Zhao, M. Wu and Y. Lei, Nat. Commun., 2018, 9, 1720 CrossRef PubMed.
- W. Zhang, J. Yin, M. Sun, W. Wang, C. Chen, M. Altunkaya, A. Emwas, Y. Han, U. Schwingenschlogl and H. Alshareef, Adv. Mater., 2020, 32, 2000732 CrossRef CAS PubMed.
- W. Nie, X. Liu, Q. Xiao, L. Li, G. Chen, D. Li, M. Zeng and S. Zhong, ChemElectroChem, 2020, 7, 631 CrossRef CAS.
- H. Zhu, J. Li, D. Wu, G. Zhang, Y. Sun, A. Wang and K. Sun, BioChar, 2023, 5, 46 CrossRef CAS.
- Y. Chen, X. Hu, B. Evanko, X. Sun, X. Li, T. Hou, S. Cai, C. Zheng, W. Hu and G. Stucky, Nano Energy, 2018, 46, 117 CrossRef CAS.
- X. Dou, I. Hasa, D. Saurel, M. Jauregui, D. Buchholz, T. Rojo and S. Passerini, ChemSusChem, 2018, 11, 3276 CrossRef CAS PubMed.
- S. Komaba, W. Murata, T. Ishikawa, N. Yabuuchi, T. Ozeki, T. Nakayama, A. Ogata, K. Gotoh and K. Fujiwara, Adv. Funct. Mater., 2011, 21, 3859 CrossRef CAS.
- A. Ponrouch, E. Marchante, M. Courty, J. Tarascon and M. Palacín, Energy Environ. Sci., 2012, 5, 8572 RSC.
- J. Qian, Y. Chen, L. Wu, Y. Cao, X. Ai and H. Yang, Chem. Commun., 2012, 48, 7070 RSC.
- Z. Tang, S. Zhou, Y. Huang, H. Wang, R. Zhang, Q. Wang, D. Sun, Y. Tang and H. Wang, Electrochem. Energy Rev., 2023, 6, 8 CrossRef CAS.
- Y. Wan, Y. Liu, D. Chao, W. Li and D. Zhao, Nano Mater. Sci., 2023, 5, 189 CrossRef CAS.
- T. Or, S. Gourley, K. Kaliyappan, Y. Zheng, M. Li and Z. Chen, Electrochem. Energy Rev., 2022, 5, 20 CrossRef CAS.
- J. Liu, J. Wang, C. Xu, H. Jiang, C. Li, L. Zhang, J. Lin and Z. Shen, Adv. Sci., 2018, 5, 1700322 CrossRef.
- J. Mathiesen, R. Väli, M. Härmas, E. Lust, J. Bülow, K. Jensen and P. Norby, J. Mater. Chem. A, 2019, 7, 11709 RSC.
- Z. Zheng, S. Hu, W. Yin, J. Peng, R. Wang, J. Jin, B. He, Y. Gong, H. Wang and H. Fan, Adv. Energy Mater., 2023, 14, 2303064 CrossRef.
- J. Wang, W. Lv, Q. Ran, L. Yan, L. Zhang and Z. Shi, Appl. Surf. Sci., 2021, 558, 149824 CrossRef CAS.
- S. Qiu, L. Xiao, M. Sushko, K. Han, Y. Shao, M. Yan, X. Liang, L. Mai, J. Feng, Y. Cao, X. Ai, H. Yang and J. Liu, Adv. Energy Mater., 2017, 7, 1700403 CrossRef.
- C. Yu, Y. Li, Z. Wang, X. Wang, Y. Bai and C. Wu, Rare Met., 2022, 41, 1616 CrossRef CAS.
- D. Kim, O. Li and J. Kang, Carbon, 2020, 168, 448 CrossRef CAS.
- C. Li, S. Dong, R. Tang, X. Ge, Z. Zhang, C. Wang, Y. Lu and L. Yin, Energy Environ. Sci., 2018, 11, 3201 RSC.
- R. Zhao, H. Di, X. Hui, D. Zhao, R. Wang, C. Wang and L. Yin, Energy Environ. Sci., 2021, 14, 5096 RSC.
- Q. Liu, R. Xu, D. Mu, G. Tan, H. Gao, N. Li, R. Chen and F. Wu, Carbon Energy, 2022, 4, 458 CrossRef CAS.
- N. Wang, Z. Bai, Y. Qian and J. Yang, Adv. Mater., 2016, 28, 4126 CrossRef CAS PubMed.
- S. Guo, P. Liu, Y. Sun, K. Zhu, J. Yi, M. Chen, M. Ishida and H. Zhou, Angew. Chem., Int. Ed., 2015, 54, 11701 CrossRef CAS PubMed.
|
| This journal is © The Royal Society of Chemistry 2024 |

 Open Access Article
 This Open Access Article is licensed under a
  *c and
Yang
Xu
*c and
Yang
Xu