
 Open Access Article
 This Open Access Article is licensed under a
 Creative Commons Attribution 3.0 Unported Licence
Carbon dot as fluorescence sensor for glutathione in human serum samples: a review
Kawan F.
Kayani
 *abc,
Sewara J.
Mohammed
de,
Dlzar
Ghafoor
bf,
Mohammed K.
Rahim
b and
Harez Rashid
Ahmed
b
*abc,
Sewara J.
Mohammed
de,
Dlzar
Ghafoor
bf,
Mohammed K.
Rahim
b and
Harez Rashid
Ahmed
b
aDepartment of Chemistry, College of Science, Charmo University, 46023 Chamchamal/Sulaimani, Kurdistan Region, Iraq. E-mail: kawan.nasralddin@univsul.edu.iq
bDepartment of Chemistry, College of Science, University of Sulaimani, Qliasan St, 46002, Sulaymaniyah City, Kurdistan Region, Iraq
cDepartment of Pharmacy, Kurdistan Technical Institute, Sulaymaniyah City, Iraq
dAnesthesia Department, College of Health Sciences, Cihan University Sulaimaniya, Sulaimaniya 46001, Kurdistan Region, Iraq
eResearch and Development Center, University of Sulaimani, Qlyasan Street, Kurdistan Regional Government, Sulaymaniyah, 46001, Iraq
fCollege of Science, Department of Medical Laboratory Sciences, Komar University of Science and Technology, 46001, Sulaymania, Iraq
First published on 14th May 2024
Abstract
In recent times, glutathione (GSH) has emerged as a crucial player in various cellular functions and is implicated in human pathologies. The creation of simple and highly responsive sensors capable of identifying GSH would be immensely valuable for gaining a deeper understanding of disease mechanisms. Carbon dots (CDs) have attracted considerable interest owing to their remarkable fluorescence capabilities, excellent compatibility with biological systems, and ease of production. Consequently, numerous research endeavors have focused on developing highly efficient CD probes for the rapid and precise detection of GSH. However, a comprehensive overview addressing the effective synthesis of CDs and their practical utility in GSH detection is still needed to further enhance the widespread application of CDs. In this context, we present, for the first time, a detailed introduction to GSH and CDs. Following this, we classify the synthetic methods of CDs. Additionally, considering various sensing categories, we classify CD fluorescent probes into single emission probes of CDs, ratiometric sensing probes of CDs, and visual detection of CDs. Furthermore, we highlight existing shortcomings and potential avenues for future research to offer valuable guidance in the preparation of commendable CDs and the detection of GSH.
1. Introduction
GSH, the most abundant natural thiol and an essential antioxidant in biological systems, plays a central role in safeguarding against harmful free radicals and toxins.1–3 GSH is crucial for maintaining redox homeostasis by balancing its disulfide form.4 Typically, GSH is predominantly found in its reduced form under normal conditions. However, situations leading to oxidative stress in pathophysiology can elevate GSSG concentrations through the oxidation of reduced GSH to its oxidized form, glutathione disulfide (GSSG).5 Irregular GSH levels are closely linked to various diseases, including Alzheimer's disease, cancer, liver damage, diabetes, and arthritis.6 Furthermore, GSH, a tripeptide composed of γ-L-glutamyl-L-cysteinyl-glycine, is renowned for its essential biological roles. Fig. 1 illustrates several critical cellular functions associated with it.7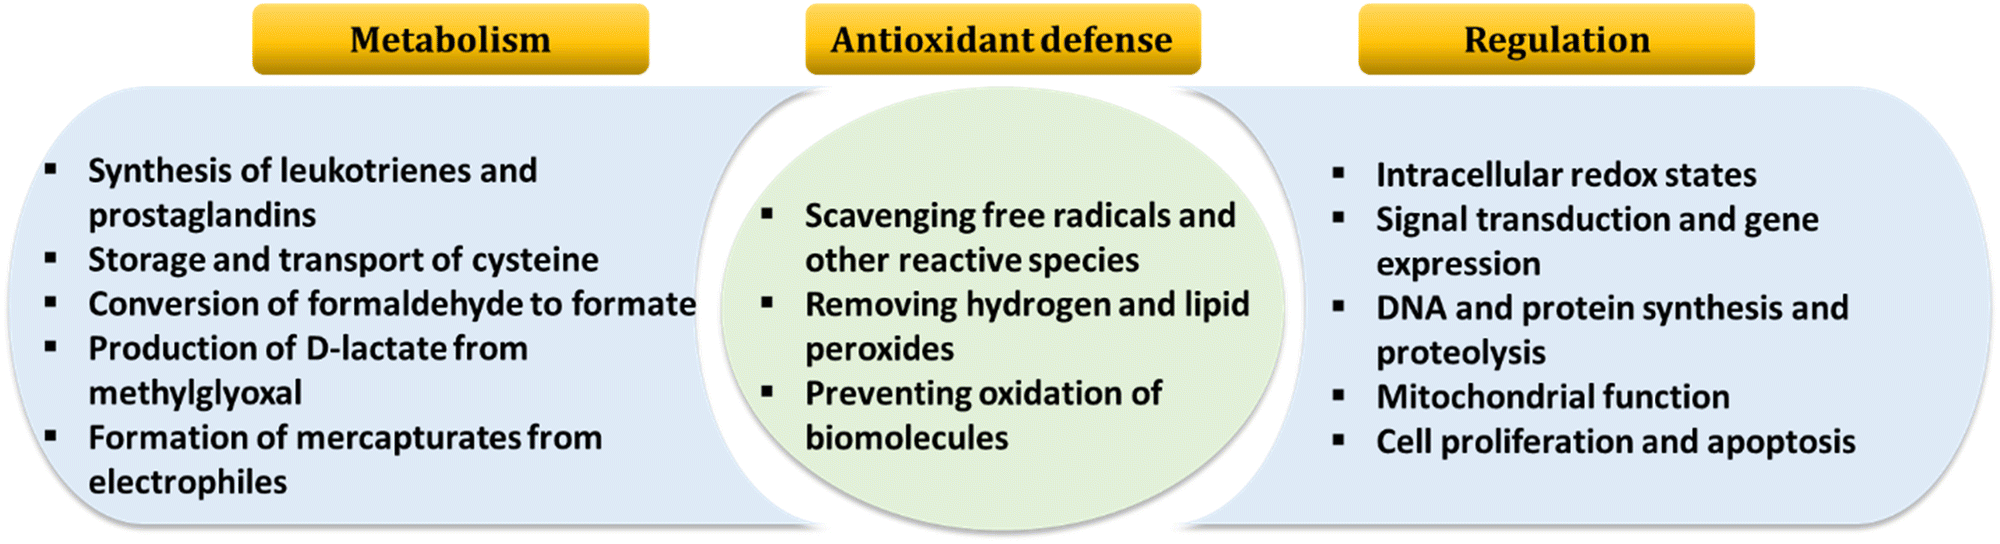 | ||
| Fig. 1 An overview of GSH functions in the organism. Adapted from ref. 7. | ||
Hence, it is essential to devise a straightforward, effective, and sensitive method for detecting and monitoring the levels of GSH in serum samples.8 Several techniques have been devised for GSH assays, including EC,9,10 HPLC,11,12 SERS,13 MRI,14 ECL,15 COL,16 and FL spectroscopy.17–19 Among these, FL spectroscopy is distinguished by its notable benefits, including heightened sensitivity, user-friendly operation, real-time assay capability, and nondestructive detection of targets in various systems.20
However, various fluorescent materials have been employed for the determination of GSH, including metal–organic frameworks (MOFs), semiconductor quantum dots (QDs), nanoclusters (NCs), and small molecule fluorescent sensors. These materials, however, come with certain drawbacks. For instance, MOFs face poor solubility issues, nanoclusters exhibit short-term stability issues, QDs pose toxicity concerns related to their metals, and sensors based on small molecules have poor selectivity.21–27 Carbon dots have garnered significant attention in various fields over the last few years.28–31
CDs represent a novel category of carbon nanomaterials endowed with fascinating optical and photophysical characteristics.32–35 The chemical characteristics of CDs, especially in the domains of analyte sensing.36–38 CDs stand out as preferred sensing probes due to their distinctive features, including their small size, solubility, tunable photoluminescence, nonblinking fluorescence, and biocompatibility.39–46 Among these features, the photoluminescence of CDs stands out, demonstrating both excitation-dependent and independent emission, multicolor emission, photostability, and both up-conversion and down-conversion FL. These attributes can be attributed to surface energy traps, quantum confinement, and defects within the structure of CDs.47,48
In 2004, CDs were fortuitously uncovered during the separation and purification of SWCNs.49 Since this discovery, the straightforward synthesis and distinctive properties of CDs have led to a significant increase in the number of publications utilizing diverse precursors and synthesis methods. The methods are primarily categorized as either top-down or bottom-up approaches.
Top-down techniques involve the breaking and separation of carbon sources such as graphite, carbon fibers, and coal. Various methods, including oxidative cleavage, hydrothermal, microwave, electrochemical, and ultrasonic-assisted techniques, are utilized in top-down approaches. Conversely, bottom-up methods entail the pyrolysis of small organic molecules like citric acid, glucose, fructose, and ascorbic acid. These molecules can be combined with others to introduce heteroatom doping atoms.50–53
Due to its ability to interact with fluorescent species, compounds, or nanomaterials, GSH can be quantitatively assessed by monitoring changes in fluorescent signals. Recent advancements in fluorescent GSH sensing can be categorized based on the origin of the output signals into three types: (1) signals emanating from fluorescent compounds, where GSH induces alterations in fluorescence intensity or emission wavelength through chemical reactions. (2) Signals originating from fluorescent indicators, where GSH triggers fluorescence activation by interrupting FRET between indicators and certain sensing nanoplatforms. (3) Signals arising from fluorescent nanomaterials, where GSH causes changes in fluorescence performance by perturbing surface properties or nanostructures. Among various fluorescent sensors, carbon dots have garnered significant attention as one of the most promising sensors for GSH due to their well-known nanomaterial properties with tunable fluorescence.54 The fluorescent behavior of carbon dots is attributed to factors such as conjugated π-domains of the carbon core, surface functional groups, incorporation of organic fluorophores, doping elements, etc. By modulating these factors, GSH can regulate the fluorescence of carbon dots, thereby enabling their straightforward application as fluorescent GSH sensors.
In this review, with a focus on providing a distinct perspective, we will emphasize recent advancements in the application of CDs for detecting GSH in serum samples. This includes discussions on the synthesis and sensing mechanisms of CDs. Practical applications for GSH sensing encompass single probes, ratiometric probes, and visual detection modes in real serum samples. Finally, we will briefly discuss the obstacles and potential advancements in the exploration and advancement of applications involving carbon dots.
2. Synthesis method for carbon dots
Regarding carbon sources, the creation of carbon dots can be broadly categorized into two methods: ‘top-down’ and ‘bottom-up’.55 In the ‘top-down’ approach, larger structures are broken down into smaller ones through various physical or chemical processes. This method employs techniques such as laser ablation, electrochemical processes, arc discharge, and plasma treatment for synthesis. These methods encompass template approaches, supported synthetic strategies, pyrolytic processes, microwave-based techniques, chemical oxidation, reverse micelle processes, and various other approaches for bottom-up synthesis. In the 'bottom-up' approach, smaller building blocks or molecules are assembled to create larger structures. Biomass materials are gaining preference in CD synthesis due to their renewable characteristics.56–58CDs offer advantages over other nanoparticles due to the availability of multiple synthesis methods, some of which are environmentally friendly.59 The ‘bottom-up’ method is especially beneficial as it is more eco-friendly, less time-consuming, and allows for easy surface modification and composition adjustment of CDs. This stands in contrast to the 'top-down' method, which typically necessitates lengthier processing times, more severe reaction conditions, and the utilization of costly materials and equipment. Synthetic conditions such as time, temperature, and voltage can be optimized for specific CD preparation.60 Post-synthetic purification methods, ranging from simple treatments like centrifugation, dialysis, and filtration to more precise techniques like electrophoresis and chromatography, are employed to obtain purified and monodisperse CDs with independent properties.61 Additionally, surface functionalization during or after synthesis significantly influences the properties and applications of CDs.62
2.1 Top-down approach
Top-down method involves the controlled fragmentation of larger carbon-containing structures, such as CNT or graphene, into smaller nanoparticles through physical or chemical processes, such as laser ablation, arc discharge, or plasma treatment.63 His approach allows for precise manipulation at the nanoscale to create uniform carbon dots with tailored size, morphology, and surface properties.64 By selectively breaking down larger carbon structures, the top-down method offers versatility and control over the final characteristics of the carbon dots, making it a valuable technique for nanomaterial synthesis.65 To be specific, chemical oxidation emerges as a straightforward and convenient method for mass-producing high-quality CDs without the need for complex equipment.This method includes breaking down precursor carbon materials like carbon fibers, graphene oxide, or CNT by employing strong acids or oxidizing agents.66 During the chemical oxidation process, potent oxidants are employed to disrupt the covalent bonds within the carbon source, gradually converting it into smaller molecules. The effectiveness of the reaction is primarily influenced by the oxidizability of the oxidant employed.
Additionally, the oxidative process introduces an abundance of oxygen-containing functional groups, such as –OH and –COOH, which contribute to excellent hydrophilicity and customizable emission properties in the CDs67 To create environmentally friendly GCDs, H2SO4 was chosen as an oxidant, and green tea leaf residue served as the raw material. Initially, the tea leaf residue underwent drying at 80 °C and grinding into powder, followed by calcination at 350 °C for 2 hours. Subsequently, the resulting residue was dissolved in concentrated H2SO4 and carbonized for 20 hours. Ultimately, GCDs were achieved.46 The ultrasonic synthesis method achieves reactions through the thermal effect of cavitation and ultra-high-frequency vibration, offering unparalleled advantages such as eco-friendliness, cost-effectiveness, strong penetration, and uniform effects.68
This technique involves the generation of alternating high-pressure waves and low-pressure waves during ultrasound processing, resulting in the formation and collapse of small bubbles within the liquid. Consequently, macroscopic carbon materials are fragmented into nanoscale carbon dots due to the intense hydrodynamic shear forces originating from the cavitation of these small bubbles,69,70 The laser ablation technique involves using a high-energy laser to irradiate the material, causing rapid heating. Laser pulses generate small pits in the sample, consuming the material and producing plasma that flows through the sample surface, ultimately ionizing it,71,72 The arc discharge method is a specialized technique used to fabricate carbon nanoparticles, specifically carbon dots. In this method, two graphite electrodes are submerged in a liquid medium, typically water or organic solvents, and subjected to an electric discharge. This discharge generates intense heat and pressure, causing the graphite electrodes to undergo vaporization and fragmentation. Consequently, carbon nanoparticles, including carbon dots, are formed within the solution,73,74
2.2 Bottom-up approach
The bottom-up method involves the assembly of smaller carbon-containing molecules or building blocks to form larger nanoparticles through self-assembly or controlled growth processes.75 This method enables the creation of carbon dots with complex structures and functionalities by building from molecular precursors.76 The CDs produced through this method typically exhibit abundant functional groups, resulting in a high fluorescence quantum yield. However, the particle size distribution is uneven, necessitating additional steps for separation and purification.77 Synthetic conditions such as time, temperature, and voltage can be optimized for specific CD preparation. The bottom-up method starts with molecular-scale components and builds them up to create the desired nanomaterial through various techniques such as pyrolysis. The controlled assembly and growth of carbon dots from organic precursors are facilitated through the use of microwave-assisted synthesis and hydrothermal synthesis,78,79The hydrothermal/solvothermal method involves a synthesis technique where the reaction mixture interacts with water or organic substances and a non-aqueous solvent under defined temperature and autogenous pressure conditions within a sealed system, such as an autoclave.80 This approach is considered direct and efficient, facilitating polymerization and carbonization reactions. It has found widespread application in preparing various materials owing to factors such as the high reactivity of the reactants, ease of solution control, minimal environmental impact, and low energy consumption under hydrothermal conditions.81 The diverse range of reaction substrates, reaction temperatures, and reaction times significantly alters the properties of the resulting products,82,83 Pyrolysis, a method employed in the synthesis of CDs, entails the controlled thermal decomposition of carbon-rich precursors under inert conditions.84 Initially, suitable carbonaceous materials, such as organic compounds or biomass derivatives, are carefully selected.85 Subsequently, these materials undergo gradual heating in an oxygen-free environment to avoid combustion.86 As the temperature escalates, chemical bonds within the precursors disintegrate, liberating volatile organic compounds and yielding carbon-rich intermediates. These intermediates then undergo further molecular reorganization and condensation, ultimately culminating in the formation of carbon dots with precise structural attributes, including size, morphology, and surface chemistry,87,88 The microwave method is widely utilized for directly carbonizing organic materials into carbon dots under microwave radiation, providing effectiveness and ease of operation, and minimal equipment requirements,89,90 The microwave method for synthesizing carbon dots involves using microwave irradiation to facilitate the conversion of carbon-rich precursors into carbon nanoparticles. Microwave treatment initiates the dehydration and pyrolysis of precursor substances, leading to their carbonization into small-sized CDs. As mentioned before, various methods have been devised for generating CDs for various applications, as illustrated in Fig. 2.
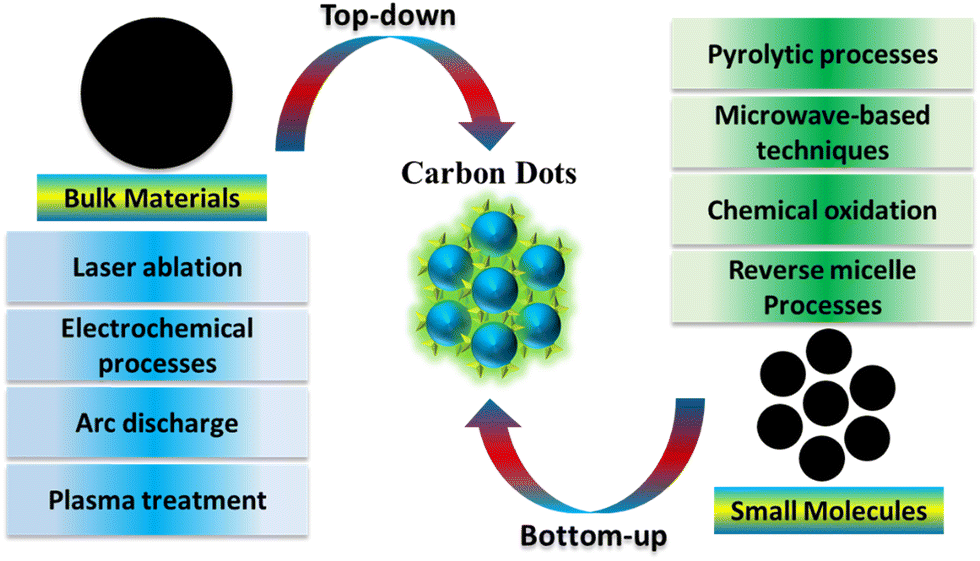 | ||
| Fig. 2 Schematic diagram depicting the synthesis of CDs, incorporating both top-down and bottom-up approaches. | ||
3. Sensing mechanisms
In theory, any alteration in fluorescence, be it in intensity, wavelength, anisotropy, or lifetime, linked to varying analyte concentrations, holds the promise of being employed as a sensor.513.1 Static quenching
Fluorescence quenching describes a phenomenon that diminishes the overall intensity of fluorescent light. It is categorized into static quenching and dynamic quenching. In static quenching, a non-fluorescent complex is created between the fluorescent molecule and the quencher, leading to a reduction in the number of fluorescent molecules and a consequent decrease in fluorescence intensity. Notably, there is no observed change in fluorescence lifetime during the static quenching process,83,91,92 As shown in Fig. 3A.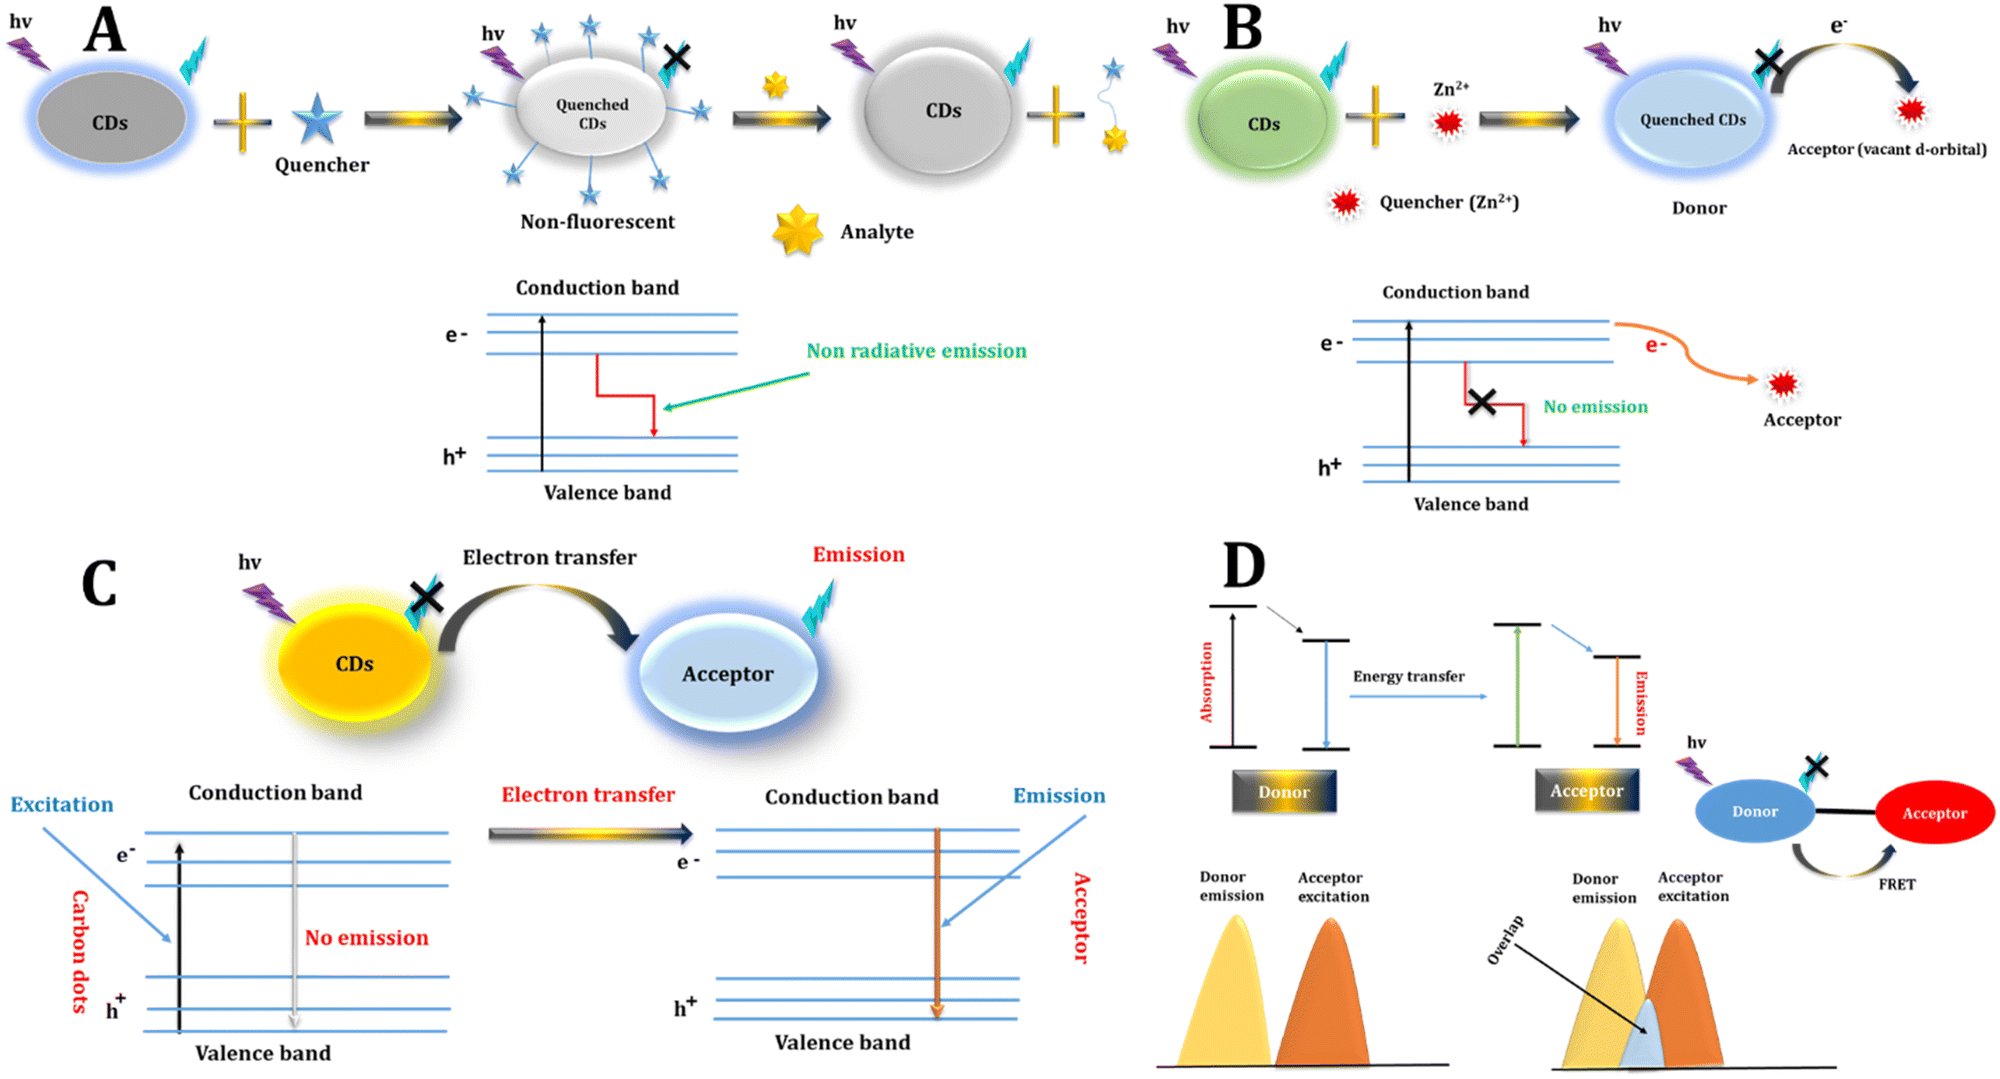 | ||
| Fig. 3 Various FL sensing mechanisms include (A) static quenching, (B) dynamic quenching, (C) PET, and (D) FRET. | ||
3.2 Dynamic quenching
Dynamic quenching can be elucidated through energy transfer or charge transfer mechanisms. In the case of CDs, the excited state reverts to the ground state due to collisions with the quencher. For dynamic quenching to occur, the quencher must be in close proximity to the fluorescent molecule when it is in its excited state, initiating a reaction that accelerates the decay of the excited state. This leads to a shorter fluorescent lifetime while leaving the absorption spectrum unchanged.33,34 As shown in Fig. 3B.3.3 Photoinduced electron transfer (PET)
PET is a deactivation mechanism characterized by an internal redox reaction occurring between the excited state of the fluorophore and another species capable of either donating or accepting an electron. In PET, an intricate complex is established between the electron donor and the electron acceptor. This complex has the ability to revert to the ground state without emitting a photon, although in certain instances, exciplex emission may be detected. Ultimately, the additional electron present on the acceptor is restored to the electron donor to complete the process.31–33,35 As shown in Fig. 3C.3.4 Photo-induced charge transfer (PCT)
This process entails the exchange of an electron between electron donor and acceptor functionalities to trigger FL. Partial charge transfer sensors involve the partial transfer of charges within a fully conjugated π system. The interaction between the donor and acceptor results in a modification of electron energy levels, leading to alterations in FL signals. PCT sensors are characterized by an integrated receptor and fluorophore, whereas PET sensors feature the separation of the electron donor moiety from the fluorophore by a spacer.513.5 Internal filter effect (IFE)
IFE is influenced by the spectral overlap between the fluorophore and absorber. Unlike FRET, IFE relies on radiative energy transfer, primarily affecting the donor's ground state through energy perturbation. Consequently, IFE results in only fluorescence quenching without any noticeable alteration in the fluorescence lifetime. Another notable difference from FRET is the absence of a distance requirement between the energy donor and absorber in IFE.32,36,373.6 Aggregation induced emission (AIE)
AIE represents a luminescent phenomenon that stands in direct contrast to the Aggregation-Caused Quenching (ACQ) effect. In AIE materials, light emission does not occur in a sparse solution, yet strong fluorescence is evident at elevated concentrations or in a solid state. This behavior arises due to the dynamic intramolecular rotation of molecules in a diluted solution, which disperses their excited state energy (Table 1). However, in the aggregated state, intramolecular rotation becomes significantly constrained, resulting in the inhibition of nonradiative energy dissipation and the augmentation of FL.93| Mechanisms | Full form | Mechanism | Dependency |
|---|---|---|---|
| Static quenching | Static quenching | Quencher forms a nonfluorescent complex with fluorophore, inhibiting fluorescence | Concentration of quencher, no dependence on time |
| Dynamic quenching | Dynamic quenching | Quencher transiently interacts with fluorophore, causing temporary decrease in fluorescence | Concentration of quencher, dynamic nature of interaction |
| PET | Photoinduced electron Transfer | Electron transfer from excited state of donor to acceptor | Extent of overlap between donor emission and acceptor absorption spectra |
| PCT | Photo-induced charge transfer | Charge transfer from donor to acceptor upon photoexcitation | Extent of overlap between donor emission and acceptor absorption spectra |
| IEF | Inner filter effect | Attenuation of fluorescence due to absorption by chromophores | Concentration and absorbance characteristics of chromophores |
| AIE | Aggregation induced emission | Emission enhancement upon aggregation of fluorophores | Aggregation state of fluorophores |
| FRET | Förster resonance energy transfer | Energy transfer between donor and acceptor fluorophores based on dipole–dipole interactions | Distance between donor and acceptor, spectral overlap, orientation |
3.7 Förster resonance energy transfer (FRET)
Resonance energy transfer is another valuable phenomenon for fluorescence sensors. In FRET, an initially excited molecule (donor) reverts to its ground state orbital, concurrently transferring energy to excite an electron on the acceptor.94 This process involves the non-radiative energy transfer between donor and acceptor fluorophores, termed FRET pairs, occurring when the emission spectrum of CDs overlaps with the absorption spectrum of the quencher,92,95 FRET proceeds sans photon emission, owing to long-range dipole–dipole interactions between CDs and the quencher.96 The efficiency of energy transfer hinges on factors such as the relative orientation of donor and acceptor dipoles, the degree of overlap between the fluorescence emission spectrum of the donor and the absorption spectrum of the acceptor, and the spatial separation between them. FRET manifests when the overlap between the emission spectrum of the donor and the absorption spectrum of the acceptor exceeds 30% and the distance is under 10 nm.97 Through monitoring alterations in the fluorescence intensity or lifetime of the donor carbon dot, one can discern the presence or concentration of the acceptor molecule, thus enabling sensitive sensing applications. FRET with carbon dots garners preference due to their adaptable fluorescence properties, robust photostability, and biocompatibility, rendering them versatile tools across diverse sensing platforms.98 As shown in Fig. 3D.4. Application
Until this point, significant endeavors have been invested in creating diverse CDs to function as efficient fluorescence probes for detecting GSH. Due to their widespread sources, minimal toxicity, excellent photoluminescence, and biocompatibility,50 CDs have garnered significant attention and found widespread use in chemical sensing applications. In this context, fluorescent CDs sensors are categorized into three types based on different sensing approaches: single probe of CDs, ratiometric probe of CDs, and visual detection of CDs.4.1 Single probe sensing
The fluorescence detection of CDs relies primarily on monitoring the variation in fluorescence intensity from a specific emission peak of an individual CD. This change occurs when exposed to a sole excitation wavelength, providing the outcome for target detection.As an example, Zhang's team successfully developed a novel fluorescence strategy for detecting GSH. The designed probe consists of boron and nitrogen doped carbon dots (B,N-CDs) and MnO2 nanosheets. In Fig. 4, it is evident that, with an increase in GSH concentration, the fluorescence of the CDs gradually intensifies. Furthermore, the determined LOD for GSH was 0.32 μM.99
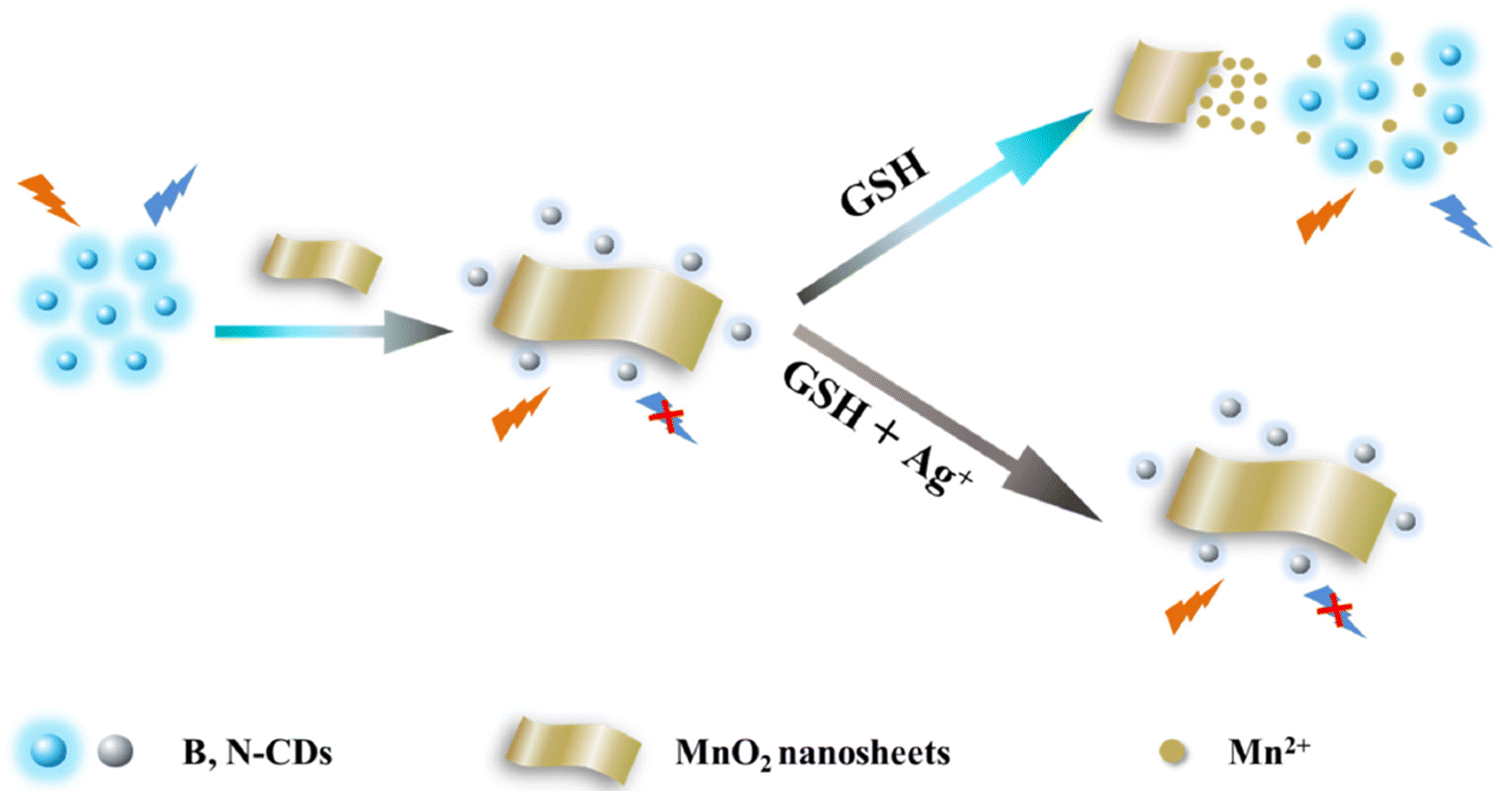 | ||
| Fig. 4 Schematic illustration of the fluorometric sensing for GSH with permission. Copyright 2021, Elsevier.99 | ||
Khan's team100 achieved the successful development of a novel carbon dots through hydrothermal synthesis, specifically creating a fluorescent CDs based sensor named GP-PEI-CDs. This sensor operates on an “on–off” FL strategy designed for detecting GSH. In Fig. 5, it is observed that the LOD for GSH was determined to be 38 nM, with a linear range spanning from 0 to 25 μM.
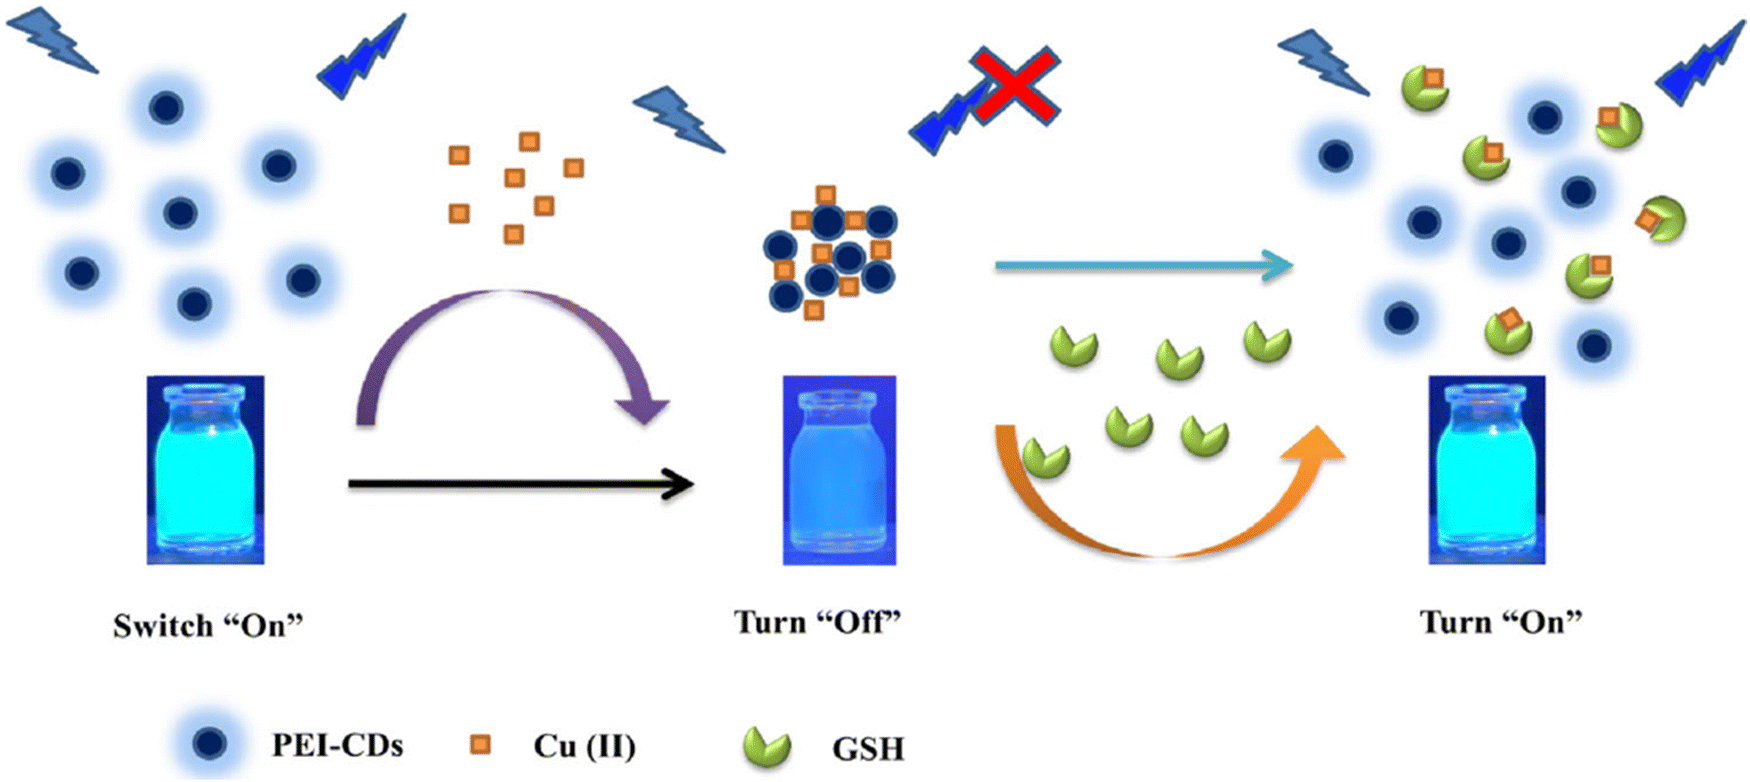 | ||
| Fig. 5 A schematic illustration for GSH with permission. Copyright 2021, Springer Nature.100 | ||
In this study, a novel NS-CQDs were successfully prepared. The fluorescence sensor exhibited quenching in the presence of Cu2+, and upon the introduction of GSH, the fluorescence sensor was restored. Moreover, this research effectively demonstrated the sensor's capability to selectively detect GSH. Specifically, the dynamic range for GSH spanned from 0.6–180.0 μM, with a noteworthy LOD of 100 nM, of significant importance, the NS-CQDs nanosensor exhibited reliable performance in monitoring GSH levels in serum.100
Furthermore, Dong and colleagues utilized a hydrothermal method to prepare N,S-CDs and gold nanoparticles. Through FRET, the resulting probe demonstrated high selectivity and a fast-responsive signal in GSH detection. The fluorescence probe for “turn-on” sensing of GSH, with a dynamic range spanning from 3.8–415.1 μM and a LOD of 210 nM. This sensor platform was effectively employed for monitoring GSH in real samples, as illustrated in Fig. 6, yielding satisfactory results.101
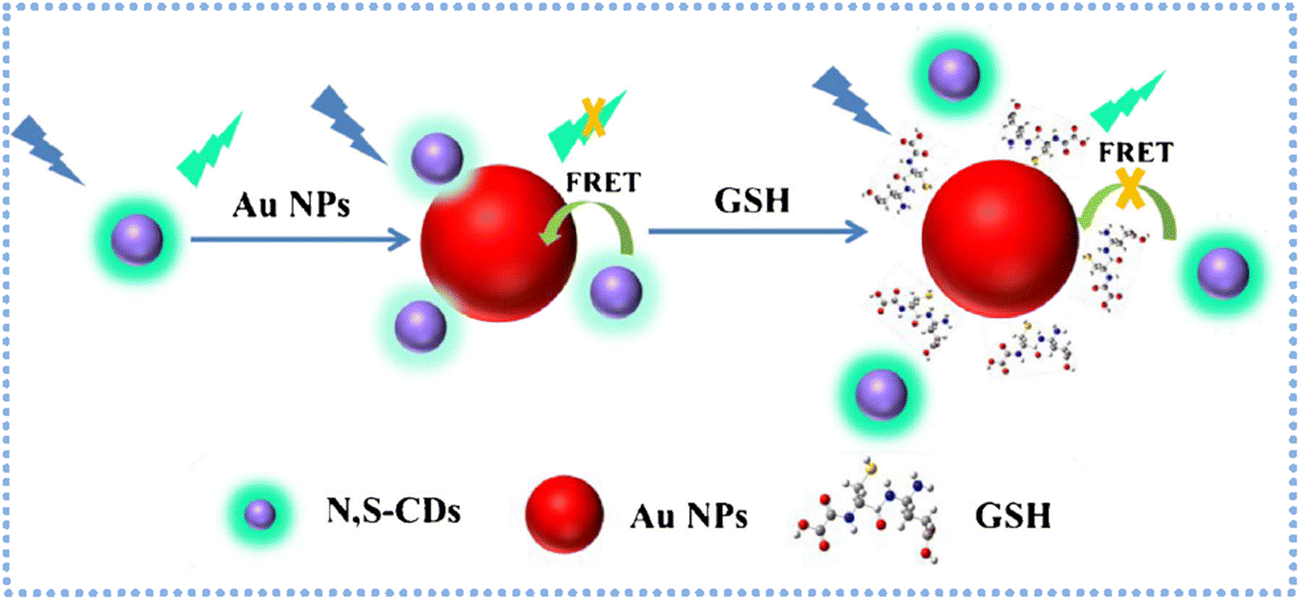 | ||
| Fig. 6 Schematic principle for the determination of GSH based on FRET of N,S-CDs and Au NPs with permission. Copyright 2019, Springer Nature.101 | ||
Bano and colleagues effectively synthesized the N,S-CQD-MnO2 nano-composite through a straightforward hydrothermal method. The detection capability of GSH in this system is noteworthy, as the MnO2 nanosheet induces a significant reduction in the blue FL emission of N,S-CQDs. The reaction system also serves as an off–on nanoprobe for GSH detection. The presence of GSH in the system restores the fluorescence emission of N,S-CQDs by eliminating the FL resonance energy transfer. Additionally, the N,S-CQD-MnO2 probe exhibits minimal cytotoxicity and excellent biocompatibility. The calculated LOD is determined to be 12 nM in a GSH dynamic range of 0.1–0.7 μM.102 As shown in Fig. 7.
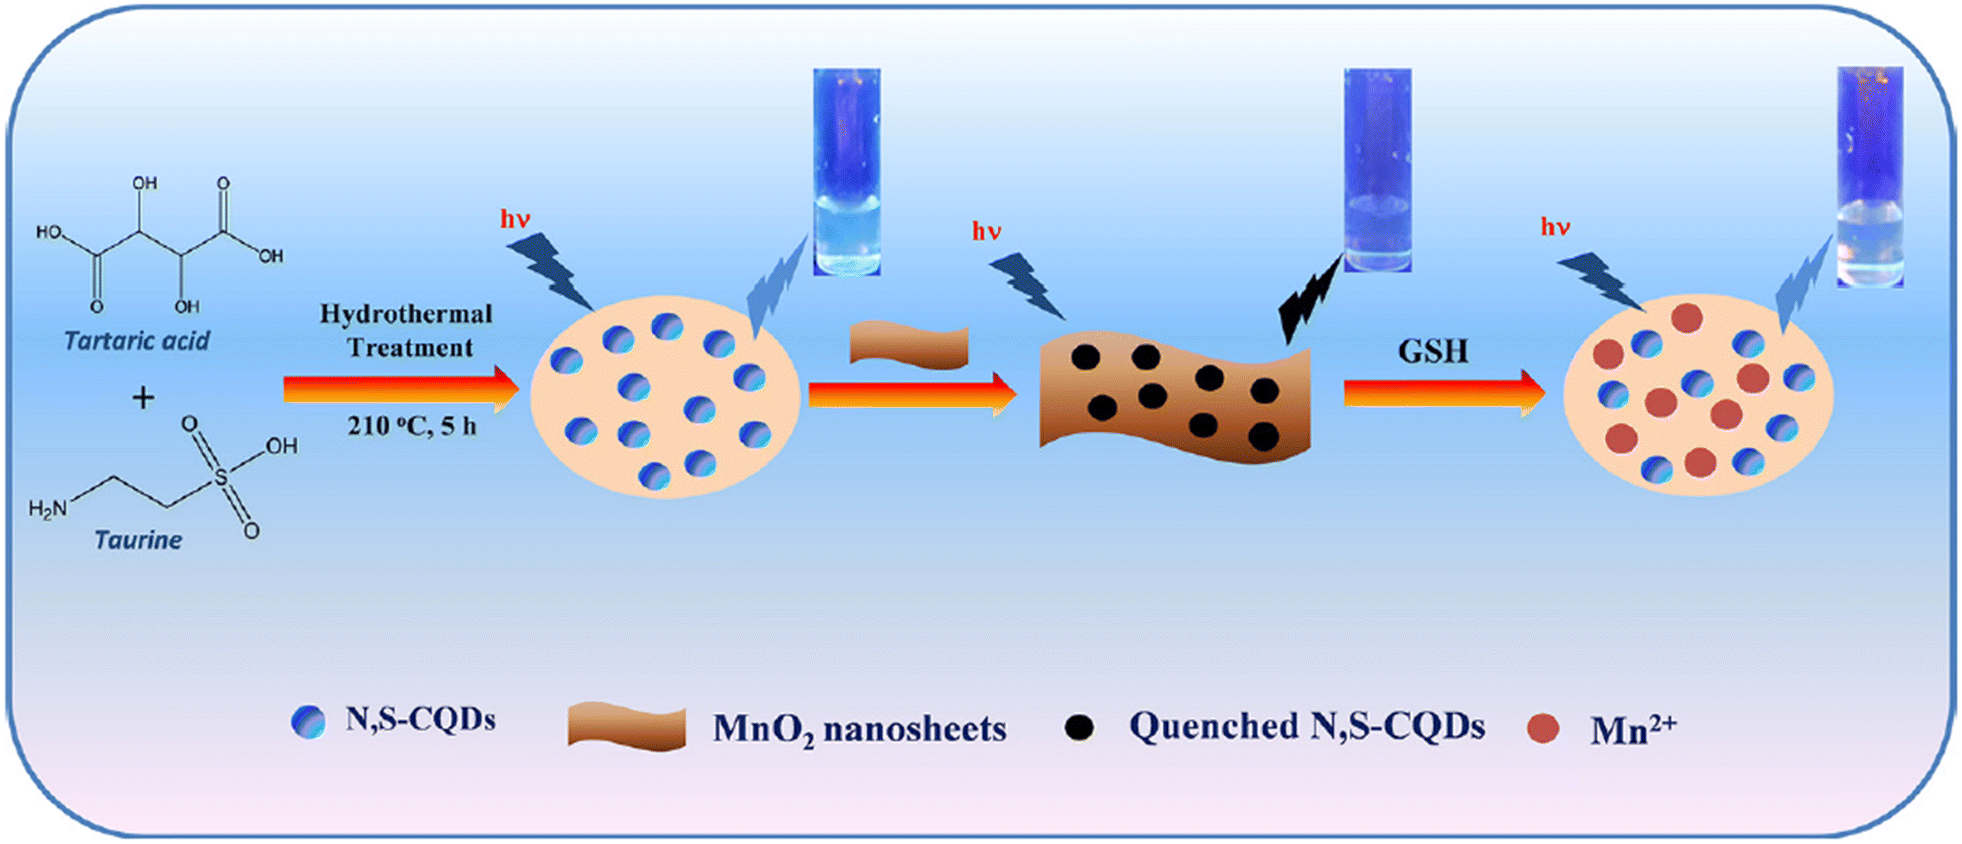 | ||
| Fig. 7 Schematic representation of designed N,S-CQD-MnO2 based nanoprobe for the ‘off–on’ detection of GSH with permission. Copyright 2019, Elsevier.102 | ||
In this section, we delve into more details about the most commonly utilized single sensing platforms based on CDs, as outlined in Table 2.
| No. | Precursors of preparation | Color | Dynamic range (μM) | LOD (nM) | Ref. |
|---|---|---|---|---|---|
| 1 | Citric acid monohydrate, L-cysteine, and L-serine | Blue | 0.01–5.0 | 3.6 | 103 |
| 3 | Citric acid and ethanediamine | Blue | 1–10 | 300 | 104 |
| 4 | Tris(hydroxymethyl)-aminomethane and dimethylformamide | Blue, green, orange, and red | 0.7–1.4, 0.4–1.1, 0.5–1.2, and 0.55–1.15 | 73 (b-CQDs), 88 (g-CQDs), 194 (o-CQDs), and 244 (r-CQDs) | 105 |
| 5 | Eggshell membrane | Blue | 50–10 | 9.8 | 106 |
| 6 | Citric acid and taurine | Blue | 0–85 | 67 | 107 |
| 7 | Grass carp | Blue | 5206.3–117100 | 2505.53 | 108 |
| 8 | Citric acid and triethylamine | Blue | 0.02–0.3 | 7.52 | 109 |
| 9 | Thylenediamine, polyethyleneimine or ethanolamine and DMF | Yellow | 1–70 | 70 | 110 |
| 10 | Starch soluble and citric acid | Green | 0.5–100 | 350 | 111 |
| 11 | (NH4)2HPO4 and citric acid monohydrate | Blue | 10–20 | 100 | 112 |
| 12 | Citric acid anhydrous and 4,7,10-trioxa-1,13-tridecanediamine | Blue | 30–400 | 460 | 113 |
| 13 | Thiomalic acid and urea | Blue | 0.1–4.0 | 59 | 114 |
| 14 | Borax and boric acid | Blue | 0.002–0.10 | 0.5 | 115 |
| 15 | Citric acid | Blue | 1.0–50 | 943 | 116 |
| 16 | Uric acid | Blue | 4–9 | 66 | 117 |
| 17 | p-Hydroxybenzoic acid | Green | 0.2–1000.0 | 30 | 118 |
| 18 | Citric acid monohydrate and diammonium hydrogen phosphate | Blue | 0.50–32 | 11.2 | 119 |
| 19 | Citric acid and ethylenediamine | Blue | 1000–100 × 103 | 500 × 103 | 120 |
| 20 | para-Phenylenediamine | Red | 12.5–800 | 700 | 121 |
| 21 | Waste corncobs | Blue | 50–150 × 103 | 8.0133 | 122 |
4.2 Ratiometric sensing
In 1993, Akkaya and colleagues introduced the concept of ratiometric sensors for detecting calcium in aqueous solutions.123 Since then, there has been a growing trend in developing ratiometric sensors across various fields such as chemistry, biology, environmental studies, and food analysis. Typically, a ratiometric fluorescent sensor consists of both a response/indicator signal and a reference signal, creating a stable measurement system through self-calibration. The incorporation of an insensitive reference signal in ratiometric fluorescent measurements helps alleviate errors caused by interferences, while still capitalizing on the high selectivity and sensitivity of luminescence techniques for analyte detection,124,125 The fluorescence intensity of the indicator signal is divided by the intensity of a spectrally distinct reference signal, with the reference signal serving as a correction factor to enhance the reliability of the detection system. This approach facilitates accurate measurements that are less susceptible to variations in uncontrolled variables.126 The construction of a novel ratiometric sensing method is promising and greatly significant for convenient detection of GSH in serum.Han et al. reported ratiometric GSH probes based on FRET, as shown in Fig. 8.127 The mechanism involved FRET between CQDs and 2,3-diaminophenazine (oxOPD). Moreover, the reaction involving the oxidation of Cu2+ and OPD could be hindered with the addition of GSH to the solution, thereby preventing the quenching of CQDs' fluorescence. The sensing system exhibited high sensitivity towards GSH within a range of 1.0–80.0 μM, with a corresponding LOD of 0.30 μM, respectively. Additionally, the proposed method could be applied to efficiently quantify GSH in samples.
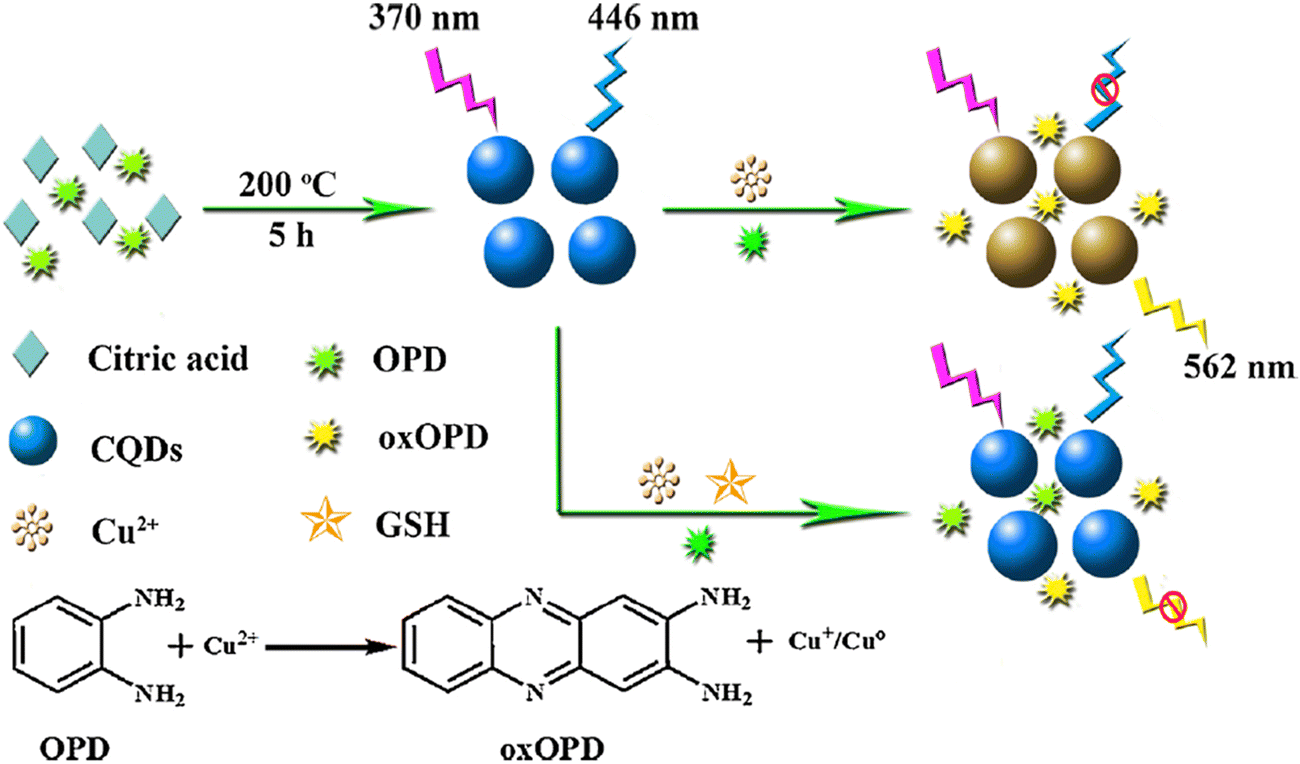 | ||
| Fig. 8 Schematic illustration of ratiometric FL probe for GSH with permission. Copyright 2019, Elsevier.127 | ||
In the conventional assay, CDs synthesized in a one-step process were employed as a ratiometric FL method for GSH detection. Varied concentrations of GSH (0–50 μM) were introduced into the CDs-RhB nanohybrid solution in the presence of 10 μM Hg2+. Subsequently, Hg2+ was eliminated from the surface of CDs, leading to a significant restoration of FL at 440 nm due to a competition mechanism as previously described. The FL intensity at 440 nm gradually recovered with increasing GSH concentrations, while the FL of RhB remained nearly constant. Consequently, a robust linear correlation between the I440/I570 ratios and the GSH concentration in the range of 0–10 μM was evident. The estimated LOD was 20 nM.128
Wang et al. also reported dual-emission carbon dots synthesized by one-pot hydrothermal method. Glutathione (GSH) can recover the fluorescence quenched by Hg2+. Therefore, the sensing system showed high sensitivity toward GSH in a range of 1.0 to 10.0 μM, with a detection limit of 270 nM, respectively.129
Alhazzani and colleagues also presented an innovative dual-emission ratiometric FL probe designed for detection of GSH. This was achieved by leveraging competitive interactions with a Ag-RF complex. The quantification of GSH levels without interference was enabled through the ratiometric measurement of FL intensities at 525 and 440 nm. This sensor exhibited excellent linearity over the range of 0.05–70 μM GSH with LOD of 15 nM. The sensor demonstrated precise analysis of GSH in serum samples with spiked concentrations (recoveries ranging from 96% to 98.5%), affirming its practical utility. Endowed with the benefits of simplicity, selectivity, and minimal sample volume needs, this fluorescent probe shows considerable potential as a tool for real-time, in-field monitoring of GSH, catering to both fundamental research and clinical investigations.130
4.3 Visual detection and portable application
Visual detection is a simple method with observable results that can be easily distinguished by the naked eye. It offers several advantages, including the use of low-cost instruments, rapid detection, user-friendly operation, minimal sample and reagent consumption, and suitability for on-site analysis,25,131 Scholars have been intrigued by visual detection for an extended period. The emergence of portable optical detection techniques for the qualitative and semi-quantitative analysis of various substances has piqued the interest of researchers across diverse fields. Visual detection enables the identification of analytes without the need for intricate external instrumentation.132 This is achieved by observing color changes during interactions with photoluminescence probes or sensors.133 Consequently, the development of sensitive and selective techniques for visually detecting GSH in serum samples is of utmost importance.A novel NCDs was synthesized using a solid-state method. The resulting NCDs in a water solution exhibit a highly selective “turn-off” FL response to Hg2+ compared to other interferences. Additionally, NCDs@Hg2+ demonstrates a remarkably selective “turn-on” FL response to the GSH as opposed to other amino acids, achieving a low LOD of 3.43 × 10³ nM. Hydrogel films incorporating NCDs and NCDs@Hg2+ enable semi-quantitative detection of Hg2+ and GSH, respectively, observable to the naked eye under UV lamp illumination. This study validates the efficacy of NCDs as a practical material for the naked-eye detection of GSH in real-world samples.134
Chu et al. introduced a portable sensing platform, comprising a ratiometric FL sensor integrated with a smartphone device, enabling sensitive, quantitative, and immediate determination of GSH levels in serum. The suppressed FL can rapidly recover upon interaction with GSH. Additionally, the red/blue values exhibited a close correlation with the GSH concentration. A strong linear relationship between the red/blue values and GSH concentration within the dynamic range of 0–50 μM was evident, as illustrated in Fig. 9. The estimated LOD was 1.84 × 10³ nM.135
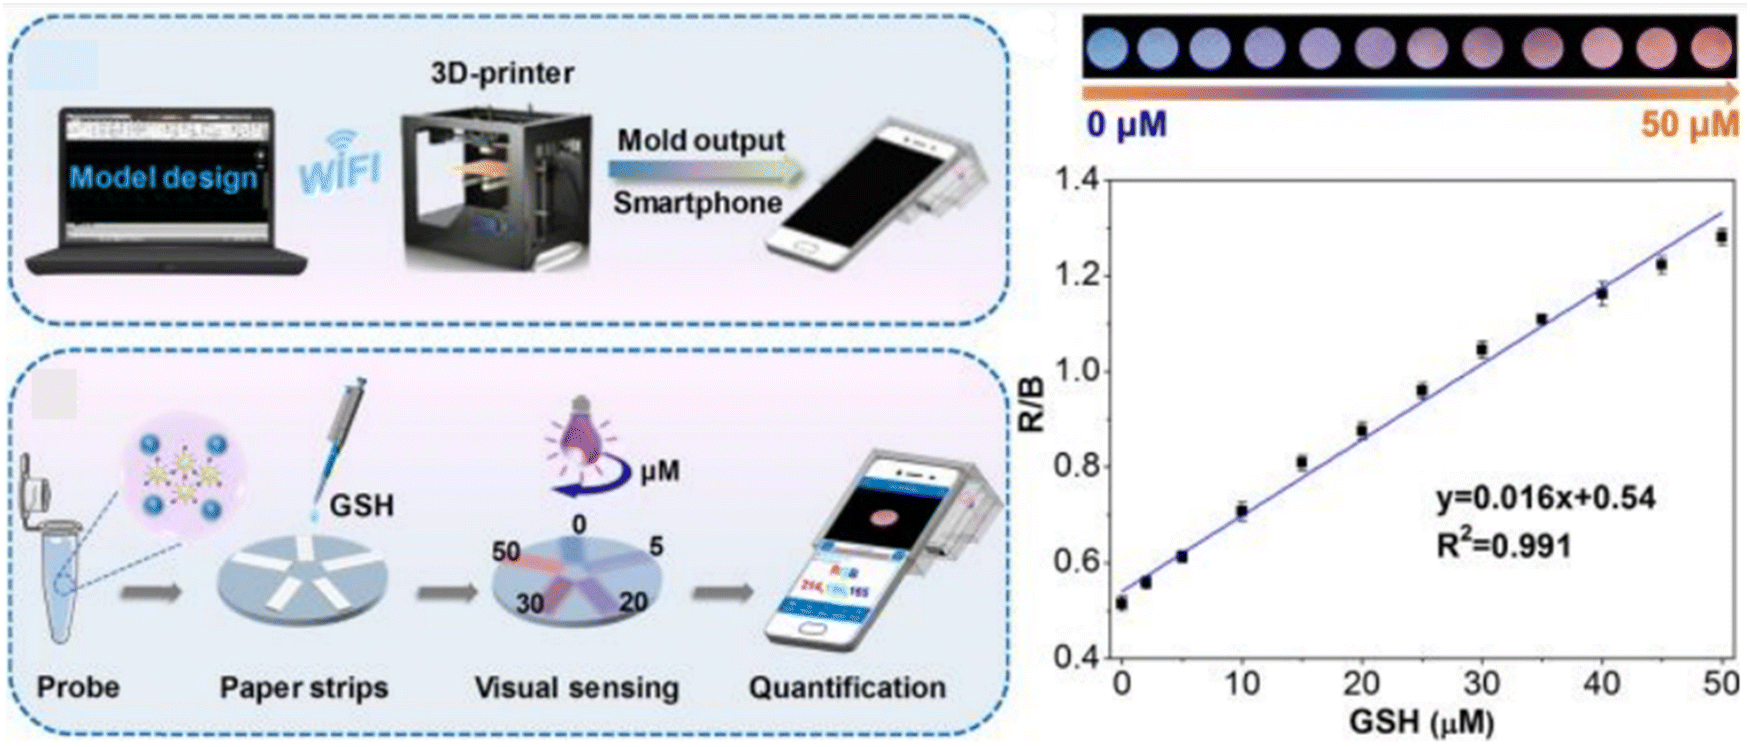 | ||
| Fig. 9 Schematic diagram of visual assay for GSH with permission. Copyright 2020, American Chemical Society.135 | ||
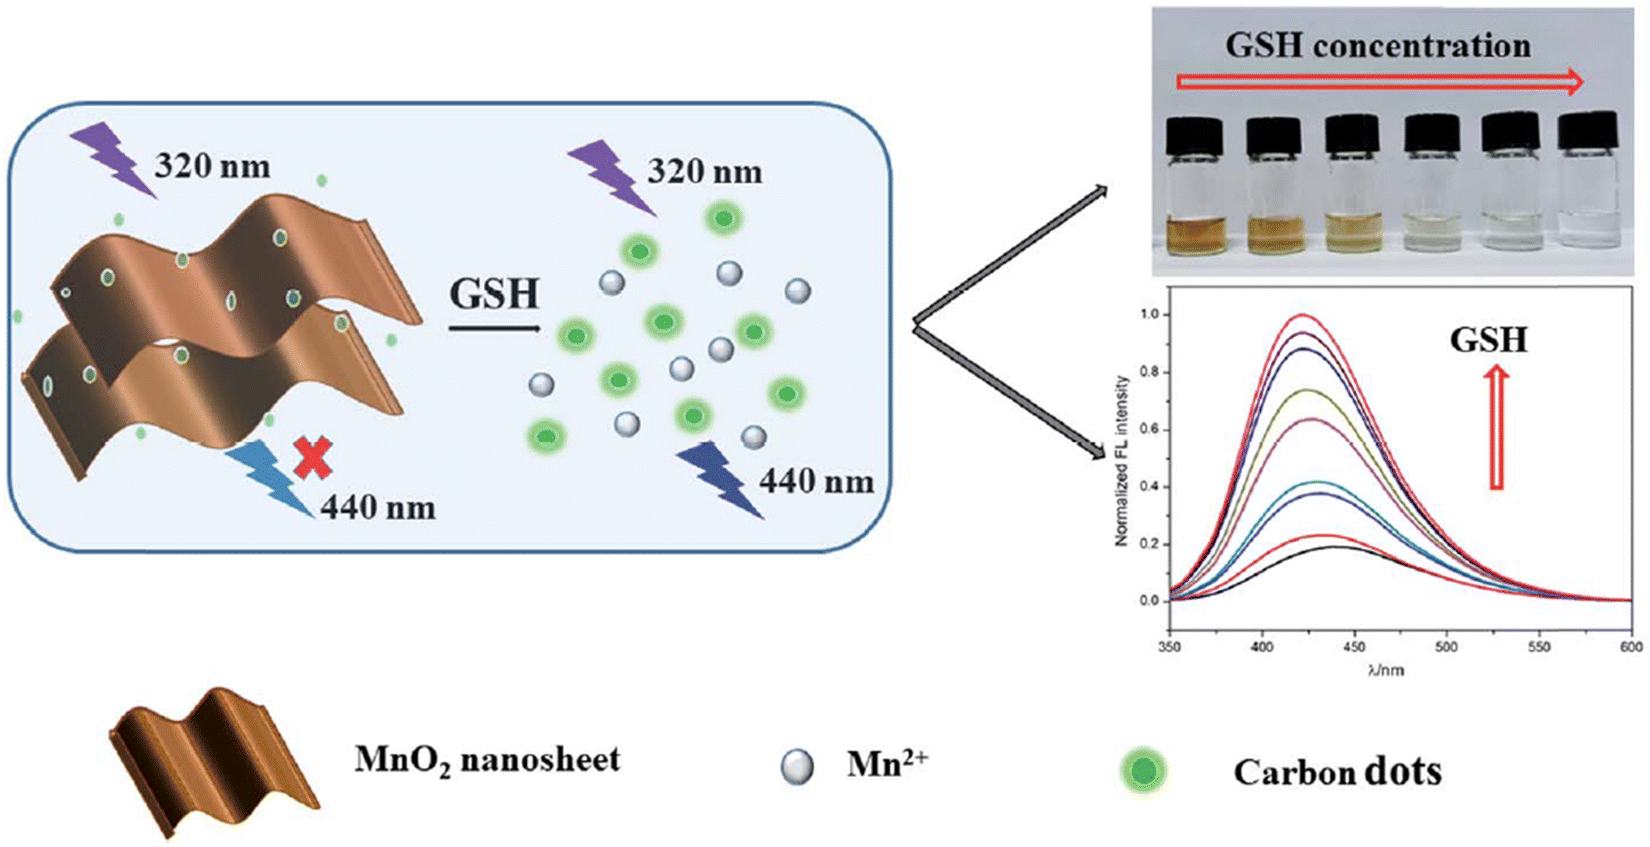
He and his colleagues devised a system using developed CDs as a fluorophore and MnO2 nanosheets as an absorber. The FL of CDs was effectively quenched by MnO2 sheets through the IFE. Serving as the analyte, GSH could reduce MnO2 sheets to Mn2+ ions, inhibiting the IFE and resulting in a fading of the solution color and the recovery of the FL signal. The results demonstrated that the proposed assay could visually distinguish 10 μM GSH and quantitatively detect GSH within the dynamic range of 0.1–400 μM. The LOD was 6.6 nM, evidenced by a color change from brown to colorless, facilitating the qualitative detection of GSH with the naked eye,112 as depicted in Fig. 10.
 | ||
| Fig. 10 Schematic illustration for GSH detection with permission. Copyright 2021, Royal Society of Chemistry.112 | ||
However, in 2021, achieving exceptional selectivity and sensitivity became possible exclusively for GSH through a sensing platform based on PDA nanoparticles and r-CPDs using a ratiometric FL approach. In this sensing system, green-emitting PDA nanoparticles served as the response signal, while r-CPDs functioned as the internal reference signal. Upon the addition of GSH, the green fluorescence of PDA nanoparticles decreased, while the red FL of the system remained relatively stable. This innovation established a detection threshold of 470 nM with a dynamic range of 1–100 μM.136 These findings are visually depicted in Fig. 11.
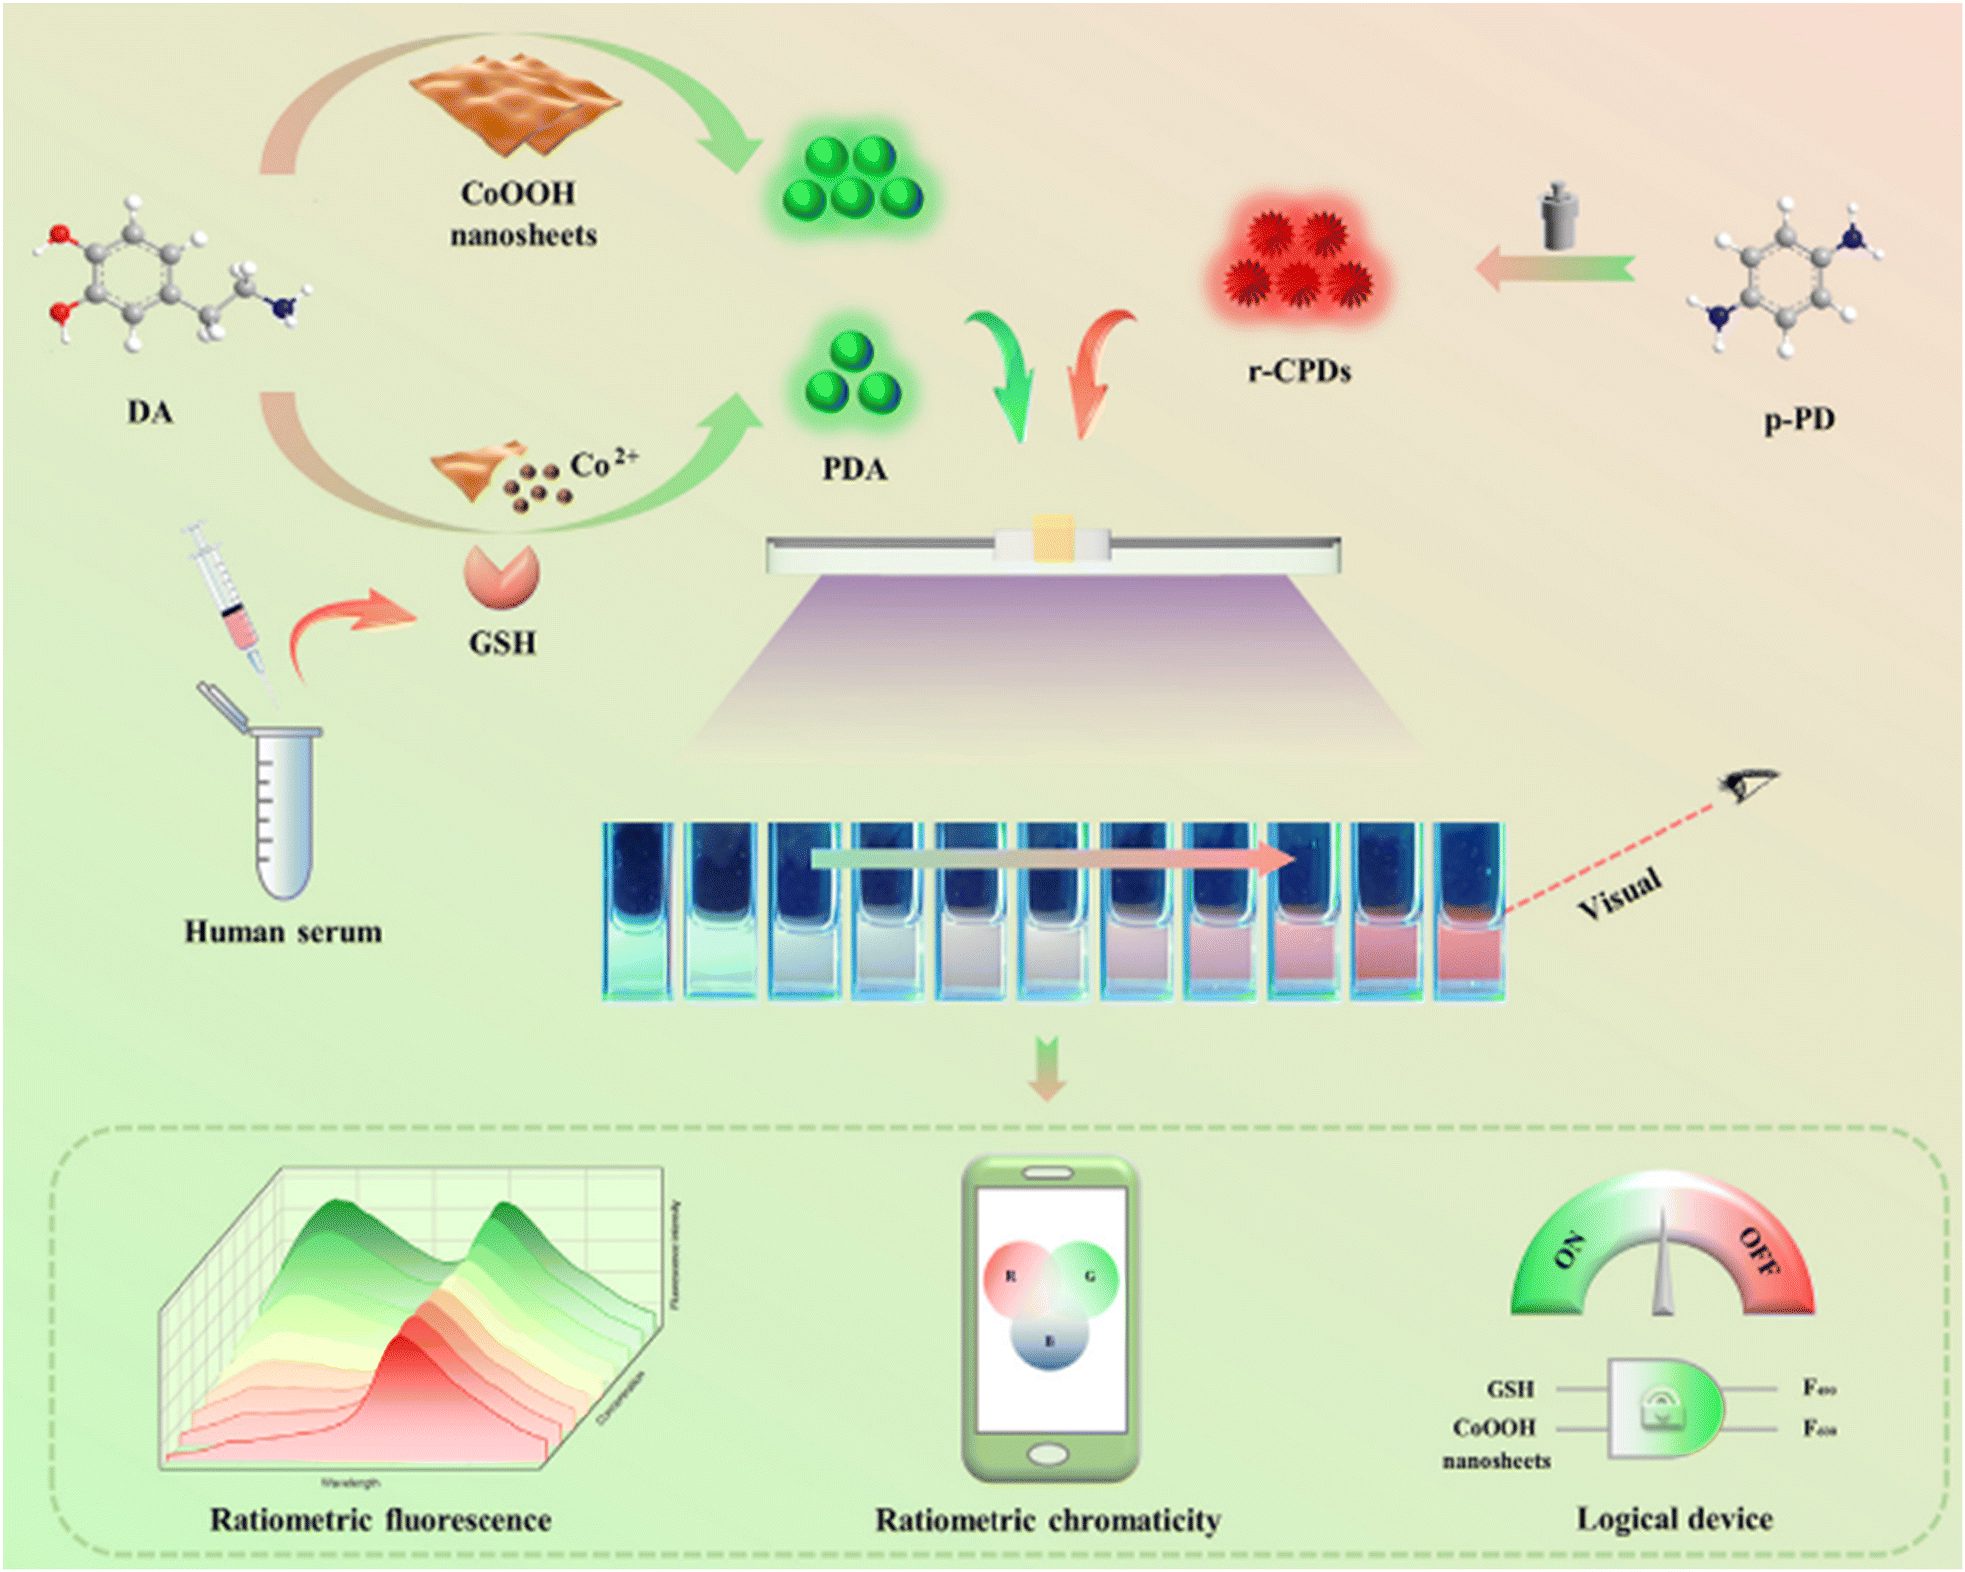 | ||
| Fig. 11 Schematic diagram for the visual detection of GSH with permission. Copyright 2021, Elsevier.136 | ||
5. Conclusions and prospects
Carbon dots, renowned for their outstanding PL and biocompatibility, have undergone extensive exploration as potential fluorescent probes for the swift and accurate detection of GSH. Consequently, As a result, we have gathered and emphasized reliable approaches for the effective synthesis of CDs and highlighted significant achievements in various sensing methods utilizing CDs for GSH detection. Despite notable progress, there are still several deficiencies and challenges that must be addressed.The integration of diverse techniques renders CDs more adaptable in detection research. A significant step forward would involve combining CDs with FL immunoassay techniques, and molecular imprinting techniques to formulate efficient CDs with enhanced selectivity and sensitivity. Moreover, the practical utility of CDs should not be overlooked. Presently, the GSH detection using most CD probes remains confined to the laboratory settings. There is an urgent need to transition this technology for real-time detection and to devise simpler and faster detection reagents.
In summary, CD fluorescent probes have demonstrated promise in GSH detection; however, there is a need for continued efforts to explore innovative and dependable CDs to further improve detection efficiency. We expect that this review will stimulate increased interest to the preparation and optimization of CDs, with their widespread application in GSH detection flourishing in the near future.
List of abbreviations
| CDs | Carbon dots |
| COL | Colorimetry |
| EC | Electrochemistry |
| HPLC | High performance liquid chromatography |
| SERS | Surface-enhanced Raman scattering |
| MRI | Magnetic resonance imaging |
| ECL | Electrochemiluminescence |
| FL | Fluorescence |
| SWCNs | Single-walled carbon nanotubes |
| NS-CQDs | Nitrogen and sulfur co-doped carbon quantum dots |
| Au NPs | Gold nanoparticles |
| FRET | Through Förster resonance energy transfer |
| NCDs | Nitrogen-doped carbon dots |
| PL | Photoluminescence |
| PDA | Polydopamine |
| r-CPDs | Red-carbonized polymer dots |
| Ag-RF | Silver-riboflavin |
| CNT | Carbon nanotube |
Conflicts of interest
There are no conflicts to declare.Acknowledgements
We extend our deepest appreciation to the Department of Chemistry, College of Science, at the University of Sulaimani and Charmo University for providing the necessary resources and facilities for conducting this research.References
- Y. Li, G. Wei and J. Chen, Glutathione: A review on biotechnological production, Appl. Microbiol. Biotechnol., 2004, 66(3), 233–242, DOI:10.1007/s00253-004-1751-y.
- X. Liu, Q. Wang, Y. Zhang, L. Zhang, Y. Su and Y. Lv, Colorimetric detection of glutathione in human blood serum based on the reduction of oxidized TMB, New J. Chem., 2013, 37(7), 2174–2178, 10.1039/c3nj40897c.
- D. Ścibior, M. Skrzycki, M. Podsiad and H. Czeczot, Glutathione level and glutathione-dependent enzyme activities in blood serum of patients with gastrointestinal tract tumors, Clin. Biochem., 2008, 41(10–11), 852–858, DOI:10.1016/j.clinbiochem.2008.03.005.
- Z. M. Huang, et al., A facile label-free colorimetric method for highly sensitive glutathione detection by using manganese dioxide nanosheets, Sens. Actuators, B, 2017, 242, 355–361, DOI:10.1016/j.snb.2016.11.066.
- P. Ni, et al., Highly sensitive and selective colorimetric detection of glutathione based on Ag [I] ion-3,3’,5,5’-tetramethylbenzidine (TMB), Biosens. Bioelectron., 2015, 63, 47–52, DOI:10.1016/j.bios.2014.07.021.
- D. He, et al., Redox-responsive degradable honeycomb manganese oxide nanostructures as effective nanocarriers for intracellular glutathione-triggered drug release, Chem. Commun., 2015, 51(4), 776–779, 10.1039/c4cc08172b.
- M. Hanko, Ľ. Švorc, A. Planková and P. Mikuš, Overview and recent advances in electrochemical sensing of glutathione – A review, Anal. Chim. Acta, 2019, 1062, 1–27, DOI:10.1016/j.aca.2019.02.052.
- V. K. Singh, P. K. Yadav, S. Chandra, D. Bano, M. Talat and S. H. Hasan, Peroxidase mimetic activity of fluorescent NS-carbon quantum dots and their application in colorimetric detection of H2O2 and glutathione in human blood serum, J. Mater. Chem. B, 2018, 6(32), 5256–5268, 10.1039/c8tb01286e.
- H. A. Petersen, T. H. T. Myren, S. J. O’Sullivan and O. R. Luca, Electrochemical methods for materials recycling, Mater. Adv., 2021, 2(4), 1113–1138, 10.1039/d0ma00689k.
- J. C. Harfield, C. Batchelor-Mcauley and R. G. Compton, Electrochemical determination of glutathione: A review, Analyst, 2012, 137(10), 2285–2296, 10.1039/c2an35090d.
- S. Dey, et al., Bio-inspired perylene diimide coated super paramagnetic nanoparticles for the effective and efficient removal of lead(ii) from aqueous medium, Mater. Adv., 2020, 1(6), 1817–1828, 10.1039/d0ma00477d.
- S. Childs, N. Haroune, L. Williams and M. Gronow, Determination of cellular glutathione: GLutathione disulfide ratio in prostate cancer cells by high performance liquid chromatography with electrochemical detection, J. Chromatogr. A, 2016, 1437, 67–73, DOI:10.1016/j.chroma.2016.01.050.
- A. Saha and N. R. Jana, Detection of cellular glutathione and oxidized glutathione using magnetic-plasmonic nanocomposite-based ‘turn-Off’ surface enhanced Raman scattering, Anal. Chem., 2013, 85(19), 9221–9228, DOI:10.1021/ac4019457.
- M. Nanosheet, et al., Activatable Fluorescence/MRI Bimodal Platform for Tumor Cell, J. Am. Chem. Soc., 2014, 136, 11220–11223 CrossRef PubMed.
- T. Han, et al., Boosted anodic electrochemiluminescence from blue-emissive sulfur quantum dots and its bioanalysis of glutathione, Electrochim. Acta, 2021, 381, 138281, DOI:10.1016/j.electacta.2021.138281.
- J. Liu, L. Meng, Z. Fei, P. J. Dyson, X. Jing and X. Liu, MnO2 nanosheets as an artificial enzyme to mimic oxidase for rapid and sensitive detection of glutathione, Biosens. Bioelectron., 2017, 90, 69–74, DOI:10.1016/j.bios.2016.11.046.
- K. F. Kayani and C. N. Abdullah, A Dual-Mode Detection Sensor Based on Nitrogen-Doped Carbon Dots for Visual Detection of Fe(III) and Ascorbic Acid via a Smartphone, J. Fluoresc., 2024 DOI:10.1007/s10895-024-03604-0.
- H. Li, et al., Design and applications of a novel fluorescent probe for detecting glutathione in biological samples, Anal. Chim. Acta, 2020, 1117, 18–24, DOI:10.1016/j.aca.2020.03.040.
- Z. Liu, et al., A Reversible Fluorescent Probe for Real-Time Quantitative Monitoring of Cellular Glutathione, Angew. Chem., 2017, 129(21), 5906–5910, DOI:10.1002/ange.201702114.
- S. Jayaweera, K. Yin, X. Hu and W. J. Ng, Facile preparation of fluorescent carbon dots for label-free detection of Fe3+, J. Photochem. Photobiol., A, 2019, 370, 156–163, DOI:10.1016/j.jphotochem.2018.10.052.
- X. Fang, Y. Zheng, Y. Duan, Y. Liu and W. Zhong, Recent Advances in Design of Fluorescence-Based Assays for High-Throughput Screening, Anal. Chem., 2019, 91(1), 482–504, DOI:10.1021/acs.analchem.8b05303.
- O. B. A. Shatery, K. F. Kayani, M. S. Mustafa and S. J. Mohammed, Rational design for enhancing sensitivity and robustness of a probe via encapsulation of carbon dots into a zeolitic imidazolate framework-8 for quantification of tetracycline in milk with greenness evaluation, Res. Chem. Intermed., 2024 DOI:10.1007/s11164-024-05271-z.
- J. E. Ellis, S. E. Crawford and K. J. Kim, Metal-organic framework thin films as versatile chemical sensing materials, Mater. Adv, 2021, 2(19), 6169–6196, 10.1039/d1ma00535a.
- P. Kumar, K. Vellingiri, K. H. Kim, R. J. C. Brown and M. J. Manos, Modern progress in metal-organic frameworks and their composites for diverse applications, Microporous Mesoporous Mater., 2017, 253, 251–265, DOI:10.1016/j.micromeso.2017.07.003.
- K. F. Kayani and K. M. Omer, A red luminescent europium metal organic framework (Eu-MOF) integrated with a paper strip using smartphone visual detection for determination of folic acid in pharmaceutical, New J. Chem., 2022, 46, 8152–8161, 10.1039/d2nj00601d.
- V. Singh, Priyanka, P. V. More, E. Hemmer, Y. K. Mishra and P. K. Khanna, Magic-sized CdSe nanoclusters: A review on synthesis, properties and white light potential, Mater. Adv., 2021, 2(4), 1204–1228, 10.1039/d0ma00921k.
- X. Fei and Y. Gu, Progress in modifications and applications of fluorescent dye probe, Prog. Nat. Sci., 2009, 19(1), 1–7, DOI:10.1016/j.pnsc.2008.06.004.
- S. Ashok Kumar, M. Dheeraj Kumar, M. Saikia, N. Renuga Devi and A. Subramania, A review on plant derived carbon quantum dots for bio-imaging, Mater. Adv., 2023, 4(18), 3951–3966, 10.1039/d3ma00254c.
- S. Tang, et al., A fluorescence inner-filter effect based sensing platform for turn-on detection of glutathione in human serum, Sensors, 2019, 19(2), 1–12, DOI:10.3390/s19020228.
- J. Wang, Y. Yang and X. Liu, Solid-state fluorescent carbon dots: Quenching resistance strategies, high quantum efficiency control, multicolor tuning, and applications, Mater. Adv., 2020, 1(9), 3122–3142, 10.1039/d0ma00632g.
- A. Pal, M. P. Sk and A. Chattopadhyay, Recent advances in crystalline carbon dots for superior application potential, Mater. Adv., 2020, 1(4), 525–553, 10.1039/d0ma00108b.
- O. B. A. Shatery, K. F. Kayani and M. S. Mustafa, Rational design for enhancing sensitivity and robustness of a probe via encapsulation of carbon dots into a zeolitic imidazolate framework – 8 for quantification of tetracycline, Res. Chem. Intermed., 2024, 1–16, DOI:10.1007/s11164-024-05271-z.
- K. F. Kayani, O. B. A. Shatery, M. S. Mustafa, A. H. Alshatteri, S. J. M. De and S. B. Aziz, Environmentally sustainable synthesis of whey- based carbon dots for ferric ion detection in human serum and water samples: evaluating the greenness of the method, RSC Adv., 2024, 14, 5012–5021, 10.1039/d3ra08680a.
- L. Shen, M. Chen, L. Hu, X. Chen and J. Wang, Growth and stabilization of silver nanoparticles on carbon dots and sensing application, Langmuir, 2013, 29(52), 16135–16140, DOI:10.1021/la404270w.
- S. J. Mohammed, K. M. Omer and F. E. Hawaiz, Deep insights to explain the mechanism of carbon dot formation at various reaction times using the hydrothermal technique: FT-IR, 13C-NMR, 1H-NMR, and UV-visible spectroscopic approaches, RSC Adv., 2023, 13(21), 14340–14349, 10.1039/d3ra01646c.
- M. Li, T. Chen, J. J. Gooding and J. Liu, Review of carbon and graphene quantum dots for sensing, ACS Sens., 2019, 4(7), 1732–1748, DOI:10.1021/acssensors.9b00514.
- S. K. Tammina, D. Yang, X. Li, S. Koppala and Y. Yang, High photoluminescent nitrogen and zinc doped carbon dots for sensing Fe3+ ions and temperature, Spectrochim. Acta, Part A, 2019, 222, 117141, DOI:10.1016/j.saa.2019.117141.
- H. Li, et al., Recent advances in carbon dots for bioimaging applications, Nanoscale Horiz., 2020, 5(2), 218–234, 10.1039/c9nh00476a.
- Y. Shen, et al., Engineering of a Dual-Recognition Ratiometric Fluorescent Nanosensor with a Remarkably Large Stokes Shift for Accurate Tracking of Pathogenic Bacteria at the Single-Cell Level, Anal. Chem., 2020, 92(19), 13396–13404, DOI:10.1021/acs.analchem.0c02762.
- X. Gao, H. Chen, H. Qiu, Y. Zhang, J. Cheng and Y. Shen, Portable hydrogel kit driven by bimetallic carbon dots nanozyme for H2O2-self-supplying dual-modal monitoring of atmospheric CH3SH, J. Hazard. Mater., 2024, 469, 133871, DOI:10.1016/j.jhazmat.2024.133871.
- T. Pan, H. Chen, X. Gao, Z. Wu, Y. Ye and Y. Shen, Engineering efficient artificial nanozyme based on chitosan grafted Fe-doped-carbon dots for bacteria biofilm eradication, J. Hazard. Mater., 2022, 435, 128996, DOI:10.1016/j.jhazmat.2022.128996.
- Y. Shen, T. Wu, H. Chen, Y. Ye and J. J. Xu, Ratiometric fluorescence detection of pathogenic bacteria based on dual-recognition nanoprobes with controllable G-quadruplex release, Chem. Commun., 2022, 58(3), 447–450, 10.1039/d1cc05966a.
- S. L. Zhang, et al., Nucleolin-targeted ratiometric fluorescent carbon dots with a remarkably large emission wavelength shift for precise imaging of cathepsin B in living cancer cells, Anal. Chem., 2021, 93(8), 4042–4050, DOI:10.1021/acs.analchem.0c05046.
- S. J. Mohammed, F. E. Hawaiz, S. B. Aziz and S. H. Al-Jaf, Organic soluble nitrogen-doped carbon dots (ONCDs) to reduce the optical band gap of PVC polymer: Breakthrough in polymer composites with improved optical properties, Opt. Mater., 2024, 149, 1–16, DOI:10.1016/j.optmat.2024.115014.
- J. Jana, M. Ganguly, B. Das, S. Dhara, Y. Negishi and T. Pal, One pot synthesis of intriguing fluorescent carbon dots for sensing and live cell imaging, Talanta, 2016, 150, 253–264, DOI:10.1016/j.talanta.2015.12.047.
- X. Lin, et al., Carbon dots based on natural resources: Synthesis and applications in sensors, Microchem. J., 2021, 160, 105604, DOI:10.1016/j.microc.2020.105604.
- X. Wang, et al., Bandgap-like strong fluorescence in functionalized carbon nanoparticles, Angew. Chem., Int. Ed., 2010, 49(31), 5310–5314, DOI:10.1002/anie.201000982.
- X. Li, S. Zhang, S. A. Kulinich, Y. Liu and H. Zeng, Engineering surface states of carbon dots to achieve controllable luminescence for solid-luminescent composites and sensitive Be2+ detection, Sci. Rep., 2014, 4, 1–8, DOI:10.1038/srep04976.
- X. Xu, et al., Electrophoretic analysis and purification of fluorescent single-walled carbon nanotube fragments, J. Am. Chem. Soc., 2004, 126(40), 12736–12737, DOI:10.1021/ja040082h.
- K. F. Kayani, M. K. Rahim, S. J. Mohammed, H. R. Ahmed, M. S. Mustafa and S. B. Aziz, Recent Progress in Folic Acid Detection Based on Fluorescent Carbon Dots as Sensors: A Review, J. Fluoresc., 2024 DOI:10.1007/s10895-024-03728-3.
- X. Sun and Y. Lei, Fluorescent carbon dots and their sensing applications, TrAC – Trends Anal. Chem., 2017, 89, 163–180, DOI:10.1016/j.trac.2017.02.001.
- D. Ozyurt, M. Al Kobaisi, R. K. Hocking and B. Fox, Properties, synthesis, and applications of carbon dots: A review, Carbon Trends, 2023, 12, 100276, DOI:10.1016/j.cartre.2023.100276.
- Y. Wang and A. Hu, Carbon quantum dots: Synthesis, properties and applications, J. Mater. Chem. C, 2014, 2(34), 6921–6939, 10.1039/c4tc00988f.
- X. Sun, F. Guo, Q. Ye, J. Zhou, J. Han and R. Guo, Fluorescent Sensing of Glutathione and Related Bio-Applications, Biosensors, 2023, 13(1), 1–19, DOI:10.3390/bios13010016.
- H. Liu, et al., A review of carbon dots in synthesis strategy, Coord. Chem. Rev., 2024, 498, 215468, DOI:10.1016/j.ccr.2023.215468.
- A. Khayal, et al., Advances in the methods for the synthesis of carbon dots and their emerging applications, Polymers, 2021, 13(18), 1–31, DOI:10.3390/polym13183190.
- M. Kurian and A. Paul, Recent trends in the use of green sources for carbon dot synthesis–A short review, Carbon Trends, 2021, 3, 100032, DOI:10.1016/j.cartre.2021.100032.
- M. L. Liu, B. Bin Chen, C. M. Li and C. Z. Huang, Carbon dots prepared for fluorescence and chemiluminescence sensing, Sci. China Chem., 2019, 62(8), 968–981, DOI:10.1007/s11426-019-9449-y.
- M. Jorns and D. Pappas, A Review of Fluorescent Carbon Dots, Their Synthesis, Physical and Chemical Characteristics, and Applications, 2021 Search PubMed.
- Z. L. Wu, Z. X. Liu and Y. H. Yuan, Carbon dots: Materials, synthesis, properties and approaches to long-wavelength and multicolor emission, J. Mater. Chem. B, 2017, 5(21), 3794–3809, 10.1039/c7tb00363c.
- F. Wang, M. Kreiter, B. He, S. Pang and C. Y. Liu, Synthesis of direct white-light emitting carbogenic quantum dots, Chem. Commun., 2010, 46(19), 3309–3311, 10.1039/c002206c.
- I. Y. Goryacheva, A. V. Sapelkin and G. B. Sukhorukov, Carbon nanodots: Mechanisms of photoluminescence and principles of application, TrAC – Trends Anal. Chem., 2017, 90, 27–37, DOI:10.1016/j.trac.2017.02.012.
- D. M. A. Crista, J. C. G. E. da Silva and L. P. da Silva, Evaluation of different bottom-up routes for the fabrication of carbon dots, Nanomaterials, 2020, 10(7), 1–15, DOI:10.3390/nano10071316.
- T. J. Pillar-Little, N. Wanninayake, L. Nease, D. K. Heidary, E. C. Glazer and D. Y. Kim, Superior photodynamic effect of carbon quantum dots through both type I and type II pathways: Detailed comparison study of top-down-synthesized and bottom-up-synthesized carbon quantum dots, Carbon, 2018, 140, 616–623, DOI:10.1016/j.carbon.2018.09.004.
- K. W. Chu, S. L. Lee, C. J. Chang and L. Liu, Recent progress of carbon dot precursors and photocatalysis applications, Polymers, 2019, 11(4), 1–32, DOI:10.3390/polym11040689.
- M. K. Barman and A. Patra, Current status and prospects on chemical structure driven photoluminescence behaviour of carbon dots, J. Photochem. Photobiol., C, 2018, 37, 1–22, DOI:10.1016/j.jphotochemrev.2018.08.001.
- M. Tuerhong, Y. Xu and X. B. Yin, Review on Carbon Dots and Their Applications, Chin. J. Anal. Chem., 2017, 45(1), 139–150, DOI:10.1016/S1872-2040(16)60990-8.
- I. A. Wani, A. Ganguly, J. Ahmed and T. Ahmad, Silver nanoparticles: Ultrasonic wave assisted synthesis, optical characterization and surface area studies, Mater. Lett., 2011, 65(3), 520–522, DOI:10.1016/j.matlet.2010.11.003.
- L. Shi, et al., Carbon dots with high fluorescence quantum yield: The fluorescence originates from organic fluorophores, Nanoscale, 2016, 8(30), 14374–14378, 10.1039/c6nr00451b.
- H. Li, et al., One-step ultrasonic synthesis of water-soluble carbon nanoparticles with excellent photoluminescent properties, Carbon, 2011, 49(2), 605–609, DOI:10.1016/j.carbon.2010.10.004.
- Y. Zheng, X. Dou, H. Li and J. M. Lin, Bisulfite induced chemiluminescence of g-C3N4 nanosheets and enhanced by metal ions, Nanoscale, 2016, 8(9), 4933–4937, 10.1039/c5nr08943c.
- O. S. Wolfbeis, An overview of nanoparticles commonly used in fluorescent bioimaging, Chem. Soc. Rev., 2015, 44(14), 4743–4768, 10.1039/c4cs00392f.
- A. Abi, G. Kazemi and A. Safavi, A carbon dot-based fluorescence method for selective quantification of sulfide in environmental samples, Sens. Actuators, B, 2018, 277, 1–7, DOI:10.1016/j.snb.2018.08.150.
- N. Biazar, R. Poursalehi and H. Delavari, Optical and structural properties of carbon dots/TiO2 nanostructures prepared via DC arc discharge in liquid, AIP Conf. Proc., 2018, 1920, 1–5, DOI:10.1063/1.5018965.
- H. G. Ye, et al., Mild bottom-up synthesis of carbon dots with temperature-dependent fluorescence, J. Lumin., 2021, 238, 118311, DOI:10.1016/j.jlumin.2021.118311.
- D. Huang, et al., Bottom-up synthesis and structural design strategy for graphene quantum dots with tunable emission to near infrared region, Carbon, 2019, 142, 673–684, DOI:10.1016/j.carbon.2018.10.047.
- E. Dervishi, Z. Ji, H. Htoon, M. Sykora and S. K. Doorn, Raman spectroscopy of bottom-up synthesized graphene quantum dots: Size and structure dependence, Nanoscale, 2019, 11(35), 16571–16581, 10.1039/c9nr05345j.
- Y. Choi, Y. Choi, O. H. Kwon and B. S. Kim, Carbon Dots: Bottom-Up Syntheses, Properties, and Light-Harvesting Applications, Chem. – Asian J., 2018, 13(6), 586–598, DOI:10.1002/asia.201701736.
- S. Zhu, X. Zhao, Y. Song, S. Lu and B. Yang, Beyond bottom-up carbon nanodots: Citric-acid derived organic molecules, Nano Today, 2016, 11(2), 128–132, DOI:10.1016/j.nantod.2015.09.002.
- K. Byrappa and T. Adschiri, Hydrothermal technology for nanotechnology, Prog. Cryst. Growth Charact. Mater., 2007, 53(2), 117–166, DOI:10.1016/j.pcrysgrow.2007.04.001.
- A. Sekar, R. Yadav and N. Basavaraj, Fluorescence quenching mechanism and the application of green carbon nanodots in the detection of heavy metal ions: a review, New J. Chem., 2021, 45(5), 2326–2360, 10.1039/d0nj04878j.
- J. Park, P. Bazylewski, V. Wong, H. Shah and G. Fanchini, Solvent-free growth of carbon dots by sputter-plasma assisted chemical vapour deposition over large areas, Carbon, 2019, 146, 28–35, DOI:10.1016/j.carbon.2019.01.086.
- M. J. Molaei, Principles, mechanisms, and application of carbon quantum dots in sensors: A review, Anal. Methods, 2020, 12(10), 1266–1287, 10.1039/c9ay02696g.
- J. Zhou, Z. Sheng, H. Han, M. Zou and C. Li, Facile synthesis of fluorescent carbon dots using watermelon peel as a carbon source, Mater. Lett., 2012, 66(1), 222–224, DOI:10.1016/j.matlet.2011.08.081.
- Y. Xu, et al., Chip-based generation of carbon nanodots via electrochemical oxidation of screen printed carbon electrodes and the applications for efficient cell imaging and electrochemiluminescence enhancement, Nanoscale, 2015, 7(21), 9421–9426, 10.1039/c5nr01765c.
- Y. Hu, et al., One-pot pyrolysis preparation of carbon dots as eco-friendly nanoadditives of water-based lubricants, Carbon, 2019, 152, 511–520, DOI:10.1016/j.carbon.2019.06.047.
- C. Ma, C. Yin, Y. Fan, X. Yang and X. Zhou, Highly efficient synthesis of N-doped carbon dots with excellent stability through pyrolysis method, J. Mater. Sci., 2019, 54(13), 9372–9384, DOI:10.1007/s10853-019-03585-7.
- X. W. Tan, A. N. B. Romainor, S. F. Chin and S. M. Ng, Carbon dots production via pyrolysis of sago waste as potential probe for metal ions sensing, J. Anal. Appl. Pyrolysis, 2014, 105, 157–165, DOI:10.1016/j.jaap.2013.11.001.
- W. Kong, D. Wu, G. Li, L. Xia, J. You and Y. Wu, A facile carbon dots based fluorescent probe for ultrasensitive detection of ascorbic acid in biological fluids via non-oxidation reduction strategy, Talanta, 2017, 165, 677–684, DOI:10.1016/j.talanta.2017.01.022.
- X. Dou, Y. Zheng, K. Uchiyama and J. Lin, Fluorescent carbon nanoparticles: in a chemiluminescence system, Chem. Commun., 2016, 12(l), 14137–14140, 10.1039/c6cc07285b.
- J. Hu, Y. Sun, A. A. Aryee, L. Qu, K. Zhang and Z. Li, Mechanisms for carbon dots-based chemosensing, biosensing, and bioimaging: A review, Anal. Chim. Acta, 2022, 1209, 338885, DOI:10.1016/j.aca.2021.338885.
- F. Zu, et al., The quenching of the fluorescence of carbon dots: A review on mechanisms and applications, Microchim. Acta, 2017, 184(7), 1899–1914, DOI:10.1007/s00604-017-2318-9.
- H. Wan, et al., AIE-based fluorescent sensors for low concentration toxic ion detection in water, J. Hazard. Mater., 2021, 403, 123656, DOI:10.1016/j.jhazmat.2020.123656.
- M. Stanisavljevic, S. Krizkova, M. Vaculovicova, R. Kizek and V. Adam, Quantum dots-fluorescence resonance energy transfer-based nanosensors and their application, Biosens. Bioelectron., 2015, 74, 562–574, DOI:10.1016/j.bios.2015.06.076.
- Y. Yan, et al., Chemiluminescence resonance energy transfer: From mechanisms to analytical applications, TrAC – Trends Anal. Chem., 2020, 123, 115755, DOI:10.1016/j.trac.2019.115755.
- S. Miao, K. Liang and B. Kong, Förster resonance energy transfer (FRET) paired carbon dot-based complex nanoprobes: Versatile platforms for sensing and imaging applications, Mater. Chem. Front., 2020, 4(1), 128–139, 10.1039/c9qm00538b.
- S. Ding, A. A. Cargill, S. R. Das, I. L. Medintz and J. C. Claussen, Biosensing with förster resonance energy transfer coupling between fluorophores and nanocarbon allotropes, Sensors, 2015, 15(6), 14766–14787, DOI:10.3390/s150614766.
- P. Zheng and N. Wu, Fluorescence and Sensing Applications of Graphene Oxide and Graphene Quantum Dots: A Review, Chem. – Asian J., 2017, 12(18), 2343–2353, DOI:10.1002/asia.201700814.
- J. Zhang, H. Yang, S. Pan, H. Liu and X. Hu, A novel ‘off-on-off’ fluorescent-nanoprobe based on B, N co-doped carbon dots and MnO2 nanosheets for sensitive detection of GSH and Ag+, Spectrochim. Acta, Part A, 2021, 244, 118831, DOI:10.1016/j.saa.2020.118831.
- Z. G. Khan and P. O. Patil, Fabrication of polyethyleneimine surface-functionalized fluorescent carbon dots and its applications towards highly sensitive and selective detection of glutathione in aqueous medium and in vitro cell imaging of HeLa cells, J. Mater. Sci.: Mater. Electron., 2021, 32(18), 23215–23231, DOI:10.1007/s10854-021-06808-3.
- W. Dong, R. Wang, X. Gong and C. Dong, An efficient turn-on fluorescence biosensor for the detection of glutathione based on FRET between N,S dual-doped carbon dots and gold nanoparticles, Anal. Bioanal. Chem., 2019, 411(25), 6687–6695, DOI:10.1007/s00216-019-02042-3.
- D. Bano, S. Chandra, P. K. Yadav, V. K. Singh and S. H. Hasan, Off-on detection of glutathione based on the nitrogen, sulfur codoped carbon quantum dots@MnO2 nano-composite in human lung cancer cells and blood serum, J. Photochem. Photobiol., A, 2020, 398, 112558, DOI:10.1016/j.jphotochem.2020.112558.
- J. Li, X. Rao, F. Xiang, J. Wei, M. Yuan and Z. Liu, A photoluminescence ‘switch-on’ nanosensor composed of nitrogen and sulphur co-doped carbon dots and gold nanoparticles for discriminative detection of glutathione, Analyst, 2018, 143(9), 2083–2089, 10.1039/c8an00168e.
- Q. Y. Cai, et al., A rapid fluorescence ‘switch-on’ assay for glutathione detection by using carbon dots-MnO2 nanocomposites, Biosens. Bioelectron., 2015, 72, 31–36, DOI:10.1016/j.bios.2015.04.077.
- Y. Chawre, et al., Förster Resonance Energy Transfer between Multicolor Emissive N-Doped Carbon Quantum Dots and Gold Nanorods for the Detection of H2O2, Glucose, Glutathione, and Acetylcholinesterase, ACS Appl. Nano Mater., 2023, 6(9), 8046–8058, DOI:10.1021/acsanm.3c01518.
- H. Zhang, S. Wu, Z. Xing and H. B. Wang, Turning waste into treasure: Chicken eggshell membrane derived fluorescent carbon nanodots for the rapid and sensitive detection of Hg2+ and glutathione, Analyst, 2021, 146(23), 7250–7256, 10.1039/d1an01582f.
- H. Qi, X. Sun, T. Jing, J. Li and J. Li, Integration detection of mercury(II) and GSH with a fluorescent ‘on-off-on’ switch sensor based on nitrogen, sulfur co-doped carbon dots, RSC Adv., 2022, 12(4), 1989–1997, 10.1039/d1ra08890d.
- Y. Zhang, C. Lei, P. Dong, P. Fu, Y. Zhang and R. Hua, Green synthesis of carbon dots from fish scales for selective turn off-on detection of glutathione, RSC Adv., 2024, 14(5), 3578–3587, 10.1039/d3ra07444g.
- L. Dewangan, J. Korram, I. Karbhal, R. Nagwanshi and M. L. Satnami, N-Doped Carbon Quantum Dot-MnO2 Nanowire FRET Pairs: Detection of Cholesterol, Glutathione, Acetylcholinesterase, and Chlorpyrifos, ACS Appl. Nano Mater., 2021, 4(12), 13612–13624, DOI:10.1021/acsanm.1c03047.
- L. Liao, X. Lin, J. Zhang, Z. Hu and F. Wu, Facile preparation of carbon dots with multicolor emission for fluorescence detection of ascorbic acid, glutathione and moisture content, J. Lumin., 2023, 264, 120169, DOI:10.1016/j.jlumin.2023.120169.
- S. Gogoi and R. Khan, NIR upconversion characteristics of carbon dots for selective detection of glutathione, New J. Chem., 2018, 42(8), 6399–6407, 10.1039/c8nj00567b.
- M. He, N. Shang, B. Zheng and G. Yue, An ultrasensitive colorimetric and fluorescence dual-readout assay for glutathione with a carbon dot-MnO2 nanosheet platform based on the inner filter effect, RSC Adv., 2021, 11(34), 21137–21144, 10.1039/d1ra02411f.
- D. Kong, F. Yan, Y. Luo, Y. Wang, L. Chen and F. Cui, Carbon nanodots prepared for cellular imaging and turn-on detection of glutathione, Anal. Methods, 2016, 8(23), 4736–4743, 10.1039/c6ay01033d.
- X. Li, et al., Microwave synthesis of nitrogen and sulfur co-doped carbon dots for the selective detection of Hg2+ and glutathione, Opt. Mater., 2020, 99, 109559, DOI:10.1016/j.optmat.2019.109559.
- Y. Ma, et al., Off-on fluorescent switching of boron-doped carbon quantum dots for ultrasensitive sensing of catechol and glutathione, Carbon, 2020, 162, 234–244, DOI:10.1016/j.carbon.2020.02.048.
- J. Pan, et al., A novel and sensitive fluorescence sensor for glutathione detection by controlling the surface passivation degree of carbon quantum dots, Talanta, 2017, 166, 1–7, DOI:10.1016/j.talanta.2017.01.033.
- J. Qin, L. M. Zhang and R. Yang, Powder carbonization to synthesize novel carbon dots derived from uric acid for the detection of Ag(I) and glutathione, Spectrochim. Acta, Part A, 2019, 207(I), 54–60, DOI:10.1016/j.saa.2018.08.066.
- D. Wu, et al., Fluorometric determination and imaging of glutathione based on a thiol-triggered inner filter effect on the fluorescence of carbon dots, Microchim. Acta, 2017, 184(7), 1923–1931, DOI:10.1007/s00604-017-2187-2.
- X. Yang, M. Zhang, Y. Zhang, N. Wang, W. Bian and M. M. F. Choi, Nitrogen and phosphorus co-doped carbon dots as a ‘turn-off-on’ fluorescence probe for the detection of Hg2+ and GSH and cell imaging, Anal. Methods, 2019, 11(45), 5803–5809, 10.1039/c9ay01723b.
- C. Zhao, K. Wang, Q. Cai, H. Tu, L. Pan and L. Yu, Signal-on fluorescent sensor based on N-CQDs for the detection of glutathione in human serum and pharmaceutic preparation, Prep. Biochem. Biotechnol., 2017, 47(8), 835–840, DOI:10.1080/10826068.2017.1342267.
- R. Jia, K. Jin, J. Zhang, X. Zheng, S. Wang and J. Zhang, Colorimetric and fluorescent detection of glutathione over cysteine and homocysteine with red-emitting N-doped carbon dots, Sens. Actuators, B, 2020, 321, 128506, DOI:10.1016/j.snb.2020.128506.
- H. Guan, D. Wang and B. Sun, Dual-mode colorimetric/fluorometric sensor for the detection of glutathione based on the peroxidase-like activity of carbon quantum dots, Inorg. Chem. Commun., 2022, 136, 109147, DOI:10.1016/j.inoche.2021.109147.
- Y. Han, et al., Carbon dots based ratiometric fluorescent sensing platform for food safety, Crit. Rev. Food Sci. Nutr., 2022, 62(1), 244–260, DOI:10.1080/10408398.2020.1814197.
- K. F. Kayani, et al., Ratiometric Lanthanide Metal-Organic Frameworks (MOFs) for Smartphone-Assisted Visual Detection of Food Contaminants and Water: A Review, ChemistrySelect, 2023, 8(47), e202303472, DOI:10.1002/slct.202303472.
- M. Ti, et al., A ratiometric nanoprobe based on carboxylated graphitic carbon nitride nanosheets and Eu3+ for the detection of tetracyclines, Analyst, 2021, 146, 1065–1073, 10.1039/d0an01826k.
- K. Tang, et al., A smartphone-assisted down/up-conversion dual-mode ratiometric fluorescence sensor for visual detection of mercury ions and l-penicillamine, Sci. Total Environ., 2022, 856, 159073, DOI:10.1016/j.scitotenv.2022.159073.
- Z. Han, et al., Carbon quantum dots based ratiometric fluorescence probe for sensitive and selective detection of Cu2+ and glutathione, Sens. Actuators, B, 2019, 298, 126842, DOI:10.1016/j.snb.2019.126842.
- S. Lu, et al., Carbon dots-based ratiometric nanosensor for highly sensitive and selective detection of mercury(II) ions and glutathione, RSC Adv., 2016, 6(105), 103169–103177, 10.1039/c6ra21309j.
- J. Wang, et al., Dual-emission carbon dots achieved by luminescence center modulation within one-pot synthesis for a fluorescent ratiometric probe of pH, Hg2+, and glutathione, Microchim. Acta, 2020, 187(6), 1–11, DOI:10.1007/s00604-020-04311-w.
- K. Alhazzani, A. Z. Alanazi, A. M. Mostafa, J. Barker, M. M. El-Wekil and A. M. B. H. Ali, A dual emissive silver-riboflavin complex and nitrogen-doped carbon dot nanoprobe for ratiometric detection of glutathione, Microchem. J., 2024, 199, 109996, DOI:10.1016/j.microc.2024.109996.
- H. Wu, L. Yang, L. Chen, F. Xiang and H. Gao, Visual determination of ferric ions in aqueous solution based on a high selectivity and sensitivity ratiometric fluorescent nanosensor, Anal. Methods, 2017, 9(41), 5935–5942, 10.1039/c7ay01917c.
- R. C. Castro, D. S. M. Ribeiro and J. L. M. Santos, Visual detection using quantum dots sensing platforms, Coord. Chem. Rev., 2021, 429, 213637, DOI:10.1016/j.ccr.2020.213637.
- M. Zhang, et al., Visual detection for nucleic acid-based techniques as potential on-site detection methods. A review, Anal. Chim. Acta, 2020, 1099, 1–15, DOI:10.1016/j.aca.2019.11.056.
- Y. Han, Y. Bian and G. Wang, A novel nitrogen-doped carbon dots as ‘on-off-on’ fluorescent sensor for ultrasensitive and visual quantitative detection of mercuric(II) and glutathione, J. Environ. Chem. Eng., 2023, 11(5), 110750, DOI:10.1016/j.jece.2023.110750.
- S. Chu, H. Wang, Y. Du, F. Yang, L. Yang and C. Jiang, Portable Smartphone Platform Integrated with a Nanoprobe-Based Fluorescent Paper Strip: Visual Monitoring of Glutathione in Human Serum for Health Prognosis, ACS Sustainable Chem. Eng., 2020, 8(22), 8175–8183, DOI:10.1021/acssuschemeng.0c00690.
- X. Yuan, F. Bai, H. Ye, H. Zhao, L. Zhao and Z. Xiong, Smartphone-assisted ratiometric fluorescence sensing platform and logical device based on polydopamine nanoparticles and carbonized polymer dots for visual and point-of-care testing of glutathione, Anal. Chim. Acta, 2021, 1188, 339165, DOI:10.1016/j.aca.2021.339165.
| This journal is © The Royal Society of Chemistry 2024 |