DOI:
10.1039/D3MA01079A
(Paper)
Mater. Adv., 2024,
5, 2797-2804
Exploring pristine and transition metal doped SiP2 monolayer as a promising anode material for metal (Li, Na, Mg) ion battery†
Received
2nd December 2023
, Accepted 30th January 2024
First published on 31st January 2024
Abstract
Following the successful synthesis of SiP2 monolayers, the two-dimensional (2D) SiP2 monolayer could potentially be used in various fields including photocatalyst water splitting, phototransistor, and thermoelectric applications. However, 2D SiP2 has not been explored as an electrode in the field of rechargeable batteries. In this study, we investigate the structural and electronic properties of 2D SiP2 monolayers. This study also covers the analysis of doping effects on pristine SiP2 where we substitute the phosphorus atom with a transition metal (Cr, Mn, Co, Ni). Further, we show its potential application as an anode material for lithium, sodium, and magnesium ion batteries. We analyze the adsorption and diffusion behavior of the alkali metal atoms. The magnesium ion shows a maximum adsorption energy of −3.2 eV, followed by −2.42 eV and −2.22 eV for the Li and Na ions respectively. The calculated minimum diffusion barrier for Li and Na is 0.9 eV and 0.28 eV, while the Mg ion shows an ultra-low diffusion barrier of 0.06 eV which is the signature of the SiP2 monolayer. The predicted open circuit voltage falls between 0.6 to 0.9 volts for all the metal atoms. The specific capacity shown by the SiP2 monolayers towards Li, Na and Mg are 209 mA h g−1, 188 mA h g−1 and 373 mA h g−1, respectively.
I. Introduction
The need for energy is growing along with the human population. However, the majority of energy usage results in the release of greenhouse gases, which are harmful for the environment. In order to achieve zero carbon emission, renewable energy is essential since it offers a cleaner energy source and lowers the need for fossil fuels. In the field of energy storage, a rechargeable battery is a very popular energy storage device due to its small size, being lightweight with high energy density, and offers a good charging rate.1,2 Graphite is used as the anode material in commercial Li-ion batteries (LIBs). The graphite anode delivers a comparatively low theoretical capacity of 372 mA h g−1 which makes it challenging to meet the high energy density requirements in commercial applications. Also, the bulky nature, high weight, and low conductivity inhibit its efficiency. So there is a lot of scope to increase the efficiency of commercial anodes.3,4
Since the discovery of graphene in 2004, it has attracted the interest of researchers from all over the world due to its extraordinary physical properties,5,6 which are found to be missing in its bulk counterpart, graphite, that have opened the door to examining its potential in a variety of applications. Graphene is the lightest 2D material reported for LIBs. For LIB electrode materials many well-known 2D materials – such as phosphorene,7,8 arsenene,9 transition metal dichalcogenides (TMDs),10,11 transition metal carbides,12 and nitrides (MXenes),13 transition metal oxides,14,15 Janus transition metals16,17 have been synthesized and investigated. While many new 2D material families are being explored in lithium-ion battery technology, the lithium atom content on Earth is limited. So we have to find an alternate to do the job of lithium in rechargeable batteries. So sodium-ion batteries (SIBs)18 and magnesium ion batteries (MIBs)19 have been investigated as a potential anode in batteries; sodium and magnesium are readily available and abundant elements. Doping is one of the key strategies to modulate the properties of a material. Puja et al. showed that transition metal doping in phosphorene monolayers induced stable magnetic order with 100% spin injection efficiency which is absent in the pristine form.20,21 Similarly doping can alter the band gap which can be attractive for electronic property manipulation.22,23
Among the many potential 2D materials, 2D SiP2 is known for its universality in terms of application in various fields including thermoelectric,24 water splitting,25 and photodetectors.26 Wang, Ziming et al. successfully exfoliated 2D SiP2 from bulk SiP2 using an optimized flux growth method.27–29 However, their use in electrode materials has still not been studied. Similarly, Malyi et al. predicted the stable structure of SiP2via a siliconization technique.30 In this study using first-principles calculations, we have systematically investigated the structural and electronic properties of 2D SiP2 monolayers. We doped the pristine SiP2 monolayer with the transition metals to analyze the electronic properties where we studied the adsorption behavior of metal atoms on the doped SiP2 monolayer. We have shown its potential use as an anode for multi-ion batteries, analyzing the adsorption and diffusion of metal atoms on SiP2 monolayers at the atomic level.
II. Computational methods
First-principles calculations based on density functional theory (DFT) was used to carry out this work using QuantumATK,31 under the spin-polarized generalized gradient approximation (SGGA) with the Perdew–Burke–Ernzerhof (PBE) exchange–correlation functional.32,33 A linear combination of the atomic orbital (LCAO) double-zeta polarized basis set is used for the DFT computations. The Brillouin zone is sampled with a 7 × 5 × 1 Monkhorst Pack k-grid with a density mesh cut-off energy value of 125 Hartree. The Broyden Fletcher Goldfarb Shanno (BFGS) algorithm34 with pressure and force tolerance of 0.0001 eV Å−1 and 0.01 eV Å−1 is adopted to carry out the optimization process. In order to prevent interaction between the periodically continuous structures, a vacuum space of 27 Å in the z-direction is used. To calculate the electronic properties such as band structure and projected density of states (PDOS) of all the structures we employed a k-point grid35 of 11 × 9 × 1. We used the Grimme DFT-D3 empirical correction approach to handle the van der Waals interaction.36 The phonon band structure is calculated using the phonopy code. The thermal stability of the metal atom adsorbed system was studied using performing ab initio molecular dynamics (AIMD) simulations. We have utilized the climbing-image nudged elastic band (CI-NEB) technique37 to investigate the diffusion of Li, Na, and Mg ions on the SiP2 monolayer. We have used the quasi-Newton Broyden’s method second approach to optimise the NEB computations.
III. Results and discussion
A. Structural and electronic properties
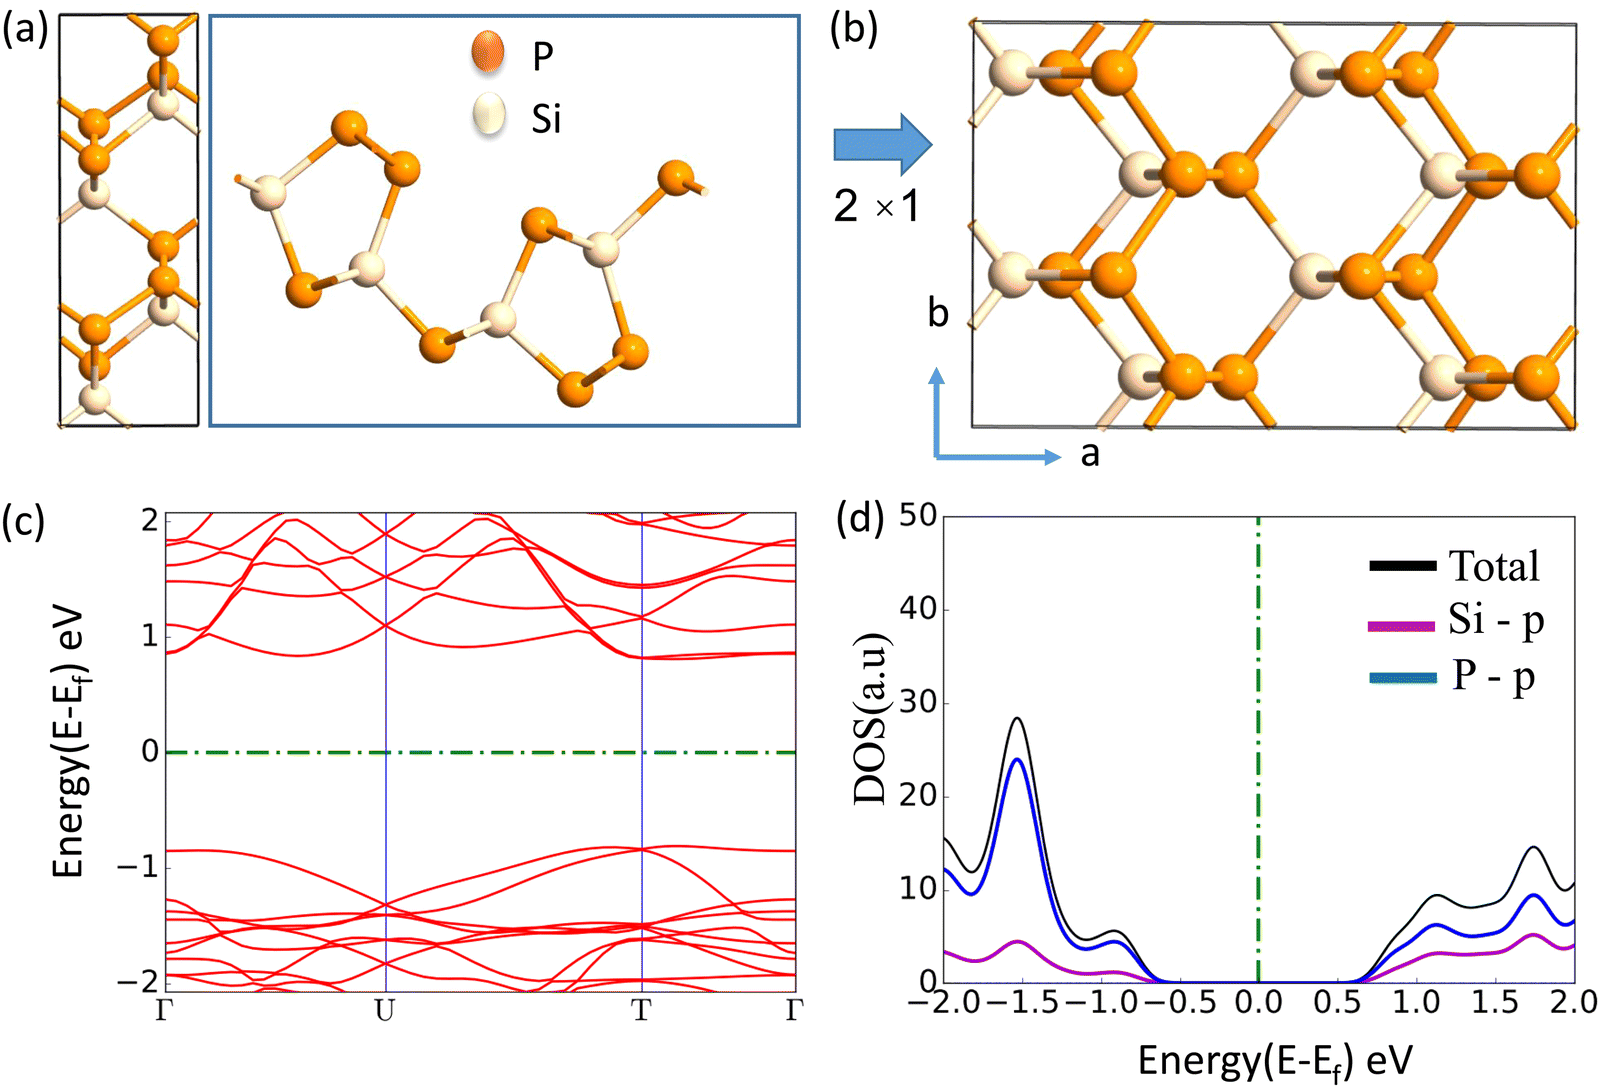
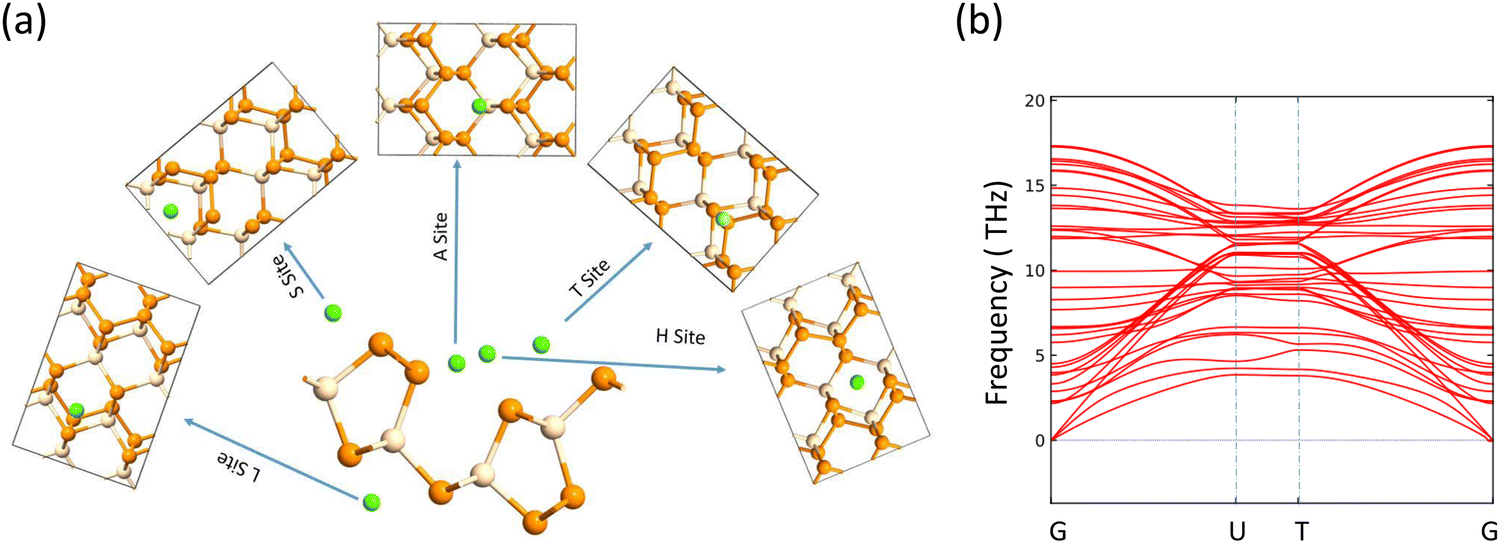
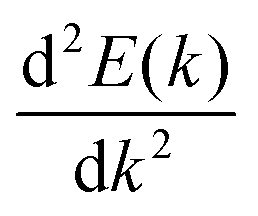
The journey towards the novel SiP2 begins with the following: first, using a stoichiometric mix of the pure elements, Wadsten created needle-like SiP2 crystals (the preparation of single crystal orthorhombic SiP2).38 He then used X-ray diffraction (XRD) methods to determine that the crystal structure. Later, employing solution synthesis in molten Sn that contained a significant amount of Mg, Spring Thorpe created SiP2 crystals with a similar shape.27 Recently it was reported using first-principles calculation results that the Pnma phase is thermodynamically more stable than the Pbam phase. So we have taken the Pnma phase for our study. The corresponding optimized lattice parameters are a = 10.04 Å and b = 3.44 Å which are in agreement with the previous findings. Monolayer SiP2 consists of (SiP2P3)n pentagonal tubes in the b direction, connected by P atoms in the a direction, and contains 8 P and 4 Si atoms in the primitive unit cell. We have taken a 2 × 1 supercell of the SiP2 monolayer for our study to limit the computational cost and to save time. The SiP2 monolayer shows semiconductor behavior with a band gap of 1.68 eV matched with the previous findings. The optimized structure of the SiP2 monolayer with the band structure and projected density of states (PDOS) is shown in Fig. 1. The p orbital of P and Si atoms is the main contributor to the density of states. The stability of the SiP2 monolayer is confirmed by its phonon band structure, shown in Fig. 2(b). As there are no negative frequencies present, the SiP2 monolayer is thermodynamically stable. Also, to predict the stability at room temperature we performed ab initio molecular dynamics (AIMD) simulations. The energy vs. time variation of the structure at room temperature is shown in Fig. S7 (ESI†). Furthermore, the maximum phonon frequency of monolayer SiP2 appears to be approaching 17 THz, which is higher than that recently reported for 1T phase Janus TiSSe and MoS2![[thin space (1/6-em)]](https://www.rsc.org/images/entities/char_2009.gif) 39 and 2H phase Janus VSSe (11 THz).16 So it is expected to be more stable than some of the Janus and TMD monolayers. As the SiP2 monolayer shows semiconducting nature, we have analyzed both electron and hole behavior. Both the charge carriers are predicted to have different effective mass and mobility due to the local curvature of the electronic band energy. The effective mass is related to the band energy by eqn (1),
39 and 2H phase Janus VSSe (11 THz).16 So it is expected to be more stable than some of the Janus and TMD monolayers. As the SiP2 monolayer shows semiconducting nature, we have analyzed both electron and hole behavior. Both the charge carriers are predicted to have different effective mass and mobility due to the local curvature of the electronic band energy. The effective mass is related to the band energy by eqn (1),| |  | (1) |
where  is the curvature of the local band energy. The mobility of the charge carriers was calculated where we have implemented the isotropic method and provided an inverse relaxation time. The isotropic scattering rate approach in QuantumATK is implemented in the same way as BoltzTrap.40 The tetrahedron approach is used to carry out the energy integrations. The calculated effective mass and mobility of the charge carrier along the a,b-directions are listed in Table S3 (ESI†).
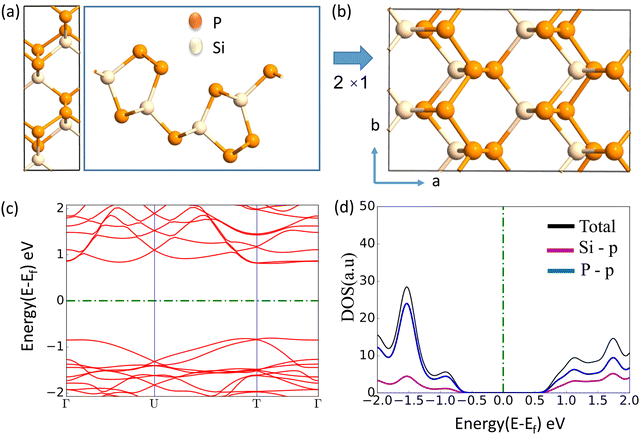 |
| | Fig. 1 (a) Top and side view of the unit cell, (b) top view of the 2 × 1 supercell, (c) band structure (d) PDOS of the optimized SiP2 monolayer. | |
 |
| | Fig. 2 (a) Adsorption sites for alkali metal atom, (b) phonon band structure. | |
B. Alkali metal atom adsorption study
The electrodes of a rechargeable battery are intercalated-type materials that store metal ions between them. So the adsorption of metal atoms on the surface of electrode materials is an important topic of discussion. The anisotropic structure of the SiP2 monolayers provides various adsorption sites for the metal atom adsorption. By analyzing the symmetry and previously reported results, we use five stable adsorption sites for further study. These favorable sites are the H site (atom present above the mid hexagonal site from 4P and 2Si atom), the T site (above the edge of the hexagon on the mid of the bond between two P atoms), A site (above the edge of the hexagonal site present at the mid of the supercell), S site (above the hexagonal site at the left of the supercell) and L site (mid of the hexagonal site at the lower side of the supercell). All the adsorption sites are shown in Fig. 2(a). We have taken lithium, sodium, and magnesium atoms for analysis of the adsorption behavior. The average adsorption energy was calculated with the following formula:41| |  | (2) |
where ESiP2+M is the total energy of the SiP2 monolayer with n metal atom adsorption and ESiP2 is the total energy of the pristine SiP2 monolayers, EM is the energy of the isolated metal atom, n is the number of metal atoms.
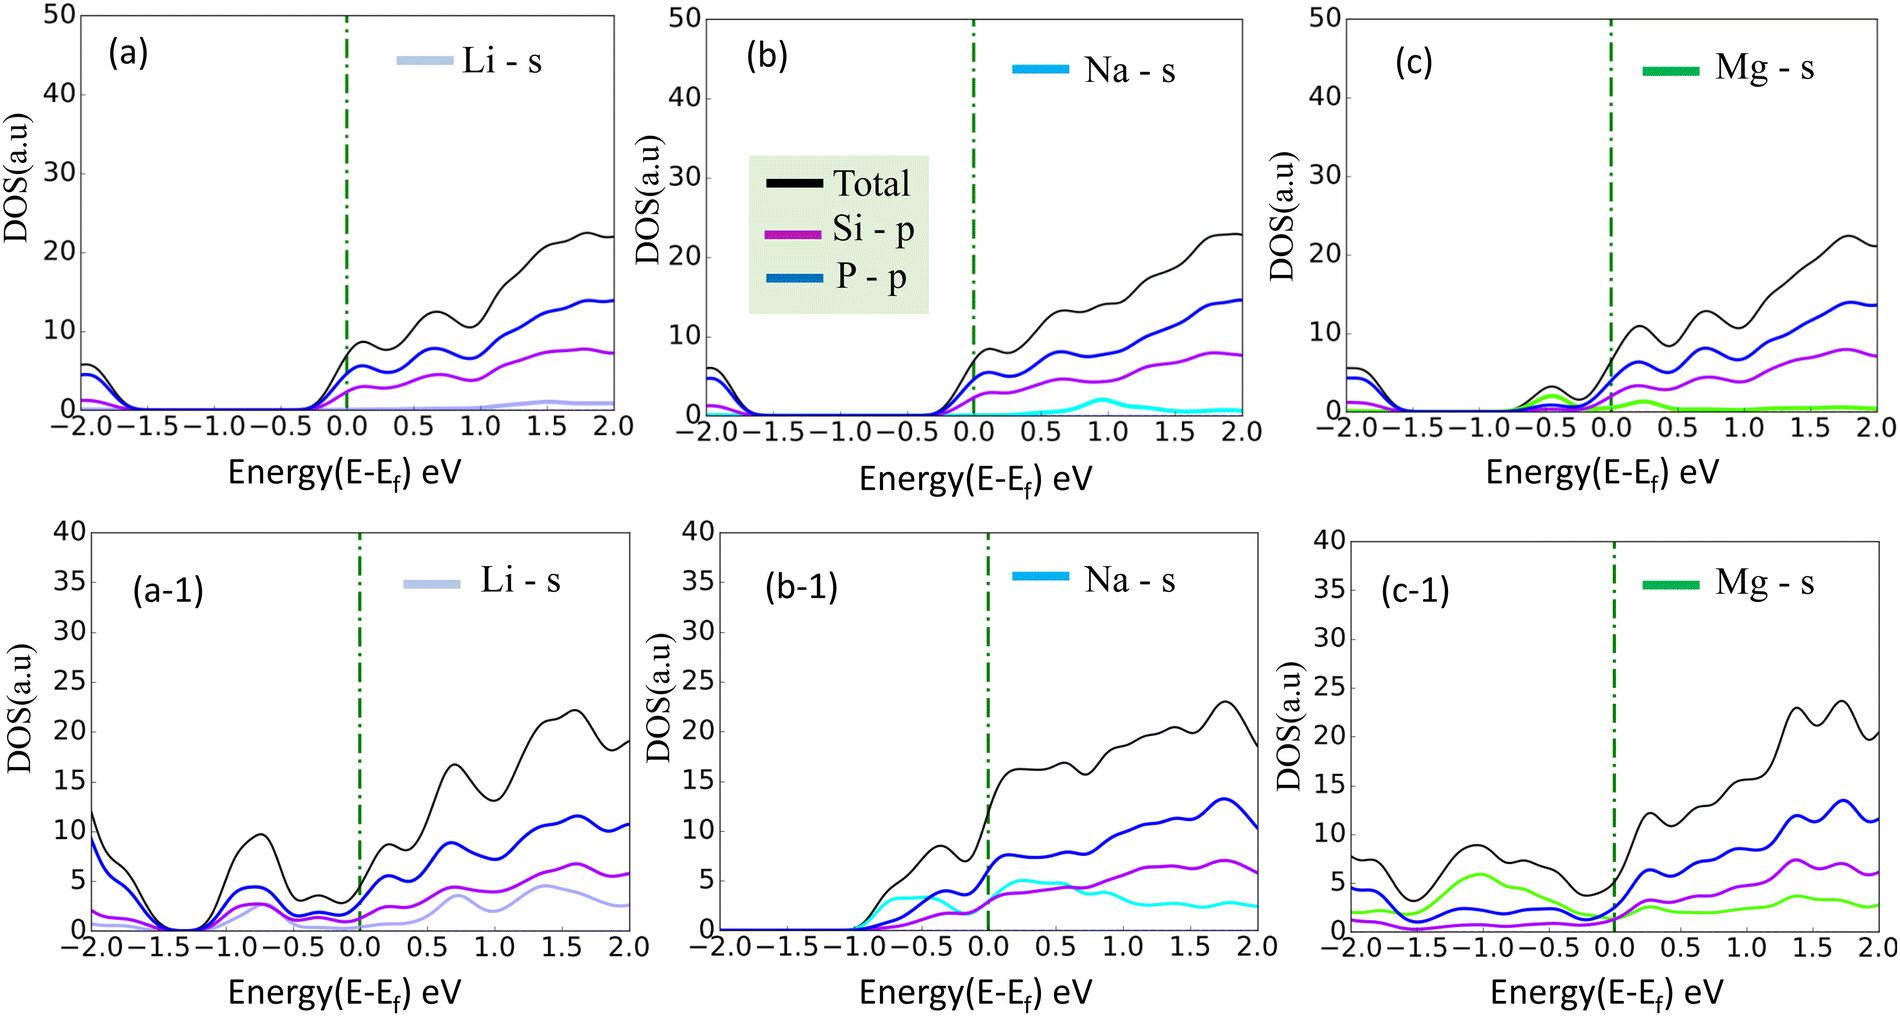
A more negative adsorption energy indicates a more favorable exothermic reaction42 between monolayer and metal atoms. Among all the adsorption sites, the H site is predicted to have more negative adsorption energy for all metal atoms. For the Mg atom, the adsorption energy strength is followed by the L site, T site, A site, and then the S site respectively. For other metal atoms, the adsorption trends can be verified from Table 1. However, metal atoms present above the B site (above the bond between the two top p atoms) are migrated to the T site after optimization, indicating metastable adsorption sites. The maximum adsorption energy for Li is found to be −3.12 eV followed by −2.45 eV and −2.55 eV for Na and Mg atoms, respectively. These adsorption energies are very high as compared to most 2D materials (VS2, g-CN,43 1T-MoS2,44 WSSe,45,46 SiC3N347). The Mg atoms stay further from the monolayers than the Na and Li atoms due to their larger size. The adsorption distance of the Li, Na, and Mg atoms is shown in Fig. 3. The adsorption energy of the alkali metal atoms at different sites is tabulated in Table 1. From the PDOS it was concluded that the s orbital of Li, Na, and Mg atoms contributes little to the density of states, whereas after the adsorption of metal atoms, the structure turns into a conducting phase with a large band crossing the Fermi level which is the necessary criteria for an anodic application. But for full adsorption of Li, Na, and Mg atoms, the structure remains metallic with a significant contribution of alkali atoms to the density of states. The PDOS of the single and full alkali atom adsorbed systems are shown in Fig. 4. The band structures after single and full Li, Na and Mg adsorbed structures are shown in Fig. S1 (ESI†). To visualize the interaction of the metal atom with the monolayer we have calculated the charge transfer of the metal atom by adopting Bader charge analysis. Li atoms transfer a significant 0.68e fractional charge to the SiP2 monolayer, whereas Na and Mg atoms transfer 0.60e and 0.78e charge to the monolayer. We have also plotted the isosurface to visualize the charge density difference of the single metal atom adsorbed SiP2 monolayer at the H site. The charge transfer is given in Table S2 (ESI†) and the isosurface plot is given in Fig. S5 and S6 (ESI†).
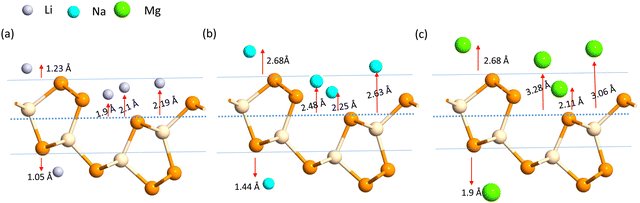 |
| | Fig. 3 Adsorption distance of the (a) Li, (b) Na and (c) Mg ions. | |
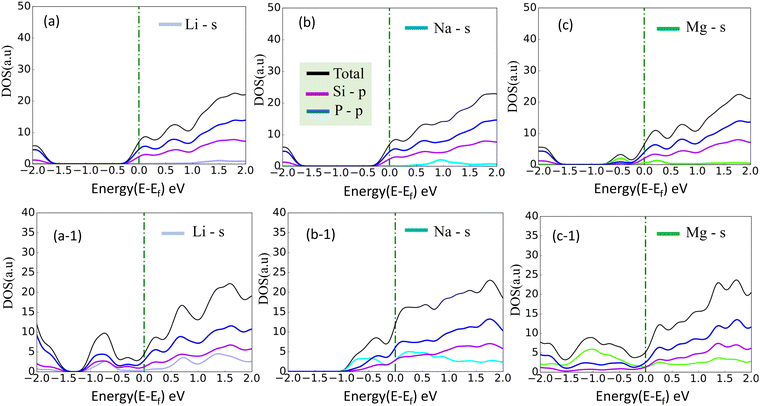 |
| | Fig. 4 (a)–(c) PDOS of single adsorbed Li, Na, and Mg; (a-1), (b-1) and (c-1) indicate the full Li, Na, and, Mg adsorbed configuration, on SiP2 monolayer. | |
Table 1 Adsorption energy at the different sites
| Adsorption site |
E
adLi (eV) |
E
adNa (eV) |
E
adMg (eV) |
| H |
−3.12 |
−2.45 |
−2.55 |
| T |
−2.99 |
−2.01 |
−2.41 |
| A |
−3.05 |
−2.10 |
−2.36 |
| S |
−2.66 |
−1.55 |
−2.30 |
| L |
−2.64 |
−1.93 |
−2.42 |
C. Dopant induced properties
We have performed substitutional doping where one P atom at the top layer is substituted by transition metal Cr, Mn, Ni, and Co atoms,48 as shown in Fig. S1(g) (ESI†). The reason for the substitution of the P atom is the formation energy. For reference, we have substituted P and Si atoms with the Cr atom and calculated the formation energy using (eqn (3)) below. The formation energy of the P-substituted transition metal doped SiP2 monolayer is more negative than the Si substituted one, as given in the ESI† (Table S1). So we have considered only the P atom is substituted with the transition metal atom in our further work. We have confirmed the stability from the negative formation energy which is calculated using the following equation,49| | | Eform = Edoped − Epristine + Ep − ETM | (3) |
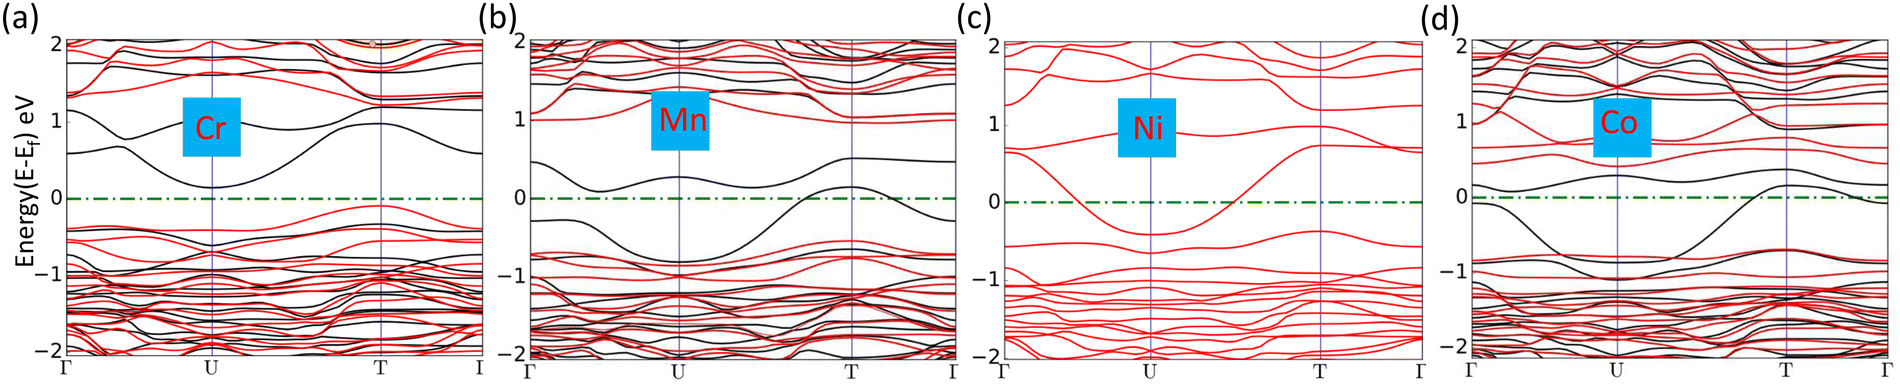
where Edoped is the total energy of the doped SiP2 and Epristine is the total energy of pristine monolayers, Ep and ETM are the total energy of the P atom and transition metal in its pure form, respectively. The calculated formation energy for all the doped SiP2 monolayers is negative, indicating the stability of the respective monolayers. The formation energy for all the configurations is listed in Table 2. Cr doping reduces the bandgap of the SiP2 monolayer to 0.54 eV by providing both spin-down and spin-up states to the band structures which are inherited from the electrons present in the d orbital of the Cr atom. However, Mn, Ni, and Co doping make the semiconducting SiP2 monolayer metallic, which is more suitable for electrode applications. The band structure of all the transition metal doped structures is shown in Fig. 5. From the band structure, it was concluded that Cr, Mn, and Co-doped SiP2 monolayers contain both spin-up and spin-down states which refer to the magnetic behavior. Whereas in Ni-doped SiP2, both spin states contributed equally. Cr-doped 2D SiP2 emerges as a magnetic semiconductor with a little band gap and Mn, Ni, and Co-doped SiP2 show magnetic and metallic behavior. We have also calculated the adsorption behavior of the doped SiP2 towards the alkali atoms at its highest adsorption site. The adsorption energy is calculated using eqn (1), we have a negative adsorption value for all cases which shows all the doped structures can accommodate metal atoms. The adsorption value for Li, Na, and Mg atoms is listed in Table 2. Cr and Ni-doped SiP2 is not preferable for Li and Na ion batteries because, after Li and Na adsorption, the system transformed to a semiconducting phase; but Mg atom adsorption makes it conduct, which makes it suitable for use in magnesium ion batteries. However, Co-doped SiP2 shows the semiconducting nature for Li and Mg atoms while showing the metallic nature for Na which is preferable for Na ion battery application. In Mn-doped SiP2 all the Li, Na, and Mg adsorbed systems show a semiconducting nature. It can be seen in Table 2 that transition metal doping reduces the adsorption energy significantly. The band structure of Li, Na and Mg adsorbed in the doped structure are shown in Fig. S2 and S3 (ESI†).
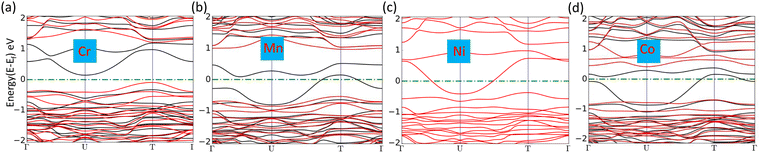 |
| | Fig. 5 (a)–(d) Band structure of Cr, Mn, Ni, and Co-doped SiP2 monolayers, respectively. | |
Table 2 Formation (Eform) and adsorption energy (Ead) of the doped SiP2
| Doped SiP2 |
E
form (eV) |
E
adLi (eV) |
E
adNa (eV) |
E
adMg (eV) |
| Cr |
−2.59 |
−1.28 |
−0.61 |
−1.24 |
| Mn |
−2.21 |
−1.26 |
−0.23 |
−0.75 |
| Ni |
−1.91 |
−1.54 |
−0.61 |
−0.54 |
| Co |
−2.69 |
−2.69 |
−0.24 |
−1.52 |
D. The metal atom diffusion
Another significant characteristic of SiP2 that makes it a potential contender for metal ion batteries, is its low diffusion barrier. The rate of charging and discharging is an indicator of its diffusion barrier. We investigated the diffusion energy barriers by calculating the minimum energy path using the nudged elastic band approach.50 Between the initial and final structural arrangements, eight images were used. As the H site and L site are the most favorable sites for metal atom adsorption for the top and bottom side of the monolayer SiP2, we have considered three paths based on the symmetry of adsorption sites. Path 1 (metal atom migration from one H site to another H site via the B site which is the metastable site), path 2 (metal atom diffusion from the A site to another A site via the B site), and path 3 (H site to adjacent H site via the B site on the bottom side). We have used the CI-NEB method to measure the energy change when a metal atom moves between the relevant adsorption sites to assess the diffusion of a single Li and Na atom on the monolayers. The Arrhenius equation51,52 is used to determine the relative diffusion mobility. According to Arrhenius, the following equation can be used to calculate the diffusion constant (D) of the lithium and sodium ions,53| |  | (4) |
where T is the ambient temperature, Eb is the barrier energy, kB is the Boltzmann constant, and D0 is the temperature-independent pre-exponential constant. Using the above equation at different temperatures and different barriers we can predict the diffusion constant. The conductivity of a particular material is related to the diffusion constant by the following equation;| |  | (5) |
where σ is conductivity, D is diffusion constant.
The lowest barrier for Li and Na is calculated as 0.82 eV and 0.28 eV, respectively, whereas the Mg atom faced a very low diffusion barrier of 0.06 eV. The diffusion barriers for all the metal atoms on different paths are shown in Fig. 6.
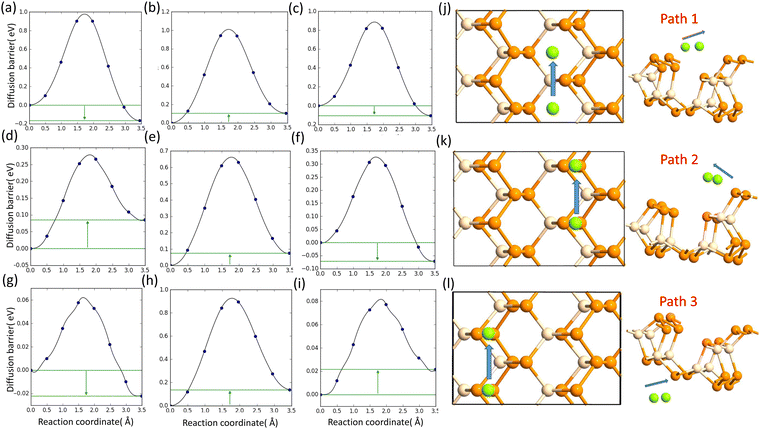 |
| | Fig. 6 (a), (b) and (c) Diffusion barrier of Li on path 1, path 2, and path 3; (d), (e) and (f) diffusion barrier of Na on path 1, path 2, and path 3; and (g), (h) and (i) diffusion barrier of Mg on path 1, path 2, and path 3. (j), (k) and (l) Schematics of the diffusion paths. | |
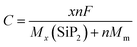
E. Open circuit voltage and storage capacity of SiP2 monolayers
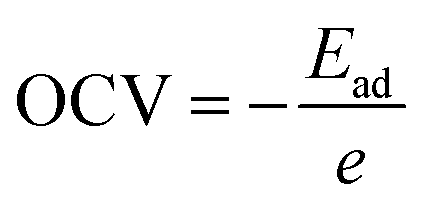
The open circuit voltage is calculated from the Gibbs free energy of the system after the intercalation of metal atoms. The Gibbs free energy is given by the following equation;where ΔG represents the change in Gibbs free energy, ΔE, ΔS, and ΔV are the change in internal energy, entropy, and volume, respectively. In the battery application, the entropy change and the volume change at a particular temperature (T) and pressure (P) are negligible as compared to the change in the internal energy of the system which is the average energy of the system during intercalation, denoted as Ead and calculated using eqn (2). The open-circuit voltage (OCV) of the SiP2 monolayer for all the metal atoms are calculated with gradually increasing metal atoms, according to the following equation54| |  | (7) |
where Ead is the average adsorption energy of a metal atom and e is the charge of an electron. The calculated OCV for Li, Na, and Mg atoms from minimum to maximum adsorption, are shown in Fig. 7. As we can see from Fig. 7 the OCV decreases as we increase the metal atom content. The minimum OCV for the SiP2 anode toward Li, Na, and Mg atoms is 0.85, 0.33, and 0.75 volt, respectively.
Another important feature of an electrode is its specific capacity which is calculated using the following equation55
| |  | (8) |
where
F is the Faraday constant (26
801 mA h mole
−1),
MSiP2 and
Mm are the molecular weights of the SiP
2 monolayer and the metal atom,
n is the number of Li atoms and the symbol
x is the valency of metal atoms. The SiP
2 monolayer can accommodate up to 6 Li, Na, and Mg atoms with predicted specific capacities of 209, 188, and 373 mA h g
−1, respectively. However, when we tried to increase the metal atoms further, the structure became distorted as shown in Fig. S4 (ESI
†). The specific capacity of the SiP
2 anode for Li and Na is a decent value, but the specific capacity for the Mg atom is comparable to the commercial graphite anode with an ultra-low diffusion barrier of 0.06 eV.
 |
| | Fig. 7 (a)–(c) OCV vs. Li, Na, and Mg atom content; figure on the left and right side of (a)–(c) show the minimum and maximum metal atom adsorption system. | |
IV. Conclusions
In this work, by adopting the density functional theory approach we have thoroughly calculated and analyzed the structural, electronic, and storage properties of pristine SiP2 and transition metal doped SiP2 monolayer. According to our results, pristine SiP2 monolayers show excellent adsorption behavior towards the Li, Na, and Mg atoms with adsorption energy of −3.12 eV, −2.45 eV, and −2.55 eV, respectively. After adsorption on alkali metal atoms (Li, Na, Mg), SiP2 turns metallic with good conductivity. Transition metal (Cr, Mn, Co) doping-induced magnetic behavior in the non-magnetic SiP2 monolayer, and the adsorption energy decreases greatly after doping. The pristine SiP2 monolayers have a diffusion barrier of 0.82 eV and 0.28 eV for Li and Na atoms with a specific capacity of 209 mA h g−1 and 188 mA h g−1. For the Mg atom, the calculated specific capacity is 373 mA h g−1 with a very low diffusion barrier of 0.06 eV. We are hopeful that our research will encourage additional theoretical and experimental work on utilizing 2D SiP2 for use in energy storage.
Conflicts of interest
There are no conflicts to declare.
References
- B. Diouf and R. Pode, Renewable Energy, 2015, 76, 375–380 CrossRef.
-
R. Boddula, R. Pothu, A. M. Asiri, et al., Rechargeable Batteries: History, Progress, and Applications, John Wiley & Sons, 2020 Search PubMed.
- Y. Bahari, B. Mortazavi, A. Rajabpour, X. Zhuang and T. Rabczuk, Energy Storage Mater., 2021, 35, 203–282 CrossRef.
- K. Fan, Y. H. Tsang and H. Huang, Mater. Rep.: Energy, 2023, 100213 CAS.
- N. Gupta, S. Rani, P. Kumari, R. Ahuja and S. J. Ray, Carbon, 2023, 215, 118437 CrossRef CAS.
- K. Kumari, A. Kumar, D. K. Kotnees, J. Balakrishnan, A. D. Thakur and S. Ray, J. Alloys Compd., 2020, 815, 152213 CrossRef CAS.
- A. Sibari, A. Marjaoui, M. Lakhal, Z. Kerrami, A. Kara, M. Benaissa, A. Ennaoui, M. Hamedoun, A. Benyoussef and O. Mounkachi, Sol. Energy Mater. Sol. Cells, 2018, 180, 253–257 CrossRef CAS.
- S. Zhao, W. Kang and J. Xue, J. Mater. Chem. A, 2014, 2, 19046–19052 RSC.
- H. Benzidi, M. Lakhal, M. Garara, M. Abdellaoui, A. Benyoussef and O. Mounkachi,
et al.
, Phys. Chem. Chem. Phys., 2019, 21, 19951–19962 RSC.
- Y. Wu, C. Ren and Q. Wei, Appl. Surf. Sci., 2023, 615, 156322 CrossRef CAS.
- S. Ray, Sens. Actuators, B, 2016, 222, 492–498 CrossRef CAS.
- X. Chen, Z. Kong, N. Li, X. Zhao and C. Sun, Phys. Chem. Chem. Phys., 2016, 18, 32937–32943 RSC.
- S. Das, S. U. D. Shamim, M. K. Hossain, F. Ahmed, M. A. Hossain and M. O. Rahman, Appl. Surf. Sci., 2022, 600, 154173 CrossRef CAS.
- S. Zaidi, S. Hassan, M. Raza and F. Walsh, Int. J. Electrochem. Sci., 2021, 16, 210322 CrossRef CAS.
- S. Sahoo, P. Kumari and S. Jyoti Ray, J. Appl. Phys., 2023, 134, 104302 CrossRef CAS.
- F. Xiong and Y. Chen, Nanotechnology, 2021, 32, 025702 CrossRef CAS PubMed.
- G. Chaney, A. Ibrahim, F. Ersan, D. Çakr and C. Ataca, ACS Appl. Mater. Interfaces, 2021, 13, 36388–36406 CrossRef CAS PubMed.
- M. K. Butt, J. Rehman, Z. Yang, S. Wang, A. El-Zatahry, A. S. Alofi, M. D. Albaqami, R. G. Alotabi, A. Laref and K. Jin,
et al.
, Phys. Chem. Chem. Phys., 2022, 24, 29609–29615 RSC.
- P. Panigrahi, S. B. Mishra, T. Hussain, B. R. K. Nanda and R. Ahuja, ACS Appl. Nano Mater., 2020, 3, 9055–9063 CrossRef CAS.
- P. Kumari, S. Majumder, S. Rani, A. Nair, K. Kumari, M. V. Kamalakar and S. Ray, Phys. Chem. Chem. Phys., 2020, 22, 5893–5901 RSC.
- A. Nair, P. Kumari, M. V. Kamalakar and S. Ray, Phys. Chem. Chem. Phys., 2019, 21, 23713–23719 RSC.
- S. Kar, P. Kumari, M. V. Kamalakar and S. Ray, Sci. Rep., 2023, 13, 13696 CrossRef CAS PubMed.
- N. Gupta, S. Sachin, P. Kumari, S. Rani and S. J. Ray, RSC Adv., 2024, 14, 2878–2888 RSC.
- P. Zhang, E. Jiang, T. Ouyang, C. Tang, C. He, J. Li, C. Zhang and J. Zhong, Comput. Mater. Sci., 2021, 188, 110154 CrossRef CAS.
- S. K. Matta, C. Zhang, Y. Jiao, A. O'Mullane and A. Du, Nanoscale, 2018, 10, 6369–6374 RSC.
- Z. Wang, P. Luo, B. Han, X. Zhang, S. Zhao, S. Wang, X. Chen, L. Wei, S. Yang and X. Zhou,
et al.
, ACS Nano, 2021, 15, 20442–20452 CrossRef CAS PubMed.
- A. SpringThorpe, Mater. Res. Bull., 1969, 4, 125–128 CrossRef CAS.
- T. Wadsten, Crystal structures of SiP2, SiAS2 and GeP, Acta Chem. Scandinavica, 1967, 21, 593–594 CrossRef CAS.
- X. Liu, R. Yao, S. Wang, Y. Wei, B. Chen, W. Liang, C. Tian, C. Nie and Y. Chen,
et al.
, J. Energy Chem., 2023, 83, 564–573 CrossRef CAS.
- O. I. Malyi, K. V. Sopiha, I. Radchenko, P. Wu and C. Persson, Phys. Chem. Chem. Phys., 2018, 20, 2075–2083 RSC.
- S. Smidstrup, T. Markussen, P. Vancraeyveld, J. Wellendorff, J. Schneider, T. Gunst, B. Verstichel, D. Stradi, P. A. Khomyakov and U. G. Vej-Hansen,
et al.
, J. Phys.: Condens. Matter, 2020, 32, 015901 CrossRef CAS PubMed.
- S. Ray and M. V. Kamalakar, Phys. Chem. Chem. Phys., 2018, 20, 13508–13516 RSC.
- S. Rani and S. Ray, Phys. Chem. Chem. Phys., 2020, 22, 11452–11459 RSC.
- D. C. Liu and J. Nocedal, Math. Program., 1989, 45, 503–528 CrossRef.
- W. S. Morgan, J. J. Jorgensen, B. C. Hess and G. L. Hart, Comput. Mater. Sci., 2018, 153, 424–430 CrossRef CAS.
- S. Grimme, J. Comput. Chem., 2006, 27, 1787–1799 CrossRef CAS PubMed.
- G. Henkelman, B. P. Uberuaga and H. Jónsson, J. Chem. Phys., 2000, 113, 9901–9904 CrossRef CAS.
- X. Zhang, S. Wang, H. Ruan, G. Zhang and X. Tao, Solid State Sci., 2014, 37, 1–5 CrossRef.
- S. Chaudhuri, A. K. Das, G. P. Das and B. N. Dev, Phys. B, 2023, 655, 414701 CrossRef CAS.
- G. K. Madsen and D. J. Singh, Comput. Phys. Commun., 2006, 175, 67–71 CrossRef CAS.
- J. Park and S. A. Fatima, Appl. Surf. Sci., 2023, 638, 158024 CrossRef CAS.
- X. Lv, F. Li, J. Gong, J. Gu, S. Lin and Z. Chen, Phys. Chem. Chem. Phys., 2020, 22, 8902–8912 RSC.
- X. Xia, H. Yin, Y. Zhang and S. Huang, Surf. Interfaces, 2023, 36, 102479 CrossRef CAS.
- X. He, R. Wang, H. Yin, Y. Zhang, W. Chen and S. Huang, Appl. Surf. Sci., 2022, 584, 152537 CrossRef CAS.
- S. Ahmad, H. Din, S. Nawaz, S.-T. Nguyen, C. Q. Nguyen and C. V. Nguyen, Appl. Surf. Sci., 2023, 632, 157545 CrossRef CAS.
- D. Wang, Y. Liu, X. Meng, Y. Wei, Y. Zhao, Q. Pang and G. Chen, J. Mater. Chem. A, 2017, 5, 21370–21377 RSC.
- X. Xia, J. Wu, X. Cai, B. Liu, Z. Wang, Y. Zhang and S. Huang, Dalton Trans., 2023, 52, 10895–10904 RSC.
- K. Wang and X. Luo, ACS Omega, 2022, 7, 36848–36855 CrossRef CAS PubMed.
- A. Nair, C. Da Silva and C. Amon, J. Appl. Phys., 2023, 133, 064302 CrossRef CAS.
- S. Oukahou, A. Elomrani, M. Maymoun, K. Sbiaai and A. Hasnaoui, Comput. Mater. Sci., 2022, 202, 111006 CrossRef CAS.
- Z. Wang, A. P. Ratvik, T. Grande and S. M. Selbach, RSC Adv., 2015, 5, 15985–15992 RSC.
- U. Germgård, Nord. Pulp Pap. Res. J., 2017, 32, 21–24 CrossRef.
- Q. Gao, X.-J. Ye and C.-S. Liu, Phys. Chem. Chem. Phys., 2023, 25, 6519–6526 RSC.
- X. Lv, W. Wei, Q. Sun, B. Huang and Y. Dai, J. Phys. D: Appl. Phys., 2017, 50, 235501 CrossRef.
- N. Duhan, B. Chakraborty and T. D. Kumar, Appl. Surf. Sci., 2023, 629, 157171 CrossRef CAS.
Footnote |
| † Electronic supplementary information (ESI) available: Additional information/data related to the claims made in the main manuscript. See DOI: https://doi.org/10.1039/d3ma01079a |
|
| This journal is © The Royal Society of Chemistry 2024 |

 Open Access Article
 This Open Access Article is licensed under a Creative Commons Attribution-Non Commercial 3.0 Unported Licence
 ,
Puja
Kumari
and
Soumya Jyoti
Ray
,
Puja
Kumari
and
Soumya Jyoti
Ray
 is the curvature of the local band energy. The mobility of the charge carriers was calculated where we have implemented the isotropic method and provided an inverse relaxation time. The isotropic scattering rate approach in QuantumATK is implemented in the same way as BoltzTrap.40 The tetrahedron approach is used to carry out the energy integrations. The calculated effective mass and mobility of the charge carrier along the a,b-directions are listed in Table S3 (ESI†).